TOTAL2 - Sideways PeriodsThree boxes, movements within each are often sideways leading to bull moves
Currently we are experiencing a bull move on TOTAL2.
Lets goo
Crypto market

Market Analysis and NEO Coin Technical Analysis🔍The market is still ranging, and we are waiting for our triggers to be activated before opening positions.
📆 Coin of the Day: NEO
About the Project
NEO is one of the older projects in the crypto space with its own blockchain, currently ranked 85 on CoinMarketCap, and part of the top 100 coins.
🧩 Technical Analysis
4-Hour Timeframe
This analysis is for trading in futures, examining different scenarios.
♟ Support and Resistance : After a bearish move, the price has found support at 14.39. Since then, the price has been ranging, with three touches at this support level. However, no single high has formed; instead, there are two resistance levels at 15.88 and 16.91.
📉 Bearish Scenario : If a candle closes below 14.39, the next bearish phase might start, with the first support target at 13.31. A break below 35.47 on the RSI could confirm the bearish momentum.
📈 Bullish Scenario : If the price breaks above 15.88, we can look for a target at 16.91. A break above 16.91 would set the next target at 19.17. A break above the 50 level on the RSI could confirm the entry of bullish momentum into the market.
Volume Analysis
The market volume has been steadily decreasing, and since today is Saturday, the volume is especially low. Lower volume indicates that the next market move could be very sharp.
👨💻 Trading Positions
Long Position
Entry Trigger: Break above 15.88
Strategy: Open a position on the break of 15.88 and wait for confirmation from the price to set the target. Consider closing the position or taking profits based on price action and market conditions.
Short Position
Entry Trigger: Break below 14.39
Strategy: Open a position on the break of 14.39 as this is a very critical level in the market. After the break, this level could provide a good risk-to-reward ratio.
📝NEO is currently ranging within key support and resistance levels. Traders should watch for breaks of these critical levels to open positions. Volume analysis suggests that the next move could be sharp due to the low trading volume, especially on a weekend. Long positions should be considered above 15.88, while short positions should be considered below 14.39. Always keep an eye on the RSI for confirmation of momentum in either direction.
🧠💼It's important to acknowledge the inherent risks in futures trading, with the potential for margin calls if risk management is neglected. Always adhere to strict capital management principles and utilize stop-loss orders, ensuring that the initial target offers a risk-to-reward ratio of 2.
🫶If you enjoyed this analysis and want to support me, please boost this analysis. Feel free to leave a comment or suggest a coin you'd like me to analyze next.

BTC Fails to beat ATH- 73K ZoneFor the last couple of days to weeks bitcoin has failed to make a significant move above 73-74k zone. there has been a consolidation happening around 68k-70k zone and I think the pair has to retreat first to pick some momentum before it can burst the previous highs.
Area of focus remains to be 60k, lowest 58k. Lets me know what you think

Good analysis and advice may make you moneyHello friends,
ETH/USDT Brief Update
Ethereum (ETH) is currently trading within a head and shoulders pattern on the 4-hour timeframe, as seen in the chart. Here are the key points:
ETH is showing a head and shoulders formation, which typically signals a potential bearish reversal.
Resistance and Support:
Around $3,950 to $4,000 (highlighted by the left and right shoulders).
Close to $3,640 (lower boundary of the pattern).
A breakout above the right shoulder (~$3,850) could lead to further gains.
A breakdown below the support level (~$3,640) would confirm the head and shoulders pattern, which signals a potential decline.
Monitor the $3,850 resistance level for signs of a breakout.
Keep an eye on a potential breakdown below $3,640 for bearish confirmation.

NOTUSDT IDEAHello Traders Hope You Are Enjoying Our Analysis. Today We Will Discuss About NOT
(Analysis)
The Bullish Pennant Successfully Breakout On 1H Timeframe☑️
Running In +20% Profit So Far & I Expecting More Profit In Coming Days

NOTCOIN IS NOTOlivetti's moves and clear waves for the Natcoin chart with ABC's modifications are quite evident

WIFUSDT long move with strong supportGood Evening people,
i would like to share this trade idea and am humbly requesting your feedback on it.
i have drown clear support and resistance levels for WIF which is a very popular Solana based Meme coin which so far has left quite a few o the established coin far behind in terms of speed and intensity of price action.
i believe we can expect a minimum 4:1 risk to reward ratio even if it doesn't quickly establish a new ATH.
please dissect my chart and share your views.
This is my own trade plan and not trading or investment advise.

#FLOKI / USDT inverted head and shoulder. What is next?CRYPTOCAP:FLOKI gained 20% yesterday, indicating that its previous consolidation phase has ended. Are we going to see more uptrend?
What do we know?
CRYPTOCAP:FLOKI has a motivated team with a roadmap to become the most traded crypto in the world!
CRYPTOCAP:FLOKI has just been listed on Coinbase perp futures, similar to CRYPTOCAP:BONK and $PEPE. This shows that it is likely following in their footsteps, albeit a little later; both saw a 50% increase after their listings.
CRYPTOCAP:FLOKI has some utility compared to other memes, with integration into TokenFi, use as the native currency of Valhalla (a metaverse), and other projects.
Regarding the charts, I see an inverted head and shoulders pattern, a bullish signal with a target of 0.0004754, which represents a 65% pump. This aligns with the pumps seen in CRYPTOCAP:PEPE and CRYPTOCAP:BONK after their Coinbase listings.
I also see a parabolic trend that seems to continue for now.
There is a bearish divergence due to a CRYPTOCAP:BTC dump, which pushed down the RSI in the middle of the uptrend. In my opinion, this will not have any lasting effect since it was due to an external, temporary factor, but it needs to be mentioned.
The take profits are the fib extension.
Not a financial advice, DYOR.

ZERO: $0.0005 | Is this a Better AAVE or the next LiDOthere are a handful of projects in t he LiNEA network
a fresh and promising future for early investors
like in its mascott meme coin FOXY
this dont have airdoprs but it gives rewards for stakers
like that TiA or JUPiTER it suprised stakers with decent airdropssssss
price is decent at the low relative to big LENDING projects PENDL ONDO AAVE NEXO CRV and LiDO
think of this like PROMOTIONAL price before it decides to peg this above $100M gunning for FWB:5BN levels to dominate the next generation of STAKERS with a solid network of VCs.. .
it could tap BLACKROCKS portion of $7 trillion ++ rolling in

78980 next tp BTC now prepared for new ATH which will be around 78980 plus minus , this may be the last rally of 1st bullish rally , still time to decide , if this is last rally which confirmed triggered recession pullback of all world financial intrument to ground , floor inclu nasdaq gold


Trend lines are also lagging(?)Hello, traders.
If you "Follow", you can always get new information quickly.
Please also click "Boost".
Have a nice day today.
-------------------------------------
I think trend lines are drawn to find out the trend that appears when candles are formed.
Therefore, since they are drawn after candles are formed, they can be called lagging.
However, since there is a characteristic of moving along a trend that has been formed unless there is a special issue, chart analysis is done by referring to trend lines.
To draw trend lines, you need to understand the arrangement of candles.
If not, there is a high possibility that it will be a meaningless line, so you need to study candles in advance to draw trend lines.
The point to use as a reference when drawing trend lines may vary depending on your investment style.
When drawing a trend line, I draw it according to the following rules.
1. Connect the opening price of the falling candle among the price candles corresponding to the high point of the StochRSI indicator (indicated by the blue line)
2. Connect the low point of the price candles corresponding to the low point of the StochRSI indicator (indicated by the light green (#00FF00) line)
The setting values of the StochRSI indicator are 3, 3, 14, 7 (K, D, RSI, Stoch).
However, the source value is the value of the Heikin-Ashi candle (Open + Close) / 2.
The difference can be confirmed by the StochRSI indicator and the Stoch RSI indicator of the TS - BW indicator on the chart.
1. Use the high point formed when the StochRSI indicator rises above 80,
2. Use the low point formed when the StochRSI indicator falls below 20.
Exclude any low or high points formed other than these.
The trend line connecting the low points can be connected by connecting the low points of the price candles.
However, the trend line connecting the high points must connect the opening price of the falling candle among the price candles, so when the price candle where the high point of the StochRSI indicator is formed is an upward candle, the opening price of the first falling candle among the right candles is specified and used.
Therefore, since there is a difference between the StochRSI indicator of the TS -BW indicator and the general StochRSI indicator, it is recommended to use the StochRSI indicator formula of the TS - BW indicator if possible.
When the StochRSI indicator entered the oversold zone and formed two low points, the trend line was not drawn by connecting the two low points.
Therefore, the trend line is drawn as shown on the chart.
Both the most recently drawn trend lines (1) and (2) are down, so it seems likely that a change in trend will occur.
However, since it is virtually impossible to know with just the trend line, it is recommended to comprehensively evaluate by adding auxiliary indicators.
Therefore, it is recommended to refer to the BW indicator, which displays MACD, StochRSI, CCI, PVT, and SuperTrend indicators.
If the BW indicator is rising from the 0 point, it means that the trend is rising.
On the contrary, if it is falling from the 0 point, it means that the trend is falling.
Since the BW indicator is currently above the 0 point, we can see that the trend is rising.
Therefore, when looking at the trend line and the BW indicator comprehensively, we can respond by selling when it falls from the recently drawn trend lines (1) and (2).
However, since the BW indicator is in an upward trend, it is recommended to respond with a split sell rather than a 100% sell.
It is still difficult to determine the timing of trading with the trend line alone.
Therefore, it is recommended to select the timing of trading by indicating the support and resistance points.
In that sense, it is a good idea to add HA-Low, HA-High indicators and use them to select the trading period.
Even if you do not use HA-Low, HA-High indicators, you should draw support and resistance lines according to the arrangement of candles on the 1M, 1W, and 1D charts and mark them on the chart to select the trading period.
The good thing about using indicators that indicate support and resistance points is that the support and resistance points do not change depending on your psychological state.
When you start trading, your psychological state may become unstable due to price volatility, and if you are in an unstable psychological state, you may draw a line incorrectly, which may result in an unreliable line.
Have a good time.
Thank you.
--------------------------------------------------
- Big picture
It is expected that a full-scale uptrend will begin when it rises above 29K.
The next expected range to touch is 81K-95K.
#BTCUSD 12M
1st: 44234.54
2nd: 61383.23
3rd: 89126.41
101875.70-106275.10 (overshooting)
4th: 13401.28
151166.97-157451.83 (overshooting)
5th: 178910.15
These are points that are likely to receive resistance in the future.
We need to check if these points can be broken upward.
We need to check the movement when this range is touched because it is thought that a new trend can be created in the overshooting range.
#BTCUSD 1M
If the major uptrend continues until 2025, it is expected to start forming a pull back pattern after rising to around 57014.33.
1st: 43833.05
2nd: 32992.55
-----------------

JASMYUSDT IDEAHello Trading view Family / Fellow Traders.
I hope you have used and benifited from the previous analysis .
In today trading session we are monitoring JASMYUSDT for a buying opportunity,
JASMYUSDT UPDATE
Moving Exactly As we Predicted , Finally Achieved around +55% Profit with in short time ✅ 💥

$GST one last exit pump?LSE:GST has been in a downtrend since the beginning of March, I think we could see one last exit pump up to the two resistances higher before continuing down.
If you can time this properly, looks to be great gains in a short period of time.

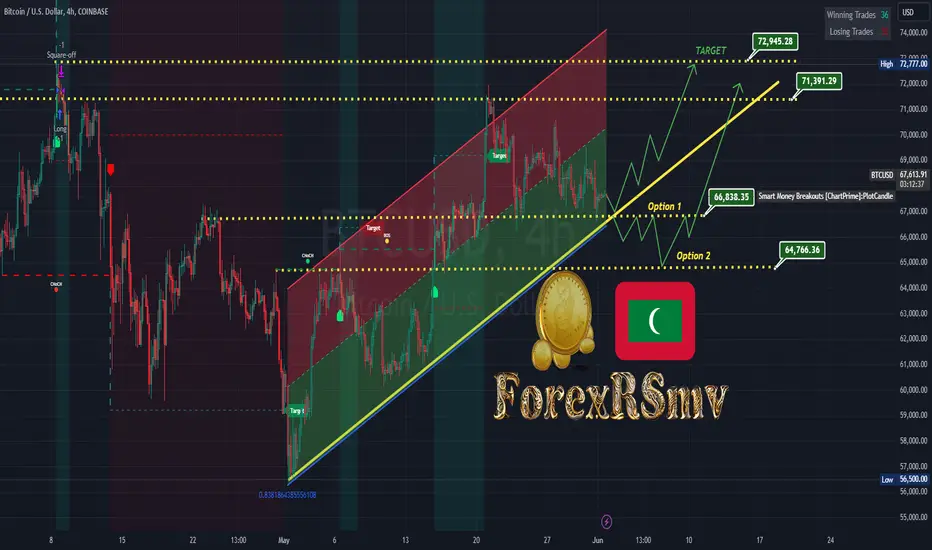
BTCUSD IDEAThe price is still in consolidation.
Now we need to watch for the reaction to the mentioned area :-
(66838-66000-64766 Support ).
If the bulls hold, then the price will head towards the resistance. But, most likely, the market has not yet accumulated the proper potential and the price may go deeper and test the support at 64500 before going up.
But, there is no talk about a crash or a global fall now.
PYTH BOOMThe information and publications are not meant to be, and do not constitute, financial, investment, trading, or other types of advice or recommendations supplied or endorsed by TradingView. Read more in the Terms of Use.

BTCUSD BUYMarket sweeps PDL with strong displacement to the up side with MSS and IMB and breaker entry at the 50% of IMB and target 1:2RRR lets see how it goes


Potential Short (Waves)Technical Indicators Analysis
RSI (Relative Strength Index):
An RSI above 70 (93.52) typically indicates that a security is overbought. Assuming that the RSI is currently high (overbought), it supports the case for a short position.
Wave Analysis:
Wave patterns suggest that the price might be completing a wave 5 of an impulse wave, followed by a corrective wave (a).
This pattern indicates a potential reversal or correction, aligning with the short position strategy.
Trade Setup Summary
Entry: 0.11248
Take Profit: 0.08810
Stop Loss: 0.12400
Additional Considerations
Market Sentiment : Consider the overall market sentiment and any upcoming news that might impact the price of PEOPLE/USDT.
Volume Analysis : Ensure that there is sufficient volume to support your trade decision. High volume at the entry point can validate the strength of the trend.
This trade setup provides a clear risk-reward ratio and leverages both RSI and wave analysis to identify a potential short opportunity. Always consider the latest market data and adjust your stop loss and take profit levels accordingly to mitigate risks

WLD Perfect Reversal Trade Soon! Keep WatchWLD has been trading alongside a bullish trendline. This trade is based on the idea that this bullish support line will hold and cause the price to reverse from there.
Stop just below the May lows, target at the current all-time high (ATH).

SHIB: Remember this level! If you're looking to trade SHIB at the moment, here's a quick setup that you might find helpful!
The idea is: Buy when the price breaks above 0.0000271$ and take profits at the levels shown in the chart.
Targets:
1. 0.0000279$
2. 0.0000293$
3. 0.0000305$
-------------------------------------------
About our trades:
Our success rate is notably high, with 10 out of 11 posted trade setups achieving at least their first target upon a breakout price breach (The most on TW!). Our TradingView page serves as a testament to this claim, and we invite you to verify it!

Doge coin gold signal BINANCE:DOGEUSDT #2h,
We are expecting to see a reversal from the horizontal level of support that we are currently retesting. Which will lead to a strong movement to the upside that will help us breaking from above of the declining parallel channel. Switching from short term bearish to short term bullish.
thank you

WLD COIN SUPER BULLISHWLD coin is still trading over these two ascending trend lines and is currently approaching the top line as support. I'm bullish on WLD in the long term, but it can go down to the bottom trend line if BTC goes bear. Since April 13 WLD has been trading between the 200 and 100 SMA on the daily time frame. In the short term I'm looking for a swing trade back to the 100 SMA. Not financial advice
