Gold next move we are on the wave 4 and waiting for the price to hit or level on 0,382 of fib
we just need to take our comfomation after the price come back to our 0.5 and 0.6 level
so we can get a nice trade in this week by taking a sell and buy position
Futures market

What could possible happen to GOLD this coming week?EIGHTCAP:XAUUSD
GOLD outlook for the coming week. After a massive $82 drop from Friday, we are expecting to see a retracement towards the upside. Why? We need a narrative evidence for the market to go lower, and that will be either the 4H FVG, or the Daily Bearish OB. I will update a lower timeframe analysis for the context.

Market Crash - ES Ascending Wedge, Volatility & DistributionES has been fairly volatile lately, but somehow has always seemed to end up in the 5300 area. I'm seeing this as potential distribution, and I think the failure to break ATH and sustain above on Friday could be a potential double top and we have an ascending wedge as well.

Gold idea Gold is in indecision stage right now,
If market break the horizontal line @ 2283.22 DOWNWARD and likely retest., It's sure gold will continue bearish move till 2100 price... Bag🙌
But if go bullish from this point.. then consider Gold to be bullish continuously...
There is COOL MONEY IN THE WAITING... let wait for it

XAUUSD BuyGold is moving in a range from last week now it looks like gold will have buying rally and now it will move upwards

WHAT IS TRADING ACCOUNT DRAWDOWN | 3 Types Of Drawdown Explained
In my videos, I frequently use the term "trading account drawdown ".
Many of you asked me to explain the meaning of that term and share some examples.
What is Trading Account Drawdown?
The account drawdown is the highest observed loss from the highest
value of the deposit to the lowest value of the deposit at
a certain period of time.
Imagine you started to trade with 10,000$ account.
At the end of the year, your account size reached 15,000$ .
However, at some point through the year the deposit value dropped to 6,000$ . It was the absolute minimum for the one-year period.
At some point, your net loss was -4,000$ or 40% of your account balance.
The account drawdown is 40% .
❗️Knowing the account drawdown is very important for the risk assessment of the trading strategy. Usually, 50% and bigger drawdown signifies an extremely high risk.
3 Types of Drawdown
1. Current drawdown - a temporary drawdown associated
with the negative total value of opened trading position(s)
at present.
Once you start trading with 10,000$ deposit, you open several trading positions. Being opened, with the constant price movements, your potential gains fluctuates from positive to negative.
For example, with 3 active trades :
EURUSD ( -500$ at present);
GBPUSD ( +200$ at present);
GOLD ( -100$ at present)
Your current account drawdown is -400$ or 4% of your deposit.
2. Fixed drawdown - the negative value of the closed trading
position(s) at present for a certain period of time.
While some of your trades remain active, some are already closed .
Imagine the same deposit - 10,000$ .
On Monday you opened 6 trades,
2 still remain active ;
4 are already closed .
Your total loss from your closed trades is -500$. Your fixed Monday's drawdown is 5%.
3. Maximum Drawdown - the maximum observed loss from
the highest value of the deposit before a new maximum
is reached.
Starting to trade with 10,000$ you are already trading for 5 years .
Your account were growing rapidly and at some moment it reached 25,000$ . Then the recession started. You faced a dramatic loss of 12,500$ before you started to recover.
That was the maximum observed loss for the period.
Your maximum account drawdown was 50% .
❗️Different types of drawdown give a lot of insights about a trading strategy. Its proper assessment will help to spot a high risk strategy and to find a conservative one.
Constantly monitor your account drawdown and always check the numbers.
What is your highest account drawdown?

Buyers' appetite for gold eases due to strong NFP employment
Looking at the trend in the 4-hour time frame, gold has formed a HEAD&SHOULDERS pattern, which has now broken the NECK LINE support at the 2323 area to the bottom, as a result, the rate after the pullback could be as high as the head of the pattern to the support. Fibo is 161.8% lower at $2219.

xauusd analysisOn last monday we have posted a chart analysis major bullish and bearish points of xauusd. And all our targets were hit ✅✅✅✅
BULLISH:
2335 ✅✅✅
2343 ✅✅✅
2347 ✅✅✅
2355 ✅✅✅
2367 ✅✅✅
2376 ✅✅✅
2398
BEARISH;
2321 ✅✅✅
2312 ✅✅✅
2298 ✅✅✅
2287 ✅✅✅
2282
our analysis for monday june 10 2024
as xauusd has fallen around 120 points or 1200 pips from its top of 2388 on friday a possible retracement can be elicited out.
if the support area from 2288-2282 is not breached then xauusd will fly back to 2333 area where it has major resistance
minor resistance are present in 2304 2315 2321
more updates will be posted soon.
please like share and follow us for more market related updates

Overview of important economic events in the past 2 weeks: XAU ⭐️ Smart investment, Strong finance
⭐️ GOLDEN INFORMATION:
The past 2 weeks have witnessed a lot of important economic news such as: ISM Manufacturing PMI,
JOLTS Job Openings, ADP - NF, PMI, Unemployment Claims, CB Consumer Confidence, GDP, PCE,
Pending Home Sales m/m
As the overview chart shows: it can be seen that most of the economic data is not good for the dollar - DXY decreased - XAU increased and stabilized to recover.
The US economy near the US election is quite gloomy - not showing positive recovery + war conflicts in the world (Russia - Ukraine / Israel - Palestine) are still tense
⭐️ Personal opinion:
US macroeconomic factors are not supporting the economy - Gold is still a safe and effective investment channel at present.
⭐️ Technical analysis:
Long-term H1, H4 time frame, after Gold price broke 2350 thanks to positive impact from economic data. Gold price tends to increase greatly, returning above the 2400 area
Pay attention to resistance zones: $2400 , $2430 , $2450
⭐️ NOTE:
Note: Nova wishes traders to manage their capital well
- take the number of lots that match your capital
- Takeprofit equal to 4-6% of capital account
- Stoplose equal to 2-3% of capital account
- The winner is the one who sticks with the market the longest

Gold full analysis 📎GOLD/XAUUSD ANALYSIS:
💬🕯The recent non-farm payroll data has had a bearish impact on spot gold, causing a significant sell-off and driving prices down to a low of 2295. This downturn has disrupted the previous upward trajectory of gold, indicating a pronounced downtrend. It's anticipated that gold will remain under bearish pressure. Investors should monitor the 2300\2289 support zone closely. A sustained price above this level could lead to volatility, while a drop below it may signal the beginning of a further decline.
Market patterns suggest that gold prices are caught in a tug-of-war between bulls and bears, characterized by a cycle of rising and falling prices. This has resulted in a flared, trumpet-like pattern of fluctuating prices. Despite these oscillations, prices are still within a corrective phase, suggesting that it's premature to predict a solid trend based solely on individual news events. Currently, gold has reached the critical support level of 2295, which marks a potential turning point, and is showing signs of stabilization. Moving forward, the ability of gold to close the week above 2325 will be crucial in determining whether it can maintain stability.
For short-term strategies next Monday, it is advisable to prioritize buying on dips, with a secondary focus on selling during price rebounds.
The immediate
resistance to watch is between (2322-2331), (2351-2360)
support is expected in the (2300-2289) range.

Bulls see it as a sell signal Medium-Term
Fundamental analysis:
Middle East Crisis (Iran and Israel)
They run away from every fight (battle, war .. :) , we know this means "Decreasing tensions in the Middle East"
Technical analysis:
Wave C = 123.6% of Wave A
Bulls see it as a sell signal
Conclusion:
This market needs a correction

Gold → an update for xauusdhello guys...
gold FXOPEN:XAUUSD is on an ascending channel but after the sharp movement I think it will be on the downward compression for a while!
what do you think?!
if the gray area breaks up it would be bullish again and we can count on it!
___________________________
✓✓✓ Always do your research.
❒❒❒ If you have any questions, you can write them in the comments below, and I will answer them.
❤︎ ❤︎ ❤︎And please don't forget to support this idea with your likes and comment

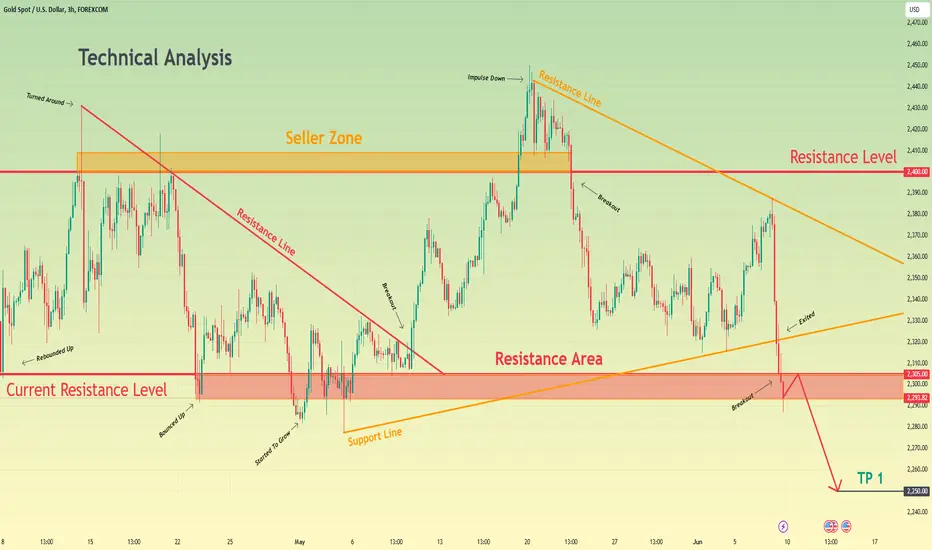
Gold can rebound from resistance level and continue to fallHello traders, I want share with you my opinion about Gold. By observing the chart, we can see that the price rebounded up from the current resistance level to the 2400 level, which coincided with the seller zone and even rose higher, but when it reached the resistance line, the price turned around and started to fall. In a short time, the price declined to the resistance area, breaking 2400 and 2305 levels, and some time traded near the resistance area. Later, the price fell lower than the 2305 level again and entered to upward pennant, where it turned around of support line and made a strong impulse up to the resistance line, breaking the 2305 level one more time and also the resistance line with the 2400 level. Soon, the price turned around and in a short time declined from the resistance line of the pennant to the support line, breaking the 2400 level again. After this movement, Gold tried to rise and even reached the resistance line of the pennant, after which it made a strong impulse down, thereby exiting from this pattern and recently broke the 2305 level too. Now, the price trades inside the resistance area, and in my opinion, Gold can rebound from the resistance level and continue to decline, therefore I set my target at 2250 points. Please share this idea with your friends and click Boost 🚀
Gold pulls back to key structureDear traders! Gold's return to a key support structure follows an update to a high of $2,387.
=)2332 USD would be a good entry point to buy on the next bull run!
This is also the previous resistance structure.
If the price forms a Bullish Pin Bar
After touching 2332 USD, the opportunity will be better, because the general fundamentals of the market are still positive.

Market Crash - Dow Weakness and Ascending WedgeHere with yet another ascending wedge. The dow recently went on a huge run, I believe 8 green days in a row or something close to that. It topped out near ATH and nearly retested it's ascending channel before becoming extremely weak. It has now breached several support levels and has failed on retests while forming an ascending wedge and closing below on Friday. I expect a gap down on Monday and further downside throughout the week.

XAUUSD. Weekly trading levels 10.06.2024 - 14.06.2024During the week you can trade from these price levels. Finding the entry point into a transaction and its support is up to you, depending on your trading style and the development of the situation. Zones show preferred price ranges WHERE to look for an entry point into a trade.
If you expect any medium-term price movements, then most likely they will start from one of the zones.
Levels are valid for a week, the date is in the title. Next week I will adjust the levels based on new data and publish a new post.
! Please note that brokers have a difference in quotes, take this into account when trading.
The history of level development can be seen in my previous posts. They cannot be edited or deleted. Everything is fair. :)
----------------------------------------------
I don’t play guess the direction (that’s why there are no directional arrows), but zones (levels) are used for trading. We wait for the zone to approach, watch the reaction, and enter the trade.
Levels are drawn based on volumes and data from the CME. They are used as areas of interest for trading. Traded as classic support/resistance levels. We see the reaction to the rebound, we trade the rebound. We see a breakout and continue to trade on a rollback to the level. The worst option is if we revolve around the zone in a flat.
Do not reverse the market at every level; if there is a trend movement, consider it as an opportunity to continue the movement. Until the price has drawn a reversal pattern.
Don't forget to like Rocket and Subscribe!!! Feedback is very important to me!

Market Crash - ES 1D Red Flags & Blow Off Top RallyIf you don't know already, my entire trading strategy is essentially based around dow theory. I am going against my own strategy a bit by attempting to pick a top, which according to dow theory, is a losing strategy. The trend is your friend, etc. However, dow theory also states that a trend has to be confirmed by volume, otherwise it is invalid. SPY had several days where it was the lowest volume in years.
There were also a couple of two day periods that set a record for the lowest volume in consecutive days in years. This happened twice, first it had two days in a row of extremely low and abnormal volume, then later in the rally, it had another consecutive two days that were even lower than the previous two. Highly unusual.
On top of this, I believe we are experiencing a blow off top rally that will ultimately end in an extended bear market. One of the confirmations for this is the recent greed and meme stock mania we've seen in the market along with the adoption of crypto and the ensuing rally. Everyone expect BTC to hit $100k, and I did too. But now, I expect it to take a lot longer than I first thought. Meme stock rallies have marked major market tops every single time.

Upcoming gold movement 08-Jun onwardsBased on my analysis the gold might move further down to 2229 or 2171 area before the bounce back which is respectively 100 and 161 Fi level based on 1 Hour chart. If you look into the regression channels the gold now bouncing back in both daily and weekly channels aligning to the above-mentioned level probability. The shared information is for analysis purpose only .

Silver 4 hour chartThis must resolve first.
nothing to see
until this resolves
run up=>resolves
#silver
#spx

Silver to >$35 if support holds Silver is at a crucial point which will more than likely be resolved very soon with CPI and FOMC meeting this week.
There is a very strong confluence of support at current levels. The obvious accumulation cylinder is very much still intact.
Any break below $28.50 is extremely bearish, below $26 means it's all over.
If the bull flag is broken to the upside and a daily candle closes above $32.50, we are likely headed to the $35-40 range before another pause.

USOIL SENDS CLEAR BEARISH SIGNALS|SHORT
Hello,Friends!
It makes sense for us to go short on USOIL right now from the resistance line above with the target of 73.84 because of the confluence of the two strong factors which are the general downtrend on the previous 1W candle and the overbought situation on the lower TF determined by it’s proximity to the upper BB band.
✅LIKE AND COMMENT MY IDEAS✅

Possible Retest for WTI Crude Oil.WTI Crude Oil has been in a consolidation Phase since the beginning of the month. After breaking out of it recently, I expect the price to go up the decision Point Zone and to then drop.
Lets see if this trade works out.
TVC:USOIL

Silver Short Part 2I've posted some bearish ideas on silver lately with some longer term patterns that made me bearish before the recent sell off. It recovered some today, but looks like another good short opportunity to me. Here's a shorter term chart with an ascending wedge (an ugly one) and some levels. No guarantee it'll work again just because it worked for me earlier in the week, but I like the short. I think it'll fail here, my target is the $29 area or just below.
I'll have to give up on the idea if it breaks out above today's high tomorrow.
