GME About To WaterfallGME SAVE THE TAPE!
Back in June 2021, I warned people to GTFO out $GME when it was trading at $212 Today it trading at $20
and about to waterfall again. Despite my several follow-up warnings over the last year and a half people
continue to fight me on this. SMH!

$TSLA to 300 End of Year.. #DIAMOND Been nothing but free Alpha 101 on my page this white boy summer. Diamond bottom clear as day on trend line...
TSLA to 300 EOY = Wizard has spoken
Keepin it simple. This is a LONG PLAY like CVNA , will update/comment on idea if I see any potential option plays (200C's after June OPEX will be a target of mine)
I think the whole world is over lookin geopolitical threats atm, but computer algo feels NO FEAR... FEAR IS THE MIND KILLER
Trump Presidency required, Elon steps down as CEO causing 1 day buy the dip opp, Elon joins US Gov't as Tech Advisor, Elon does what Bootyjuice never could, MAGA...
"THIS IS AMERICA!" - 300

SMCI Is About To Get Super Micro In PriceIt's hard to deny this powerful topping pattern in the making. usually, H&S are continuation patterns (contrary to popular belief) unless they are at a top. Which SMCI is.
So with that in mind, I will urge extreme caution for the bulls. It is better to be out of the market wishing you were in than in the market wishing you were out.

📉 Coinbase Grows 798% | Weekly Structure Break-DownRight now saying COIN or BTC is the same, if you want to know where the market is headed. Where Bitcoin goes, Coinbase follows.
Bitcoin is headed lower.
We are going to be looking at Coinbase (COIN) on the weekly timeframe.
First, we have the classic rounded top pattern, kind of like an inverted cup; we know this pattern to be a top signal.
➖ The week 11-March COIN produced a bearish close.
➖ The two weeks that followed, COIN wicked higher but closed below the 11-March session open, so remaining within this rounded top range.
➖ This week starts full red and works as bearish confirmation of the previous bearish candlestick based signals.
➖ This action is happening around the same level that rejected a recovery back in December 2021; this is strong resistance.
➖ The wave coming from early Jan through March has perfect proportions; This chart structure, price action, marketwide action and signals are pointing toward a correction.
👉 150 Should be an easy target for this correction, don't expect any less.
👉 It can go below 140 but we have to wait and see... The correction can go for many months... Say it only takes two months to hit bottom but it takes 6 months to move back up to current levels. The whole period would be 8 months and for someone bag holding, that would put you only at breakeven.
There can be one more leg up, one final jump, more growth and it keeps on going... But this is highly unlikely. There is always the possibility of the market going for more but this is a low probability scenario when we consider the action happening with the other charts.
Namaste.

Gamestop- Idiosynchratic Systemic RiskThe rise and fall of GameStop's stock in 2021 became a landmark event in financial history, captured in the recent film "Dumb Money." This saga, fueled by unprecedented social media buzz and retail investor sentiment, culminated in a historic short squeeze and raised critical questions about market access and regulatory oversight.
The Spark: A Sentiment-Driven Squeeze
GameStop, facing declining brick-and-mortar sales, became a target for short sellers who saw its business model as outdated. However, a surge of online optimism, primarily on platforms like Reddit and Twitter, ignited a buying frenzy among retail investors. This sentiment-driven buying pressure triggered a dramatic short squeeze, propelling the stock price to dizzying heights in January 2021.
The Fallout: Buy Buttons and Direct Registration
While the price eventually corrected, the social media fervor persisted. Concerns about trading restrictions implemented by certain brokers during the squeeze further fueled the fire. This led retail investors to embrace Direct Registration of Shares (DRS), a process that removes shares from the clutches of brokers and places them directly with the company. The goal: to limit the availability of shares for shorting and potentially trigger another squeeze.
DRS: A Unique Market Phenomenon
With over 74 million shares DRS'd as of the last earnings report, GameStop represents a unique case in market history. No other non-penny stock has witnessed such a large-scale withdrawal of shares from the open market by retail investors. This unprecedented scenario has created a volatile market dynamic with the potential for significant price movements.
Technical Analysis: Signs of a Potential Breakout
GameStop's price chart exhibits classic characteristics of a stock primed for a short squeeze breakout. Price consolidation since the 2021 squeeze, falling volume and volatility, and rising short interest are all potential indicators of pent-up pressure.
The Socioeconomic and Elliott Wave Perspective
Analyzing market movements through a socioeconomic and Elliott Wave lens, we recognize the crucial role of collective sentiment and mood in driving stock prices. GameStop's price trajectory aligns with a clear 5-wave Elliott Wave pattern, suggesting a potential return to all-time highs and beyond.
Potential for Government Intervention
The exponential counterparty risks associated with a potential GameStop squeeze raise concerns about systemic market instability. Government intervention, in some form, cannot be ruled out to mitigate the potential fallout of unrecoverable margin calls on significant market players.
The Sequel Awaits: A Story Unfolding
As time unfolds, the GameStop saga continues to evolve, captivating both financial experts and retail investors alike. Whether a sequel to the "Dumb Money" film materializes remains to be seen, but one thing is certain: the story of GameStop is far from over, with its potential consequences for the market attracting keen attention worldwide

APPLE Will Collapse! SELL!
My dear friends,
Please, find my technical outlook for APPLE below:
The price is coiling around a solid key level - 196.91
Bias - Bearish
Technical Indicators: Pivot Points Low anticipates a potential price reversal.
Super trend shows a clear sell, giving a perfect indicators' convergence.
Goal - 188.16
Safe Stop Loss - 201.94
About Used Indicators:
The pivot point itself is simply the average of the high, low and closing prices from the previous trading day.
———————————
WISH YOU ALL LUCK

Gamestop - BearishThe analysis is shared on my private channel but I do encourage to follow and see how my trades do.
I understand you are looking for confirmations on your journey. Keep an eye on it and see how I do.

NVIDIA - Correction after stock split?NASDAQ:NVDA has been one on the strongest stocks of the past decade with a rally of +25.000%.
Today, Nvidia had a stock split of 1:10, meaning that for every 1 share of Nvidia, you recieved another 9 shares (10 in total). Therefore, Nvidia stock price was simply divided by 10 ($1.200 / 10 = $120). Nvidia stock is currently retesting a major resistance trendline and is repeating another "cycle pattern" like we saw in 2015 and 2019. A correction is simply quite likely.
Levels to watch: $120, $50
Keep your long term vision,
Philip - BasicTrading

$BYRN Head and Shoulders - $7-$8 Price Target - PUT$!I don't "enjoy" shorting companies/ stocks, but this chart was too beautifully bearish to pass up. If this massive head and shoulders pattern plays out it'll be incredibly satisfying, and even more lucrative!
Personally, I'm holding a healthy number of: NASDAQ:BYRN 6/21 $10 puts

ANF retrace from ATH: eyes on $104 then 92 ideal retrace TargetANF has been on a relentless bull run.
It has obviously hit "a" top if not "the" top.
Mapped are key areas of interest for entries.
$ 111.65-112.64 is current support, should break.
$ 103.14-103.14 is the minimum expected retrace.
$ 91.53 - 92.54 is the 'Ideal" zone for long entries.
Key is to observe price action at each fib for clues.
=============================================

Taking long after pullback* RSI heavily overbought 4h tf
* VOLUME starting to cool off
* Pullback after impulse!

$SMCI on watch 1000C 7/19VERY SIMILAR setup to NASDAQ:AMD post...
Semi's looking bullish after nice consolidation on previous resistance line.
NASDAQ:SMH looks #JUICY too. Basically NASDAQ:SMCI and NASDAQ:AMD seem late to the party individually. Sector should provide support.
This is not high conviction so no wizard at end, just throwin a dog a bone...
- Probabilities R Us

INTC overview before earnings INTC has recently seen a decline within price from the highs of $40 - 50 levels. INTC has reached a level of stability around $30 and has successfully pulled up from these levels.
Due to earnings soon which comes with more volatility and (therefore more price action), there is a possibility to go higher though I am still conscious that these levels could be invalidated due to bad press/news etc.
If there is bad press, it is likely to drop around to the $20 - 26 levels though depends on the market's views.
INTC is currently trading at its 52 week low of around the $30 and we'll see if this level is sustained or invalidated.
Overall, I believe INTC has possibility to grow though upcoming news upon Intel to halt $25-billion Israel plant, and with the reports of their earnings and the market sentiment will overall decide this.
Currently in a trade long at 30.01. Still quite bullish about situation but could change if new news comes out, and will adjust position accordingly.

Is ADBE overvalued?I ran a DCF model using exponentially smoothed revenue forecasts to fit the future growth rate characteristics of a mature growth company like ADBE. My Cost of Equity was calculated with CAPM using Prof. Damodaran's cash yield ERP (6.01%) and my terminal value was calculated with 2047 price-to-sales of 20 for my bull case, 15 for my base case, and 10 for my bear case. My PTs are $436.24 for my bull case, $381.53 for my base case, and $326.82 for my bear case.

The limits of silicon have been reachedNASDAQ:AMD
The limits of silicon have been reached, and computing machines have hit their maximum potential for many decades. There have been no real achievements since 1984; that was the year when the ceiling was reached. The supposed development has ended. Ray tracing and all sorts of AI crap based on thrice-recycled garbage are no longer suitable for consumption.
Advancements in computing technology have stalled, and innovation seems to have plateaued. Despite the hype around new technologies like AI and ray tracing, these developments rely on rehashed concepts and fail to deliver groundbreaking results. The industry needs a fundamental shift to overcome these limitations and achieve true progress.

Massive Divergence Hints at GME Short SqueezeWe see a massive hidden bullish divergence in the Cumulative Volume Delta for GME.
This means that short sellers have tried to push the price down by all means, but were unable to break below the previous low.
The logical consequence of this situation is an expected short squeeze.
Experience shows that the more pronounced the divergence, the stronger the short squeeze.

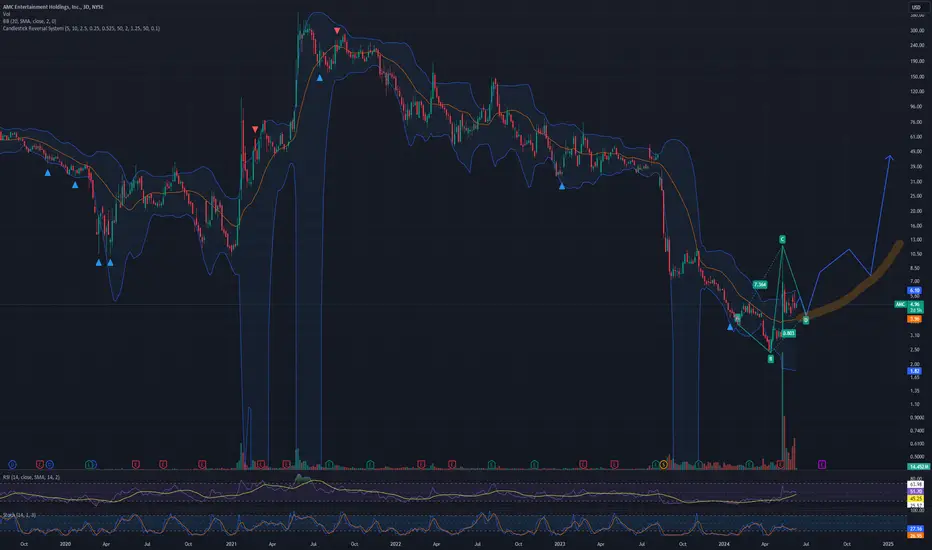
Th3Unkn0wn Follower's Request $AMC Thots (Thought$)@Th3Unkn0wn
Ask and you shall receive...
I really do think under 2 billion valuation is low. AMC streaming has to be in the works right? Its cheap, when hollywood changes their tune aka "woke n broke" AMC should have a resurgence of interest from movie lovers and if they incorporate streaming this is gonna be worth A LOT MORE...
No positions, just thoughts... if youre long this stock you want a BOTTOM TECHNICAL PATTERN, laid out is a nice inverse head and shoulder reversal IDEA...
"A path has been laid..."
- Prophecies
Possible Turning Point GMEWaiting on Indicator to flip long. Will probably be dependent on the FED tomorrow but willing to take a chance here. Stop Loss set at 19.75 NYSE:GME

(Shorting TSLA) - Quick Analysis and forecastMy price forecast from a few weeks ago is still holding and I'm now looking for a final confirmation of a yellow buying breakdown to enter puts here.
I don't know whether we want to fill the gap or not but will definitely be looking for signs and playing runners.
For bulls, once we prove red sell-side tapering and break out of teal - we are a GO!
Happy Trading :)

MARA: Second ChanceMy previous trade idea on MARA followed the accumulation of the lows below $10 when this stock was totally undervalued. I was buying to sell into the ETF news, which lined up perfectly with my BTC prediction approaching 48-50k. That trade resulted in a profit of 300% and our next opportunity is likely approaching as the Bitcoin Halving will occur in April.
Ive since sold my MARA position but I will start accumulating this stock again as price retraces.
There will be 2 BASIC indicators that I will use to predict where the bottom of this retracement will be.
1) The traditional Fibonacci retracement from the bottom of the range, to the top of the move. We will be using the Golden Pocket CC .618 as a base case and look for confluence at that level. To my expectation, this range lines up with a GAP that MARA failed to close, before rallying over 100%. My previous idea was based on the fact that GAPS must be filled once a direction is chosen. This will be no different.
2) The overall strength of the Market, in particular Bitcoin. I will be looking for a retracement on BTC to at least the $30k-$32k level, which was the previous massive range resistance, and should now be treated as support. If we break this level, we will very likely be looking at lower prices and this trade will be invalidated / look for lower prices.
I do believe that we will see a several week accumulation period in the spring, which may last in to the summer until BTC potentially begins its post halving rally in the fall / winter of 2024.
It will be important to watch the RSI on the daily time frame. If we break into new lower ranges, but the RSI fails to generate new lows, you can use this as a sign that the bottom is near.
My target will be between $12-$13.
If we do see further downside towards the previous range point of control at approx $9-$10, this would be a load the boat situation to average in.
Lets Go MARA!
Good Luck!

easy long play on Apple mid-termnice candlestick pattern, apple 1M chart forms a sequence of three distinct candlesticks within the broader context of an uptrend.
Perfect with the drop of AI play by Apple, serious and simply AI, not like other AIs play for the fomo and to the moon shit.

AAPL Shares Drop Following the Apple Intelligence PresentationAAPL Shares Drop Following the Apple Intelligence Presentation
Yesterday, 10 June, at the WWDC2024 conference, the American corporation Apple unveiled its new artificial intelligence system, Apple Intelligence (AI).
Apple Intelligence will allow users to enhance their text and communicate more effectively: rewriting, proofreading, and summarising text almost everywhere, including in mail, notes, pages, and third-party applications. The Rewrite function will enable changing the tone of messages, adding jokes, and rephrasing sentences.
Key features include:
→ AI's capability to understand the user's "personal context."
→ AI's ability to generate unique photos, sketches, and illustrations in Notes, Freeform, and Pages.
→ Apple confirmed its collaboration with OpenAI during the presentation.
However, on the same day, AAPL shares fell nearly 2%, with high trading volumes on the Nasdaq—over 97 million shares were traded, compared to an average volume of about 59 million.
Is this a sign that investors were disappointed with the presentation? Looking at AAPL’s stock chart today, it suggests that the decline might be due to the significant $195 level per AAPL share.
Technical analysis of AAPL’s chart shows that:
→ The price attempted to hold above $195 three times (end of July 2023, December 2023, end of January 2024) but failed. The proximity to the crucial psychological mark of $200 per share seems to be a factor.
→ The RSI indicator is near the overbought zone, motivating a price correction and profit-taking near key resistance (after a rally from A to B of almost 20% in less than two months)—this could have driven yesterday’s decline.
→ Yesterday’s candle formed a bearish engulfing pattern.
If the correction continues, AAPL’s price may fall within the ascending channel (shown in blue) to its lower boundary. A key support level might be around $180.40:
→ Approximately the 50% Fibonacci retracement level from the bullish impulse A to B.
→ The upper boundary of the bullish gap from early May.
Buy and sell stocks of the world's biggest publicly-listed companies with CFDs on FXOpen’s trading platform. Open your FXOpen account now or learn more about trading share CFDs with FXOpen.
This article represents the opinion of the Companies operating under the FXOpen brand only. It is not to be construed as an offer, solicitation, or recommendation with respect to products and services provided by the Companies operating under the FXOpen brand, nor is it to be considered financial advice.

MARA Potential Bounce Off Bullish Ascending Triangle MARA has tested the lower bounds of the ascending triangle before, so a bounce next week has potential. If one occurs a test of the upward bound of the triangle is likely, with a breakout also in speculation as the upward bound has been tested many times already. But, if a bounce occurs and then immediately retraces and breaks through the lower bound, I think MARA will continue on the downtrend.
