NATGAS - CHANGE OF CHARACTERHello Traders !
The NATGAS price failed to create a new lower low.
Currently, The last lower high (2.543 - 2.592) is broken (change of character)
So, I expect a bullish move📈
----------------
TARGET: 2.728🎯
NATURALGAS trade ideas

Are we thinking of Fundamental Analysis enough?Norway's gas exports to Europe fell sharply on Monday as a shutdown of the offshore Sleipner hub halted operations at the Nyhamna onshore processing plant, pipeline operator Gassco said, lifting European prices to their highest level this year.
The outage was caused by a crack discovered in a two-inch pipeline onboard Norway's offshore Sleipner Riser platform, the company said. It was not yet known how long this will take to repair, but the situation is not considered dangerous, it added.

Natural Gas SurfingZones and levels or shapes for potential support/resistance forces that might influence this market in the future. Dotted path is an envisioned scenario which doesn't need to manifest necessarily but the overall picture might come in handy if the market shows signs of synchronicity with the design.
Starting off with the resistance met at the cyan rectangle where I have 2 scenarios in mind: reversal, or consolidation and a break. I am more inclined to believe that bullish pressure could weaken here so I marked the spot with a down arrow.
Will provide updates as we go along, looking to see 4 or 5 interesting events at the elements in the snapshot, also looking to see some interesting hits on the icons, preferably with a wave that coincides with their path.

NATGAS - Time for a pullback? There is a high possibility we are going down on the GAS
Technicals
1. We closed on a doji on the weekly
2. We have been pumping strong lately, and the charts are screaming for a pullback
3. We came to a key .618 FIB retracement level
4. I see a zone here which can act as a major resistance.
Trade
Looking for a position for a sell this week!.
Great trading all of you
& remember to always trade with caution and a plan :-)
Greetingz,
Simba Trades

Natural Gas: Wild price action!Is natural gas a buy at these levels?
Nat gas is currently digesting its recent rally.
You have to expect the bulls to make another push higher at some point but with todays reversal the bulls may have to wait a bit longer.
Resource stocks took another hit today but still holding near the highs.
Nat gas is still holding above the daily 200 MA.
Price action is oscillating between the .236 Fib & .382 Fib

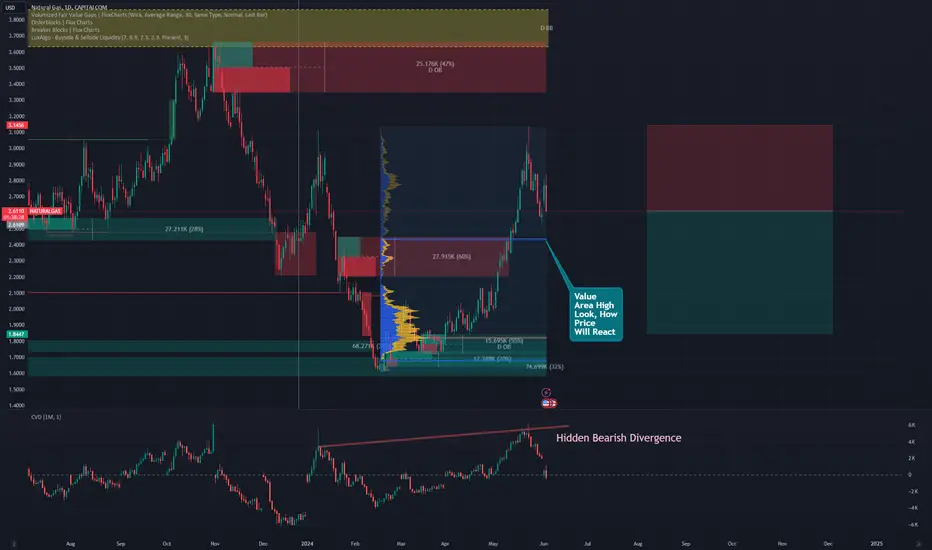
We are dropping - again!NATGAS has shown a remarkable recovery since February 2024. This recovery now appears to have come to an end—at least temporarily. From a technical chart perspective, the recent double top indicates a bleak situation, suggesting further declining prices. A bounce is possible at the high of the Value Area, which is the price range between the February 2024 low and the May 2024 high. Those trading NATGAS short should keep an eye on this price range. However, it is likely that prices will continue to fall towards the February lows.
NATURAL GAS - IMPORTANT BREAKOUT 📉Hello Traders !
The Natural Gas price failed to create a new higher high !
The higher low (2.543 - 2.570) is broken (change of character).
So, I predict a bearish move📉.
--------------
TARGET: 2.230🎯

Natgas - rebound phase - shortI want to be honest..
The rally long was a surprise for me, I expected a long phase but without this momentum.
It was really strange because we have a big storage increase more than last year and I expected a long phase but more flat.
so I think now we can have a rebound of price until support area more or less 2$ before the last long (if we will have).
The doubt if we have close or not the wave C ..
In any case I try a short position with small size and small risk.
Stop 2.8$
target 2$

Natural Gass CompassIn this one I use my preferred charting tool that uses data points from the past: Curved Trendlines. While there are other variations of such lines that I might use depending on the context, in this case the pattern low-high-high or high-low-low is widely detected as relevant and used as such for mapping out potential forces and support/resistance zones.
As you can see there is a relevant potential support zone validated by both the white curve and the blue curve which overlap further in time. There will be no surprises if the these levels keep holding the price for a while.
The yellow one is the weakest one in my opinion, because of the peculiar case on natural gas that doesn't provide much options for such support/resistance lines, because of the X high that was created in a strong but weird position relative to past highs and lows. Meaning that if the yellow is broken on the up, it might not even matter in the future because a different setup might unfold, creating a totally different type of line in any type of pattern regarding previous highs and lows.
What I like about these lines is that the relevant ones tend to provide clear cut cases of rebounds (example in the white dot), retests after break (green dot), or even pure power breaks with no comebacks (yellow dot).
The scenarios I find important in this picture are the following:
- the obvious potential rebound from the white and blue
- the less obvious but very important break on the downside of the white and blue which has a higher chance of a retest because of the significance of these lines (these retests tend to happen for these long lasting lines with many data points)
- supposing the yellow line does hold, or if another similar resistance line appears after another high lower than X, and supposing the white is finally penetrated, we enter the C zone which I believe has a decent probability for action inside it.
I find the B zone less likely to be relevant as it implies the breaking of the white which should lead to a more bearish or consolidation mood rather that another power bullish move.
I decided to post this snapshot here with these lines because as you can see the price has provided decent relevant lines in the recent past with the greens and blue, while in the current present case, these lines are almost non existent because of the position of the X high relative to the previous highs and lows.
My guess is that a careful analysis of the reaction of the market to these lines could give us clues of what the sentiment in the market is, shifting from the bullish mood to a more cautious neutral or indecision mood with the break of the white and blue.

XNGUSD Long (Buy Limit)Entry : 2.748
TP : 3.068 (320 pts)
SL : 2.668 (80 pts)
RR : 1 : 4
Expire : June 12nd, 2024 17:00 (UTC +7)
Warning : This analysis is not trading advice. Always do your own research and manage your financial risk.

U.S. NATURAL GAS (NGAS) UPTRENDING AGAIN?OWN OPINIONS. NOT FINANCIAL ADVICE
US NGAS has broken short term resistances. If the key longterm trendline is finally broken, it would be uptrending again. NGAS trends in cycles, which means it's mean reversing, so after touching key supports in the 1.60$ area, it's now reversing to the long term means.
Currently, it has broken the 200 day SMA, with a clean backtest and rebound. This price level also serves as a trigger for CTA buying.
As for Elliott waves, we would be starting the 5th wave with a price target of 3.28$/3.55$. That's where there's a confluence of prior relevant highs (breaking above would be very bullish), the 2STD from the YTD AVWAP, and the market maker's short/long flip pivot point

NaturalGas ABC correctionReject from first line of suport or from second line of support. If price go above and take this zone like support than we can see target like 3.3 or 3.6 in a few candels

NATGAS - NAUGHTY FALL AHEAD ?Cup pattern is complete with double top resistance. Looking for a handle now.
Probable retracement area would be $2.5
Once pattern is complete Natty might fly high to $4.5 again?
Disclaimer: Do not consider this as a buy or sell recommendation. This is purely for educational purposes


NATGAS DAILY DEMAND 2,334 and target the MoonI´m expecting a fall to the 2,334 area (if fundamentals allow the fall) and then up after rejection. Don´t buy exactly at the entry line, it is not a trigger. Wait for a rejection and enter to trade just if rejection is confirmed. TP your trade partially. Wish you good luck.

Natural Gas long ideaNatural Gas looking very interesting. Going to take a small long position.
THIS IS NOT FINANCIAL ADVICE

Natural Gas Money Heist Plan on Bearish SideMy Dear Robbers / Traders,
This is our master plan to Heist Natural Gas based on Thief Trading style Technical Analysis.. kindly please follow the plan I have mentioned in the chart. Our target is Green Zone that is High risk Dangerous level MA act as a Dynamic Support & Order Block, So the Market is oversold / Consolidation / Trend Reversal at the level Bullish Robbers / Traders gain the strength. Be safe and be careful and Be rich.
Note: If you've got a lot of money you can get out right away otherwise you can join with a swing trade robbers and continue the heist plan,
Loot and escape on the target 🎯 Swing Traders Plz Book the partial sum of money Use Trailing Stop To Protect Looted Money and wait for next breakout of dynamic level / Order Block, Once it is cleared we can continue our heist plan to next new target it will update after the Breakouts.
support our robbery plan we can easily make money & take money 💰💵 Join your hands with US. Loot Everything in this market everyday.

Natural Gas feeding the bears!Natural Gas has had a 15% down move since the high pivot reversal.
What's next? The daily 200 MA looks to be flattening out like a nice support level.
If we hold that area I'm looking for a continuation move higher.

Natural Gas Topping Signal?Natural Gas closed the week with a hard rejection.
A weekly topping tail has been observed this week.
A major reversal off the $3.11 pivot should be marked as major resistance.
Keep your eye on the daily 200 MA to see if this commodity to build a base above this bullish moving average.
Resource stocks lead Nat gas on the way up, look to them for leadership or potential weakness.

Natural Gas Positive economic indicators like the United States GDP Annual Growth Rate can be bullish for natural gas as demand grows with the economy. Conversely, high interest rates in the U.S. can be bearish as they may pressure consumption.
Traders often look at pivot points and support/resistance levels to make informed decisions.
It's important to note that natural gas trading is influenced by a wide range of factors, and prices can change rapidly. For those interested in trading or investing, staying updated with the latest forecasts, news, and technical analysis is crucial for making informed decisions. Always consider consulting with a financial advisor before making any investment decisions.


NATURAL GAS: Bullish- SHARK + WOLFE WAVENATURAL GAS: Bullish- SHARK + WOLFE WAVE
So, regarding gas the Wolf of Zurich detected a "Shark" and a "Wolf Wave" in Daily.
The market could rise violently.
There is a strong divergence on the ROC
Attention!!
The 50 and 200 exponential moving averages are potential targets
There
stay careful

Natural gas on the verge of maturityDear analysts and traders,
I trust this message finds you in good health and high spirits as you prepare to approach the upcoming week with renewed vigor. I extend my best wishes for continued success in all your business pursuits. It is essential to emphasize that sustained success in business hinges significantly on the consistent establishment and adherence to your principles.
As an advocate of the Elliott Wave principle, I regard this methodology as a valuable instrument for market analysis. Over the past three years, I have honed my approach by amalgamating this principle with a meticulous evaluation of diverse market scenarios. I strive to mitigate market uncertainties by upholding a broad spectrum of market perspectives, enabling me to discern market structures with utmost precision.
I am pleased to share my analysis with you, with the disclaimer that I do not offer buy or sell recommendations. My perspective on analytical ideas remains entirely impartial, and if my analysis aligns with your standards, it can serve as a compass for informed decision-making.
I have enclosed my prior analysis of the same market for your perusal and comparison. All aspects of my analysis are clearly delineated for clarity. Nevertheless, familiarity with the Elliott Wave principle theory facilitates comprehension of the analytical concept. I apologize for the repetitive nature of the text, as my week is occupied with formulating analytical and educational ideas, as well as engaging in trading activities and managing my social networks. Due to time constraints, I am unable to provide textual explanations for every idea, hence the inclusion of a separate text alongside the labeling. Should the text be unclear, I am available to elucidate the key points.
My rigorous study of the Elliott Wave Principle spanned nearly three years, during which my grasp and utilization of this invaluable tool evolved. My progress thus far stands as a tribute to the legacy of Ralph Nelson Elliott, whose brilliance underpins my accomplishments. May he rest in peace.
I am grateful for your unwavering support and benevolence, and I eagerly anticipate your feedback and constructive criticism.
May my analysis serve as a valuable asset in your business endeavors, and I remain yours sincerely,
Mr. Nobody
Previous analytical idea
