NYA trade ideas


The NYSE Wolfe waveThe WW formation seems to point towards a short term target of 10,335, which translates to a correction of -6.73%.

BROKEN ARROW in NYSE - Elliott Wave Bearish CountBroken Arrow - Ending Diagonal
New York Composite looks similar to the SP500.
Price action seems to had made the last wave up the 21th of may 2015 and thus done with the 5th of the 5 waves up since 2009 low.
Yesterday's price action stopped at the lower trend line for the ending diagonal.
We still need have confirmation - either by price action breaking the trendline or setting in a lower low on the daily timeframe.
NYSE has just like SP500 reached a fib-resistance area at 1.13
Fear not... believe what you see and trade it.
@BLawrenceM
Music at work:
www.youtube.com
open.spotify.com
Broken Arrow?
www.youtube.com
www.youtube.com
www.youtube.com

Market Shows no conviction - Waiting for FEDNo Conviction what so ever. Thanks to the internet for creating a hype and panic on FED announcements. Great example, that Technicals don't move the market.

NYSE Composite Index (Weekly). Setting up for brake_out.Broad based Index, setting up for a potential brake_out above 11100 level.
Within 2011 Channel.
Hitting resistance at 2014 horizontal resistance.
Triangle break_out and retesting in process.
Within BB. Above 50 sma.

NYA LongNYA is a great index for measuring the
market over the SP 500 because it comprises so
much more including over seas stocks or ADR's.
There is a inverted Head and Shoulders begining to
play out on the weekly. From the Alligator system
it is trading in the zone now showing buyers are
stronger and is a buy.

10457.89 an important line in the sand for NYSENYSE has made a series of higher lows since mid-October. It is also presently trading against 2 ascending trend lines shown here.
10457.89 is an important level to watch. If it is violated, NYSE will have broken the trend of higher highs and higher lows as well as both ascending trend lines.

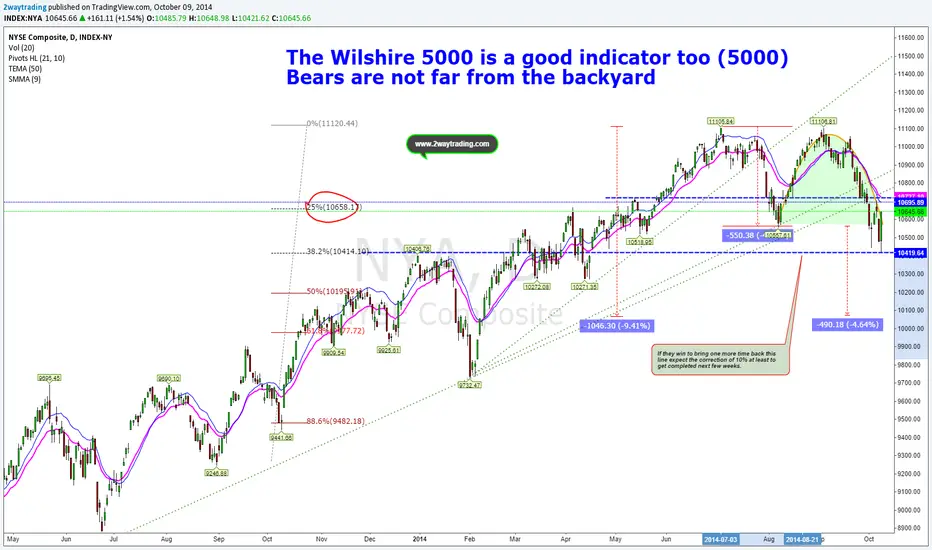
The Bears are not that far from the backyard!The volatility helps the fight to accelerate, and no winner so far, but still bears have stronger punches, the first good landing was yesterday, volume was not light any more as it did last rally up and seems today will be another follow through from yesterday. Stay safe, and make money. If you need to get real time alerts try www.2waytrading.com
$NYSE Composite Weekly. Measured move upside targets. $STUDYBased on measured move objectives there are a confluence of potential resistance areas to note just above where price currently resides. Above ~11280 with CONVICTION and ~12500 is the final target.

NYSE COMPOSITE INDEX POSSIBLE CORRECTIONIf you look at previous run up you can observe that it begins around 2003 with a no clear trend, but in the following years it tooks the shape of a rising wedge. The trendlines of this pattern expande, with both trendlines slanted in an upward direction. As the strength of the buyers weakens (exhibited by their inability to take the price higher), the sellers start to gain momentum. The pattern is complete, with the sellers taking control of the security, when the price falls below the supporting trendline. Normally this pattern resolves at the base of the rising wedge, and also in this case the solution is that. A new inversion phase happens at the base taking the shape of a reverse head and shoulders pattern. Now the story is repeating itself. We are in an upward move with a rising wedge. Again, the price movement is bounded by the two converging trendlines. As the price moves towards the apex of the pattern, momentum is weakening. A move below the lower support would be viewed by traders as a reversal in the upward trend. I think that we have still room for the uptrend for about 1 year, but at some point ( it could be the 1.61 fib extension) the pattern will begin his correction, pointing as usual at the base of the rising wedge. An uptrend can't last forever, so this is my general point of view standing at the analysis of similiar moves in this index. Good luck to all the investors.

La Belle Epoque Nya est peut d'etre finiSeveral patterns are in play in NYA composite
The last 6 month NYA has made several harmonic patterns as shown on the chart (See chart below). The latest is a 5-0 pattern and a ABCD in spe. That should bring a price target of 10120
Last week price created an island reversal
For the time being I see price action has made a possible harmonic ABC move (not EW) with a possible D move in the cards.
That will bring price action to a gap support area completing a harmonic ABCD.
With this move price action will define a possible neckline and a bounce area around 10440 for a right shoulder in a possible SHS.
How high will price bounce? It will depend of conviction. I have placed a fib to shown normal areas. If bounce will as high as left shoulder then price will make a 61.8 retrace....remember this is if and if... so hard to tell.
The SHS - should neckline break - has a target that approx correspond with the 5-0 pattern. around 10160 at a 61.8 retrace of February low and the top in May
As always... time will show!
Safe trading Ladies and Gents!
BM
MUSIC AT WORK:
open.spotify.com
www.youtube.com

Releif Rally Likely Capped Sub-Surface | $NYSE $NYA $TWTRFriends,
As just indicated in the analysis of Twitter (see it here, "All Targets Hit ... ": ), my predictive analysis and forecasting system defined a probable bullish target as:
TG-1 = 10624.04 - 17 APR 2014.
However, I also cautioned that a significant E.A.G.L.E range (10624.04/10584.23) is likely to impose its own resistance, up to a level that falls in line with the primary bullish target just defined.
Given the economic context and a Fed 's implied plan to continue its taper, all fundamental ingredients seem to be present to support a net bearish sentiment.
If indeed a decline was to occur, my predictive analysis would generate a (still speculative) target low as:
-TG-Lo = 9780.97 - 17 APR 2014.
OVERALL:
For the time being, a relief rally remains the primary focus, but given the fundamental context and analysis above, one should consider bond prices as reliable indicators of pan-market direction, especially the 3-month and the 10-year treasuries. Just saying.
Cheers,
David Alcindor
Predictive Analysis and Forecasting
Get my signals, analyses and forecasts on Twitter:
(Alias: @4xForecaster)
-------------------------------------
Disclaimer:
- All my comments are founded on unshared proprietary as well as common knowledge of technical analysis: Do your own due diligence before trading any market/asset. Additionally, my signals, forecasts, analyses and directional opinions are for educational purposes only and are not trading recommendations. Again, do your own due diligence first, then seek financial advice from a licensed professional, and only then enter the market at your own perils - David Alcindor - TradingView.com Alias: 4xForecaster

NYSE Composite Cycle, Elliot Wave, and Important LevelsWork in progress, but interesting no less. Love to hear your feedback and call-outs!
Cheers

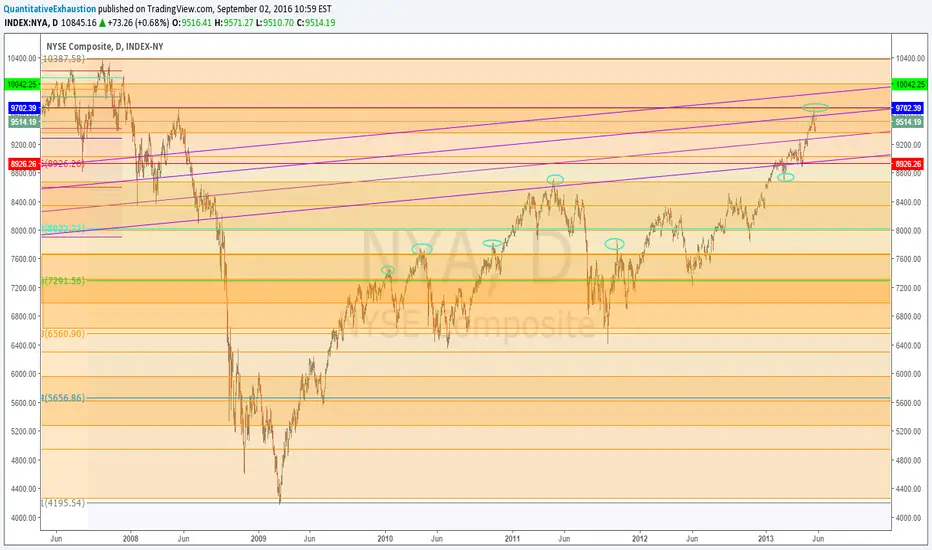
NYSE Composite Historical ChartWhen unsure where the market is headed it's always a good idea to look at the historical chart for clues.
I went through the charts and looked for support/resistance, both horizontal - ascending/descending with significant confluence. During the late stages of the tech bubble, bulls had a tough time passing the ascending resistance (shown in purple). I extended those lines, because they are once again present.
Cloned rectangles I present also hold significant horizontal support/resistance.
Right now I suspect a top, but others might disagree. I see the 9700 level in the NYA as a major threshold that will take some time to break. 9700 level held as milestone for both bears and bulls as the horizontal support/resistance area in 2007. In 2008, 9700 was the throwback top when oil prices reached all-time high, and later the NYA corrected.
NYSE Composite Showing No Signs of Weakness Taking a look at the NYSE Composite old Support/Resistance area at 9678. This particular horizontal trend line has a strong confluence reading. Now the market has cleared many barriers, NYSE could draw to 9678 area very quickly.
We also want to take a look at the NYSE new high and low areas. HIGN 500 readings are considered overbought and LOWN readings over 500 are considered oversold. When looking for historical data HIGN/LOWN comparison is essential.
MYHN and MYLN are the year-to-date high and low readings. If MYHN readings surpass 1000, NYSE is considered overbought. If MYLN readings surpass 1000, NYSE is considered overbought.
Important:
When MYLN-MYHN and HIGN-LOWN readings are both above average, you look for larger corrections within 90 days.
Compare chart to Hindenburg Omen
A technical indicator named after the famous crash of the German airship of the late 1930s. The Hindenburg omen was developed to predict the potential for a financial market crash. It is created by monitoring the number of securities that form new 52-week highs relative to the number of securities that form new 52-week lows - the number of securities must be abnormally large. This criteria is deemed to be met when both numbers are greater than 2.2% of the total number of issues that trade on the NYSE (for that specific day).
Traders use an abnormally high number of 52-week highs/lows because it suggests that market participants are starting to become unsure of the market's future direction and therefore could be due for a major correction. Proponents of this indicator argue that it has been very accurate in predicting sharp sell-offs in the past and that there are few indicators that can predict a market crash as accurately.
