EURUSD Bullish Boomerang Trend Continuation EntryEURUSD Bullish Boomerang Trend Continuation Entry looking for trend to continue
Forex market

Market Analysis: GBP/USD DipsMarket Analysis: GBP/USD Dips
GBP/USD is attempting a recovery wave from 1.2680.
Important Takeaways for GBP/USD Analysis Today
The British Pound started a fresh decline from the 1.2800 resistance zone.
There is a key bearish trend line forming with resistance near 1.2740 on the hourly chart of GBP/USD at FXOpen.
GBP/USD Technical Analysis
On the hourly chart of GBP/USD at FXOpen, the pair started a fresh decline from the 1.2800 zone after a decent increase, as mentioned in the previous analysis. The British Pound traded below the 1.2740 support to again move into a short-term bearish zone against the US Dollar.
The pair even traded below 1.2710 and the 50-hour simple moving average. Finally, the bulls appeared near the 1.2680 level. A low was formed near 1.2680 and the pair is now attempting a short-term recovery wave.
There was a fresh upside above the 1.2710 level. The pair climbed above the 23.6% Fib retracement level of the downward move from the 1.2800 swing high to the 1.2680 low.
Immediate resistance on the upside is near the 50% Fib retracement level of the downward move from the 1.2800 swing high to the 1.2680 low at 1.2740 and the 50-hour simple moving average. There is also a key bearish trend line forming with resistance near 1.2740.
The first major resistance on the GBP/USD chart is near the 1.2770 level. A close above the 1.2770 resistance might spark a decent increase. The next major resistance is near the 1.2800 level. Any more gains could lead the pair toward the 1.2880 resistance in the near term.
Initial support sits near 1.2710. The next major support sits at 1.2680, below which there is a risk of another sharp decline. In the stated case, the pair could drop toward 1.2620.
Trade over 50 forex markets 24 hours a day with FXOpen. Take advantage of low commissions, deep liquidity, and spreads from 0.0 pips. Open your FXOpen account now or learn more about trading forex with FXOpen.
This article represents the opinion of the Companies operating under the FXOpen brand only. It is not to be construed as an offer, solicitation, or recommendation with respect to products and services provided by the Companies operating under the FXOpen brand, nor is it to be considered financial advice.

@@@@@ AUDCAD UNIQUE IDEA $$$$$#AUDCAD
UPDATE
Hey team hope you all are enjoying our ideas and analysis now we are here to discuss about AUDCAD. AUDCAD almost breakout done. After this breakout we can see drop upto 100Pips+ soon ✍

Consider buying GBPUSD at the current price of 1.27227Consider buying GBPUSD at the current price of 1.27227. Set your take profit levels at 1.27800, 1.27950, and 1.28030 to capitalize on potential gains. In case the trade moves against you, be prepared to close it at the stop loss level of 1.27022.

USD/CHF Rate Falls Over 1% After SNB Chief's StatementsUSD/CHF Rate Falls Over 1% After SNB Chief's Statements
As evidenced by the USD/CHF chart, yesterday one US dollar was worth 0.913 Swiss francs, but today it is already 0.903, indicating a rate drop of approximately 1%.
According to MT Newswires, the franc's strengthening is attributed to statements by Swiss National Bank (SNB) President Thomas Jordan. In his view, an overly weak franc is the most likely source of higher inflation in Switzerland.
Notably, since the beginning of 2024, the Swiss franc has weakened against the US dollar by more than 7%, one of the worst performances among G10 currencies. The exchange rate has formed an ascending trend channel (indicated in blue).
Today's USD/CHF chart shows two important resistance lines:
→ The 0.913 level – the price could not consolidate above this level despite several attempts;
→ The median line of the channel.
On May 22, a downward reversal occurred from this resistance block (indicated by an arrow), and today the USD/CHF price is near the lower boundary of the channel.
Bullish arguments:
→ Near the lower boundary of the channel, demand may increase;
→ The psychological level of 0.9 CHF per 1 USD may provide support – this has occurred several times during the spring.
It is likely that the SNB does not want the upward trend to continue, and if so, in the near future, we might see a consolidation in the USD/CHF market within the range of 0.900 – 0.913, until significant fundamental news emerges to disrupt the balance that has been forming since April.
Trade over 50 forex markets 24 hours a day with FXOpen. Take advantage of low commissions, deep liquidity, and spreads from 0.0 pips. Open your FXOpen account now or learn more about trading forex with FXOpen.
This article represents the opinion of the Companies operating under the FXOpen brand only. It is not to be construed as an offer, solicitation, or recommendation with respect to products and services provided by the Companies operating under the FXOpen brand, nor is it to be considered financial advice.

AUDUSD There's still space for growthGo higher. The rationale behind :
1. Sentiment on open positions of retail traders
2. Data from the latest COT report on positions of major players
3. Cumulative metrics of technical indicators

signal alert to BUY EUR/CAD now at the current rate of 1.48209. signal alert to BUY EUR/CAD now at the current rate of 1.48209. This market analysis suggests a favorable opportunity to enter a long position on the EUR/CAD currency pair. The recommendation comes with a suggested TAKE PROFIT level at 1.48500, indicating a potential target for profit-taking. Additionally, a secondary TAKE PROFIT level is advised at 1.48600, offering an alternative exit point for maximizing gains. This analysis aims to provide timely and actionable insights for traders looking to capitalize on the fluctuations in the EUR/CAD exchange

GBPUSD: First green dayHi everyone and welcome to my channel, please don’t forget to support all my work subscribing and liking my post, and for any question leave me a comment, I will be more than happy to help you!
“Trade setups, not movements”
1. DAY OF THE WEEK (Failed Breakout, False Break, Range Expansion)
Monday DAY 1 Opening Range
Tuesday DAY 2 Initial Balance
Wednesday DAY 3 (reset DAY 1) Mid Point Week
Thursday DAY 2
Friday DAY 3 Closing Range ✅ No cycle confirmed
2. SIGNAL DAY
First Red Day
First Green Day ✅
3 Days Long Breakout
3 Days Short Breakout
Inside Day
3. WEEKLY TEMPLATE
Pump&Dump
Dump&Pump ✅
Frontside ✅
Backside
4. THESIS:
Long: primary, possibility to see this scenario of dump and pump to be completed by the end of the day, short traders are still in profit since Tuesday. I will be looking for a buy setup after the news release.
Short: secondary, yesterday, after the LOW breakout, the market proceeded pumping back up, I do not exclude a retest into the LOW if a sell high opportunity will be identified, however, it will be my secondary option.
Please note that the purpose of my analysis is to help me and you hunting the best trade setup for the day, none of my technical aspects are a way to forecast any directional market movement.
Gianni

CADCHF IS IN BULLISH TRENDCADCHF is in bullish trend because bullish divergence printing on 1H & 4H time frame buy at retracement of fib level 0.38 or 0.50 complete trade plane is mentioned in chart
EURNZD Continuing Bearish TrendEURNZD has a bearish bias and has retraced to the 0.618 to 0.75 zone on 15 minute TF. Anticipating to move towards the previous Lower Low.

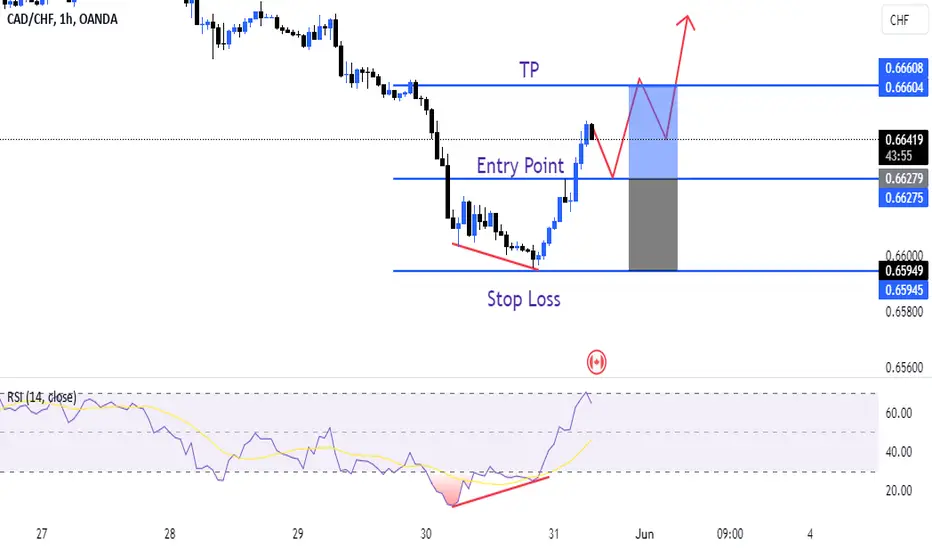
USDCHF - Divergence - Heikin Ashi - Long1. Market Analysis:
Asset: USDCHF
Timeframe: 1-hour
Pattern: Bullish divergence identified
Candle Type: Heikin Ashi
2. Entry Criteria:
Divergence Confirmation: Identify bullish divergence on the 1-hour timeframe using indicators like RSI or MACD. Bullish divergence occurs when the price forms lower lows, but the indicator forms higher lows.
Heikin Ashi Confirmation: Look for the formation of the first green Heikin Ashi candle after the bullish divergence is identified, indicating a potential reversal and trend change to the upside.
3. Trade Setup:
Entry Point: Place a buy order at the close of the first green Heikin Ashi candle that confirms the bullish reversal.
Stop-Loss: Set the stop-loss order below the low of the most recent swing low or below the low of the green Heikin Ashi candle that confirms the reversal. This helps limit potential losses if the price reverses.
Take-Profit: Determine your take-profit target based on a risk-reward ratio of either 1:1 or 1:2.

EURNZD LONGThis is just simple trading idea draw into chart using labels and lines. Please use it as educational purpose and you are free to modify any

A B( triangle) then c wave for 2?I like this setup on a low risk sale at 10920-50… see if it plays out.

AUDUSD : CHANNEL PLAY ???The pair has recently been trading inside a bullish channel. It recently tested the support border of this channel which confluence with the key support zone. From this level, the price moved up and now testing another key structural zone. If clear violation of this level, looking for local long positions.
Will this trend continue ??
Please do your own analysis before placing any trades.
Cheers and happy trading.


EURGBP EURGBP broke LH it can bigger reversal . AS it has divergence and trendline broke Seasonals are also bullish


USD/CHF ShortI prefer to short USD/CHF following an impulsive move to the downside. I'm aiming for a 1:2 RR, expecting the price to reach the area of interest and then break the previous low.

EURGBP - Long
Bullish divergence on 1H
Bullish divergence on 4H
Hidden Bullish divergence on 1D
Break of structure
Formed higher high

A head and shoulder setup after the 127% extension test.Intraday Update: The NZDJPY is developing a head and shoulder pattern with the neckline at 95.40.
It's a setup until the neckline breaks. Then bearish.

EUR USD PRICE - WEEK END BUY MODE ON EUR USD, here we can see that price balanced the liquidity at support zone, now price has to break the down trend line, after making retest, make a long entry to the marked price line as shown in the picture, follow for more live updates....nd boost my contents thank you...

EURCAD: Developing a major correctionEURCAD: Developing a major correction
EURCAD is moving inside a large corrective pattern and it is showing clearly that
we have a bullish and a bearish zone where the price
reacted very well in the past.
Considering also that the Eurozone Preliminary HICP inflation rose to 2.6% YoY in May vs. 2.5% expected, we can see EURO advancing more during the coming hours.
You may find more details in the chart!
Thank you and Good Luck!
❤️PS: Please support with a like or comment if you find this analysis useful for your trading day❤️

berish G/J that s my set up for gbp/jpy i wait for that entry confirmation up to you guys whitch one you pick G/j is in a down trend and i aspect a continuation let s see how it gonna play out
