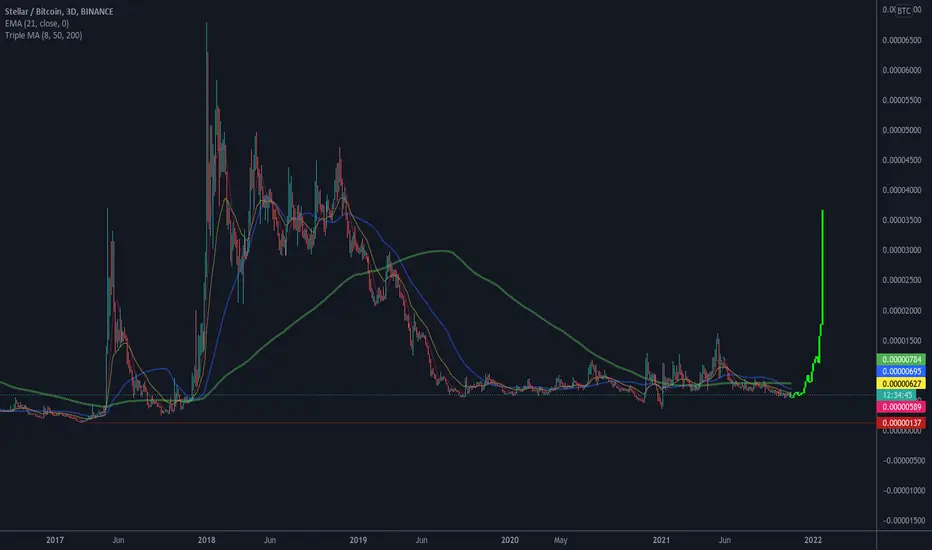
XLM/BTC has broken out. The 8 month correction is over.This is going to lead to a large rally in XLM/USD which could see the price hit old highs of $0.80.
I anticipate once it reaches this level, it will likely break higher. Third time is charm.
XLMBTC trade ideas

Xlm curve longBeen watching this coin for a long time it has been on a downtrend against btc for pretty much its whole existence however it could pick up some weight here against btc on this curve, id watch this one for the next week because in my opinion were going up huge.


Stellar Gets Closer To A Bullish Breakout!How long has it been since the last update?
2 days, 5 days, 1 week?
I really don't know because just 1 day feels like a entire week for me.
When I am at 3 or 4 days, it feels like I've been on it for months...
So, here is an update for Stellar (XLMBTC), it is now much more closer to grow.
I will mention one signal before we go, just to prove that it works.
See the MA200 black line curving down strong.
Inversely prices for XLMBTC will shoot up.
MA200 starts curving down...
The pairs candles start curving up.
Namaste.

Stellar About To Pick Up Speed...(125% Can Happen)I can tell you that XLMBTC (Stellar) is about to pick up some speed.
Today we have a "volume breakout"; the highest volume daily since May, and the day is not over yet.
High volume while moving above EMA50 is a very strong signal.
The MACD on the bullish zone and a strong RSI support this move.
We can see XLMBTC picking up speed.
The price of this Altcoin pair is set to increase.
Namaste.

Stellar (XLMBTC #4)This one is looking good now that its price is moving above EMA50.
XLMBTC has been batting this level, 0.00000609 and looks like it will finally close above it, growth can follow.
I will be looking at a lev. trade on this one.
Namaste.

XLMBTCThe price of Stellar compared to Bitcoin is at the price floor. It is possible to grow up to the trend line. If the trend line breaks, there is a possibility of growth until the next resistance.

XLMBTCstellar to bitcoin ratio is near the bottom line!
I think stellar in the next weeks can start a powerful bullish trend!

XLM is creating a flat bottomThis is a classic bottoming process in crypto. There is going to come a time when this coin is just going to start pumping. I wont be surprised if it makes few hundred % in a few weeks. There are quite a few alts that look the same way vs btc. Just dont use leverage because you will be shaken out.

XLMBTC NEAR BREAKOUTOnly when this pattern breaks to the upside will we truly see the real XLM run! Comment your thoughts!

so byllish ita crazyjust look at that btc pair accumulation..most bullish chart of the month ive seen easy.. buy it or be sad

XLMBTC Technical Analysis⏳ Spot
💎 XLMBTC is moving along the descending chancel. At the support zone we expect rejection. After the breakout we expect the price to go higher and reaches TPs. The Green candles show that the Bulls are pushing the price higher
🌐 Tradingview
🏁 Short & Medium Term
💵 Invest Only 5% of your Portfolio
🎳 Entry at Market or at 0.00000570
☕️ TP1 0.00000720
🍺 TP2 0.00000850
🍻 TP3 0.00001000
🍾 TP4 ___________
🍷 TP5 ___________
🍸 TP6 ___________
🍹 TP7 ___________
🎁 TP8 ___________
🚫 SL 0.00000535
Good Luck 🎲
Check the Links in Description and If you LIKE this analysis, Please support our page and Ideas by hitting the LIKE 👍 button. ❤️ Your Support is really appreciated! ❤️
Traders, if you have your own opinion about it, please write your own in the comment box. We will be glad for this.
Feel free to request any pair/instrument analysis or ask any questions in the comment section below.
We will have more FREE forecasts in TradingView soon
Have a Profitable Day

XLMBTC Keeping Support, Into Pump ?Currently our weeky is showing the beginning signs of a bullish divergence on macro timeframe. With Big support below our feet. After the breakdown we got back above it and are making support in it again, solidifing the trendline.
This is just my opinion no financial advise. Do your own due diligence.


seXLM sznXLMBTC has been building a huge base. Once it breaks 0.000013 I expect this to go into price discovery against USD.
Primary target is 0.000026

Stellar XLM Accumulation channelXLM has to break out of this channel on the monthly chart in order to surge to all time high.
Good time to buy at 600s sats per XLM.
Not financial advice.
Be careful and good luck!

xlmbtc
To consider ma 400
It may grow, then pump
sl : 0. ...600
tp 1 : 0. ...800
tp 2 : 0. ...950
tp 3 : 0. ..11
good luck

XLM range tradingThird time XLM/BTC is touching the bottom of this channel it is trading in since mid-june. It took a while after the first touch, namely a second touch, but after that we got a nice 25% move up. This seems an interesting opportunity.
I'm not counting the third as that wick is definitely false price action or maybe even a shake-out. Anyway, setting a stop loss below the previous low and my target at 20%. Let's see how this goes!

Stellar Lumen Best Time to Buy!The orange area has always been the best moment to buy this coin. The next months will be very good for the Stellar Lumens holders!!

xlm (stellar)buy point=0.00000604 at 25 sep
target 1=0.00000817
target 2=0.000011
taget 3=0.000016
sl=5%
good luck

XLMBTC Rdy To Bounce From Support ?Inverse H&S on the Daily timeframe which would result in an estiamted pump of arround 35% against BTC.
Current resistance at 865 Sats.
RSI in the 60's, With an ascending support line on the RSI.
MACD crossed Bullish.
First break until 1035 Sats with a retest of the 865 Sats to confirm the breakout from the H&S.
If succesfull we may search some higher values with resistance arround 1550 Sats ( From Broadening Wedge Look Chart )
On the weekly chart we still maintain the long term support line which we only broken /w the NoNo Virus at those times.
Do your own research this is not finacial advise.
GL HF Trading.
