MKR Weekly AnalysisMaker (MKR) has been the top loser of the week, with a correction of 13.11%. In April, MKR, a popular Layer 2 solution for Ethereum, experienced a sharp decline from $4,083 to $2,356. However, MKR quickly recovered and is now in an accumulation phase.
Currently, MKR is forming a bullish pennant on the daily chart, indicating potential upward momentum if the price breaks above the pennant's upper trendline. The critical demand zone lies between $2,660 and $2,468, and if this zone holds, an uptrend is likely.
Moving averages on the daily time frame suggest a strong sell signal, indicating short-term bearish momentum, while on the weekly time frame, they suggest a strong buy signal, indicating potential long-term bullish momentum. Oscillators on the daily chart also support a strong sell signal, while on the weekly chart, they remain neutral, indicating no clear dominance of either bulls or bears.
MKRUSDT.P trade ideas

#MKR/USDT breaks the Diagonal trend line in 4-Hour TF!#MKR/USDT breaks the Diagonal trend line in 4-Hour TF!
Wait for retest to open Long in $MKR. The local support level is $2870, and the resistance level is $4085.

MKR/USDT ascending trendline bullish horizon? 👀🚀MKR Analysis💎 Paradisers, get ready for a promising opportunity with #MKRUSDT as it consistently follows an ascending trendline, enhancing the likelihood of a bullish trend continuation.
💎 Previously, we observed a shift where supply turned into demand, and the price demonstrated a strong bullish movement, forming a double top before dropping and respecting the ascending trendline as support. Currently, the price has revisited this trendline, and if it can maintain its momentum at this level, there's a high probability that #MAKER will continue its bullish trajectory along the trendline.
💎 It’s important to note that if the price fails to sustain its momentum along the ascending trendline, this could indicate a weakening of the bullish trend. In such a scenario, we are prepared to take advantage of a bullish rebound from the lower demand level at $2320. The significant liquidity at this level suggests that ASX:MKR could experience a robust bullish recovery. However, a break below this demand level could result in a substantial decrease in price.
MyCryptoParadise
iFeel the success🌴

MKRUSDTmy entry on this trade idea is taken from a point of interest BELOW an inducement.. I extended my stoploss area to cover for the whole swing as price can target the liquidity there before going as i anticipate.. just a trade idea, not financial advise

MKRUSDT-Channel FormationSummarized Detailed Analysis of #MKRUSDT
Time Frame: 12 Hours (12H)
Overview
MKR/USDT is currently trading within a descending channel pattern, indicating a period of consolidation within a defined downtrend. A breakout from this pattern is imminent, and in the event of a successful breakout, a bullish move of approximately 20% is anticipated.
Key Elements
Descending Channel Pattern:
This pattern consists of two parallel trendlines, with the upper trendline acting as resistance and the lower trendline acting as support.
The descending channel signifies a controlled decline where each lower high and lower low follow a parallel trajectory.
Pattern Breakout Potential:
A breakout above the upper trendline of the descending channel would signify a reversal of the current downtrend, suggesting the beginning of a new upward trend.
The breakout is considered significant if accompanied by increased trading volume, reflecting strong market participation and investor confidence.
Market Sentiment and Fundamentals:
The broader cryptocurrency market sentiment can influence MKR's price movement. Positive trends in the overall market often enhance bullish prospects for individual tokens.
Fundamental factors specific to Maker (MKR), such as technological advancements, increased adoption, new partnerships, or favorable regulatory developments, can act as catalysts for price increases.
Risk Management
Stop-Loss Orders:
Place stop-loss orders below the lower trendline of the descending channel to manage potential downside risks.
A recommended stop-loss level might be 5-10% below the current trading price to account for market volatility and avoid premature exits.
Position Sizing:
Ensure position sizing is consistent with overall risk management strategy. Avoid over-leveraging to maintain manageable exposure levels.
Proper position sizing mitigates the impact of potential losses and maintains portfolio balance.
Take-Profit Levels:
Set take-profit orders at intervals reflecting the anticipated 20% price increase.
Consider incremental profit-taking to secure gains and reduce the impact of potential market reversals.
Conclusion
MKR/USDT is on the cusp of a potential breakout from a descending channel pattern within the 12-hour timeframe. If the breakout occurs, a bullish move of approximately 20% is expected. This outlook is based on the pattern's characteristics and potential market sentiment shifts. However, effective risk management strategies are crucial to safeguard investments against volatility.
Note: Cryptocurrency trading involves significant risks. Conduct thorough research and consider consulting with a financial advisor before making any trading decisions.

MKRUSDTmy entry on this trade idea is taken from a point of interest ABOVE an inducement.. I extended my stoploss area to cover for the whole swing as price can target the liquidity there before going as i anticipate.. just a trade idea, not financial advise

MKR/USDT Keep an eye on the demand area, potential reversal!💎 Paradisers, #MKR is indeed a coin worth monitoring closely.
💎 Currently, there's a potential for the price to retest the demand area around 2530 - 2400. Historical data suggests that MKR tends to bounce consistently when reaching this demand area.
💎 If this pattern repeats, MKR may test the resistance trendline after bouncing from the demand zone.
💎 Breaking above the resistance trendline is essential for MKR to sustain its upward movement and potentially reach higher levels or our target strong resistance area. However, if MKR fails to break above the trendline, it could face rejection and retreat back towards the demand area.
💎 Should MKR fail to bounce from the demand area, there's a possibility of a wick forming when testing the support zone, which was not touched after the re-accumulation phase. This could signal a rapid return to an upward trajectory.
💎 The bullish invalidation scenario would occur if MKR breaks below the support level at 2267, confirmed by a daily candle close below this level. Such a move could indicate a shift towards bearish sentiment and potential further price declines.
MyCryptoParadise
iFeel the success🌴

Short MKR for 2%A nice push to the left. not much noticable momentum. Price action is breaking down... down trend.
SL previous small tf high..

MKR D and 4H Consolidation underway.H oversold bounce for a D HLMKR D and 4H Consolidation underway.H oversold bounce for a D HL
Playing the H OS bounce for MKR in hourly Oversold art prior
Value area backtest.
Nice confluence for a frontside aggressive trade.
4h stairstep pattern.
you can play oversold bounces in many ways.
Laddering on the frontside into an area is one way.
Choose your risk based on the USD amount of loss. Or with sizing

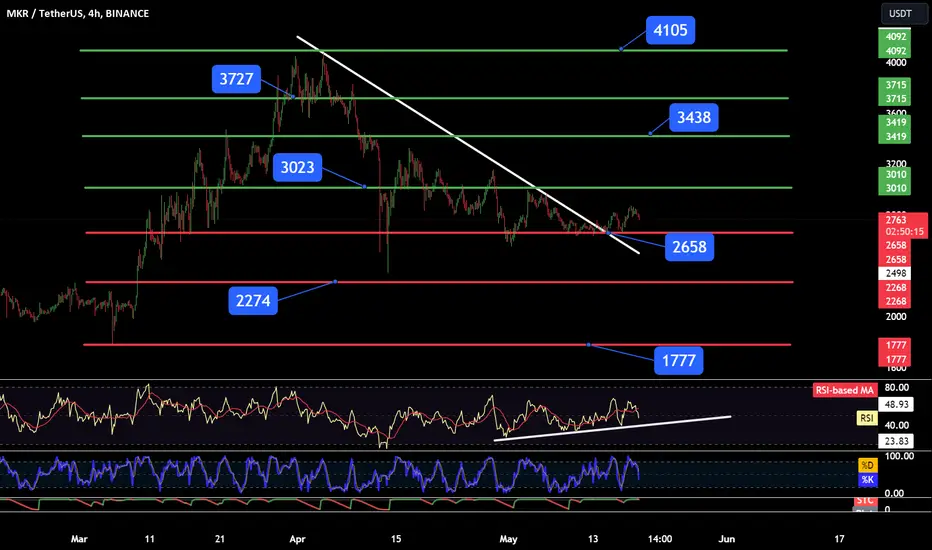
BNB/USDT 4HInterval Chart ReviewHello everyone, let's take a look at the MKR to USDT chart on a 4-hour time frame. As you can see, the price broke sideways from the downward trend line.
Let's start by determining the support line and as you can see, the first support in the near future is $2,658, if the support is broken, the next support is $2,274 and $1,777.
Now let's move on to the resistance line, as you can see the first resistance is at $3,023, if you manage to break it, the next resistance will be at $3,438, then at $3,727 and then at $4,105.
Looking at the RSI indicator, you can see that we are approaching support, which may result in another attempt to rebound the price, and the STOCH indicator shows that there is still some room left to go down before it increases again.
MKRUSDTmy entry on this trade idea is taken from a point of interest BELOW an inducement.. I extended my stoploss area to cover for the whole swing as price can target the liquidity there before going as i anticipate.. just a trade idea, not financial advise

MKRUSDTmy entry on this trade idea is taken from a point of interest BELW an inducement.. I extended my stoploss area to cover for the whole swing as price can target the liquidity there before going as i anticipate.. just a trade idea, not financial advise

MKR/USDT Ready for an Explosive Bull Run? Positive Signs🚀👀💎Paradisers, #MKR is currently building momentum and gearing up to retest the descending resistance.
💎Once it breaks out, we'll wait for a retest to confirm our trading plan. The retest phase usually follows a breakout, offering an excellent opportunity to confirm bullish momentum. If #Maker holds support at $2701 and continues its upward climb, our projected resistance zone will be the next target.
💎However, if #MKRUSDT struggles to maintain support and falls back into the channel, it could hint at a weakening bullish trend. In this case, the price may drop further to the next significant support level around $2363.
💎Historically, ASX:MKR has shown resilience by bouncing decisively from this level. If this pattern holds, we could see a strong bounce. But if a decisive candle closes below this support, it will challenge the bullish outlook, signaling a potential shift toward a more bearish trend.
MyCryptoParadise
iFeel the success

Alikze »» MKR | Retest the bottom of the ascending channelIn the daily time, it is moving in an upward channel, which faced selling pressure after reacting to the supply zone and not being able to break the zone.
💎 Currently, according to the momentum and downward guard, after an attempt to the midline of the channel, it is continuing to correct to the bottom of the channel.
💎 According to the trading node and the previous major ceiling, this correction can continue until the green box area.
💎 Therefore, it is expected that after one attempt to the area, the correction will continue until the green box area.
💎 In addition, if it has the ability to break the supply area of the red box, it can retest the previous ceiling.
»»»«««»»»«««»»»«««
Please support this idea with a LIKE and COMMENT if you find it useful and Click "Follow" on our profile if you'd like these trade ideas delivered straight to your email in the future.
Thanks for your continued support.
Sincerely.❤️
»»»«««»»»«««»»»«««

MKR FORMING ADAM AND EVE PATTERNBINANCE:MKRUSDT forming an Adam and Eve or a double bottom, indicating a bullish pattern. Currently approaching on the neckline more details on the idea threads below. Stay tuned for updates.

Expansion exposure -- Recap of MKRWe analyzed the fundamentals and technical aspects of Maker DAO in early April. Let's take a look at the changes after a month.
Fundamentally, as the head protocol of RWA, MakerDAO is famous for its security. But after ONDO established cooperation with BlackRock fund BUIDL. MakerDAO chose to expand its $600 million DAI exposure to Ethena’s USDe and sUSDe. This may be due to the continued strength of ONDO. However, it is dangerous for an over-collateralized stablecoin to open up exposure to a centralized stablecoin (USDe is based on the funding rate arbitrage model to generate high returns and high risks. We will explain it in a subsequent analysis if we have the opportunity). After its implementation, multiple DeFi protocols that adopted DAI, such as AAVE, began to consider reducing the share of DAI to avoid risks.
We represent ENA (Ethena’s token) with a yellow line in the figure. MakerDAO said on April 9 that it was expanding its exposure. The impact of this aggressive move on the price was obvious. After that, MKR continued to pull back and the bulls weakened.
On the TSB indicator we can see that although the bar bounced back after touching the wavy zone multiple times, the bulls were encouraged. However, the TSB indicator prompted a SELL signal today, which shows that at the daily level, MKR's bullish trend is temporarily over. If you are long MKR based on the TSB indicator, you can first consider taking profits.
Introduction to indicators:
Trend Sentinel Barrier (TSB) is a trend indicator, using AI algorithm to calculate the cumulative trading volume of bulls and bears, identify trend direction and opportunities, and calculate short-term average cost in combination with changes of turnover ratio in multi-period trends, so as to grasp the profit from the trend more effectively without being cheated.
KDMM (KD Momentum Matrix) is not only a momentum indicator, but also a short-term indicator. It divides the movement of the candle into long and short term trends, as well as bullish and bearish momentum. It identifies the points where the bullish and bearish momentum increases and weakens, and effectively capture profits.
Disclaimer: Nothing in the script constitutes investment advice. The script objectively expounded the market situation and should not be construed as an offer to sell or an invitation to buy any cryptocurrencies.
Any decisions made based on the information contained in the script are your sole responsibility. Any investments made or to be made shall be with your independent analyses based on your financial situation and objectives.

📈💪 MKR Trade Opportunity! 💪📈📊 Analysis:
Relative Strength: Maker (MKR) is exhibiting relative strength compared to BTC amidst market weakness.
Reversal Signs: MKR has absorbed liquidity at $2,365 and is showing potential signs of a reversal.
Entry: Consider entering the trade at $3,150.
Profit Targets: Aim for profits at $3,650 or $4,000 levels.
Risk Management: Set a stop-loss at $2,850 to manage potential downside risks.
📈 Trading Strategy:
Entry: Initiate a long position at the specified entry price.
Targets: Take profits at identified resistance levels.
Risk Control: Implement the specified stop-loss to mitigate losses in case of adverse price movements.
🚨 Note: Monitor market conditions closely and adjust the strategy accordingly as the trade progresses! 📊🔍 #MKR #TradingOpportunity #CryptoAnalysis 🌟📈

MKR is at the key resistance zoneMKR is at the key resistance zone, I expect the market to go down
🔵Entry Zone 3258 - 3186
🔴SL 3529
🟢TP1 2942
🟢TP2 2676
Risk Warning
Trading Forex, CFDs, Crypto, Futures, and Stocks involve a risk of loss. Please consider carefully if such trading is appropriate for you. Past performance is not indicative of future results.
If you liked our ideas, please support us with your likes 👍 and comments.

MKR Long Targets doneThe doubters are completely sidelined today🔥🚀
Our Magnet 🧲 has done it's work
ASX:MKR has smashed it's first and grand target done within few hours🎯💵
12% beautiful and unleverage move captured🚀
Follow For Perfection✅
Follow For Money💵

$MKR Looking great in bearish marketA good reaction on the trendline and being on Fibo 61 are good signs of growth
But be careful!
The market trend is not very stable
Be satisfied with low profits

MKR Bounced Back from SupportMKR has beautifully bounced back from the key support area, Now it has potential to run back to it's resistance before falling again down.
I'm in Long From:
ASX:MKR
Entry: 2800 - 2850
Tp: 3250 - 3350 - 3450
Sl: 2300
It can take some days to fully playout.
#nfa #dyor #aqeelonline

MKR | MAKER made itIn an impressive display of bullish momentum, Maker has witnessed a substantial gain attracting much of the market attention.the price of Maker aka MKR is 1,027 today with a 24hour trading volume of 100 million dollar. This represents a 11% price increase in the last 24 hours and a 50% price increase in the past 7 days.
Maker manged to break its downtrend at 800$ (red line) and now bulls are in control
most indicators are bullish and its 30% up since our first mkr analysis
next targets are 1030, 1040 and 1050

MKRUSDT: Long SetupIn these altcoins, I see that buyer interest remains quite strong. There is potential for prices to break through the double top.
