


Big Tech Lines Up for Earnings Season: What Traders Should KnowPeak earnings season is right around the corner — the next two weeks are for the geeks with tech giants slated to report their quarterly financials all the while traders and investors weigh concerns over tariffs, trade wars, and export controls.
On tap to offload first-quarter earnings updates thi

/
The best trades require research, then commitment.
$0 forever, no credit card needed
Where the world does markets
Join 100 million traders and investors taking the future into their own hands.

Netflix Pops as Earnings Top Estimates. Are Tariffs a Threat?Netflix NASDAQ:NFLX dropped its first-quarter earnings Thursday after market close and the headlines practically wrote themselves: a record net income, an earnings beat, and a 3% implied jump for the stock at the opening bell. All in a market where the Nasdaq is crying in the corner.
But as alwa

Gold - 7000 USD by 2027 (must see, sell here!)Gold is extremely bullish, but nothing lasts forever. To trade gold profitably, you need to always trade with a trend. Clearly the trend is bullish, so we want to open only long positions and avoid short positions to increase the probability of success, and it doesn't matter if you are an intraday o

S&P 500 - Key Levels and April 7-11 Weekly Candle StructureApril 7-11 will easily be remembered in 2025 as one of the craziest weeks in modern history.
Intraday swings were face ripping all from a Monday "fake news" becoming Wednesday "real news" with the US pausing tariffs for 90 days
5500 major resistance on S&P
4800 major support on S&P
I believe the

XAUUSD is in buy zone!After a short break on daily timeframe XAUUSD managed to breakout in the major direction of the trend with strong momentum with multiple liquidity grab from the support level. 5min shows a break of structure and drop to 3254.00 followed by strong rejection to the upside showing a high probability of

GOLD Trending Higher - Can buyers push toward 3,300$?OANDA:XAUUSD is trading within a well-defined ascending channel, with price action consistently respecting both the upper and lower boundaries. The recent bullish momentum indicates that buyers are in control, suggesting a potential continuation.
The price has recently broken above a key resistanc

How low Can the Dollar Go? And What It Could Mean for EUR/USDThe US dollar index has handed back all of its Q4 gains with traders betting that Trump's trade war will do more damage than good to the US economy. I update my levels on the US dollar index and EUR/USD charts then wrap up market exposure to USD index futures.

Crypto update 2025.04.14The current market moves due to tariffs are pushing away the interest from cryptos, as those are stuck somewhere between potentially being a safe-haven and still classed as a risky asset.
Let's dig in.
CRYPTO:BTCUSD
CRYPTO:BCHUSD
CRYPTO:ETHUSD
CRYPTO:LTCUSD
Let us know what you th

Tokenized AI-Agent. History and evolutionTokenized AI agents: a new foundation or a pretty wrapper?
If you spend at least some time on crypto Twitter or went to one of the fall crypto conferences, or even more so if you trade on on-chain, you can't have failed to hear about AI agents and the tokens around them. You're probably wondering wh

Ethereum Hits Critical Resistance — Is a Drop to $1400 Next?Introduction
Ethereum has been in a sustained downtrend over the past weeks, struggling to gain any real bullish traction. After a sharp decline last Sunday, the market remains under pressure, and although we’ve seen short-term attempts to recover, the broader trend still points downward. Technical

See all editors' picks ideas
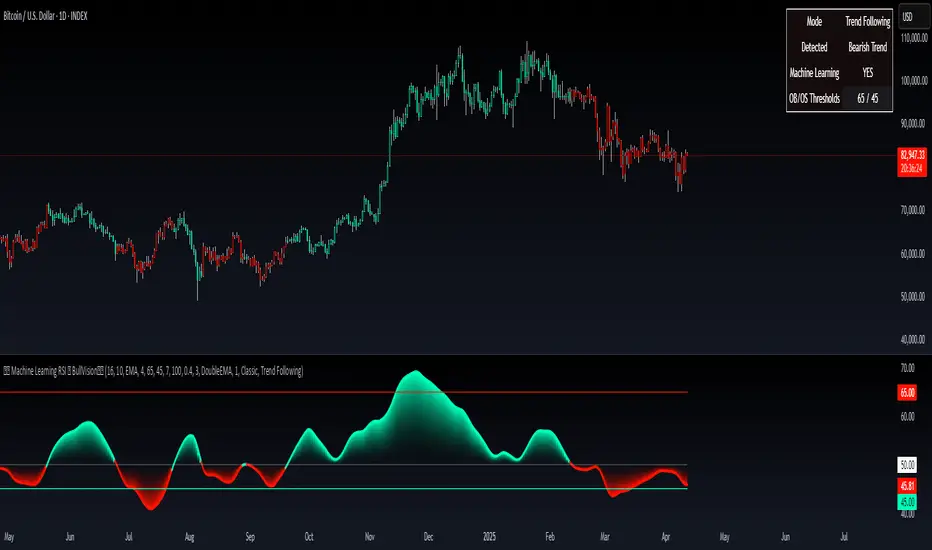
Machine Learning RSI ║ BullVisionOverview:
Introducing the Machine Learning RSI with KNN Adaptation – a cutting-edge momentum indicator that blends the classic Relative Strength Index (RSI) with machine learning principles. By leveraging K-Nearest Neighbors (KNN), this indicator aims at identifying historical patterns that resembl
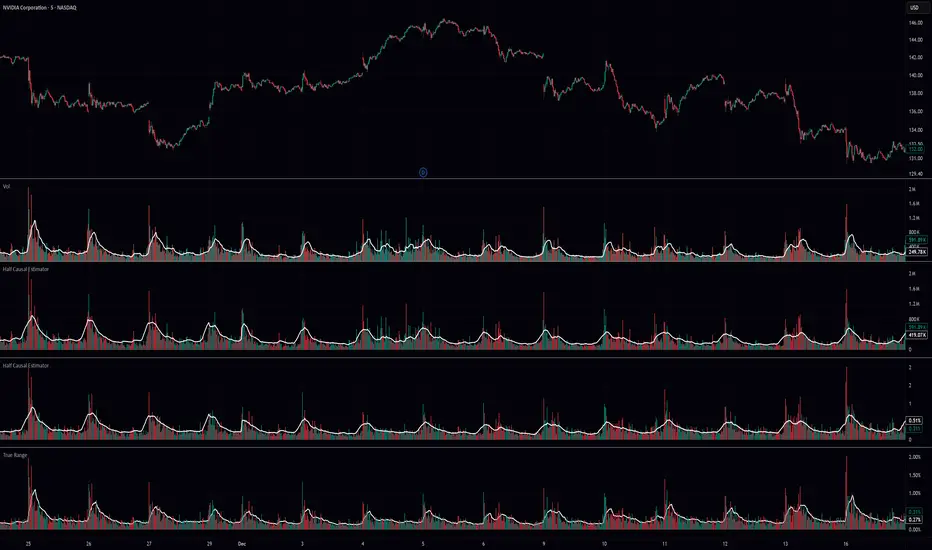
Half Causal EstimatorOverview
The Half Causal Estimator is a specialized filtering method that provides responsive averages of market variables (volume, true range, or price change) with significantly reduced time delay compared to traditional moving averages. It employs a hybrid approach that leverages both historica
BIN Based Support and Resistance [SS]This indicator presents a version of an alternative way to determine support and resistance, using a method called "Bins".
Bins provide for a flexible and interesting way to determine support and resistance levels.
First off, let's discuss BINS:
Bins are ranges or containers into which your

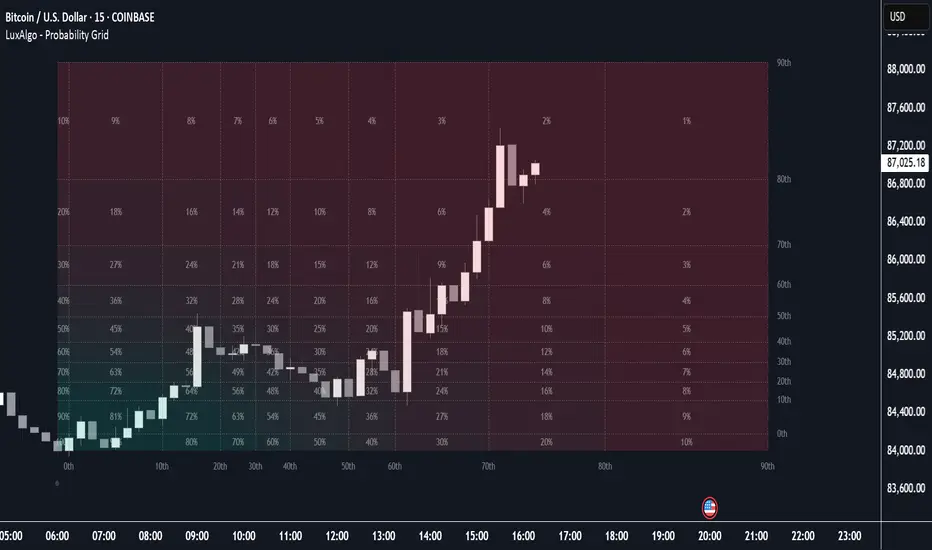
Probability Grid [LuxAlgo]The Probability Grid tool allows traders to see the probability of where and when the next reversal would occur, it displays a 10x10 grid and/or dashboard with the probability of the next reversal occurring beyond each cell or within each cell.
🔶 USAGE
By default, the tool displays deciles
Correlation Heatmap█ OVERVIEW
This indicator creates a correlation matrix for a user-specified list of symbols based on their time-aligned weekly or monthly price returns. It calculates the Pearson correlation coefficient for each possible symbol pair, and it displays the results in a symmetric table with heatmap

Tetris with Auto-PlayThis indicator is implemented in Pine Script™ v6 and serves as a demonstration of TradingView's capabilities. The core concept is to simulate a classic Tetris game by creating a grid-based environment and managing game state entirely within Pine Script.
Key Technical Aspects:
Grid Representation:

Log Regression Oscillator Channel [BigBeluga]
This unique overlay tool blends logarithmic trend analysis with dynamic oscillator behavior. It projects RSI, MFI, or Stochastic lines directly into a log regression channel on the price chart — offering an intuitive way to detect overbought/oversold momentum within the broader price structure.

Multitimeframe Fair Value Gap – FVG (Zeiierman)█ Overview
The Multitimeframe Fair Value Gap – FVG (Zeiierman) indicator provides a dynamic and customizable visualization of institutional imbalances (Fair Value Gaps) across multiple timeframes. Built for traders who seek to analyze price inefficiencies, this tool helps highlight potential ent

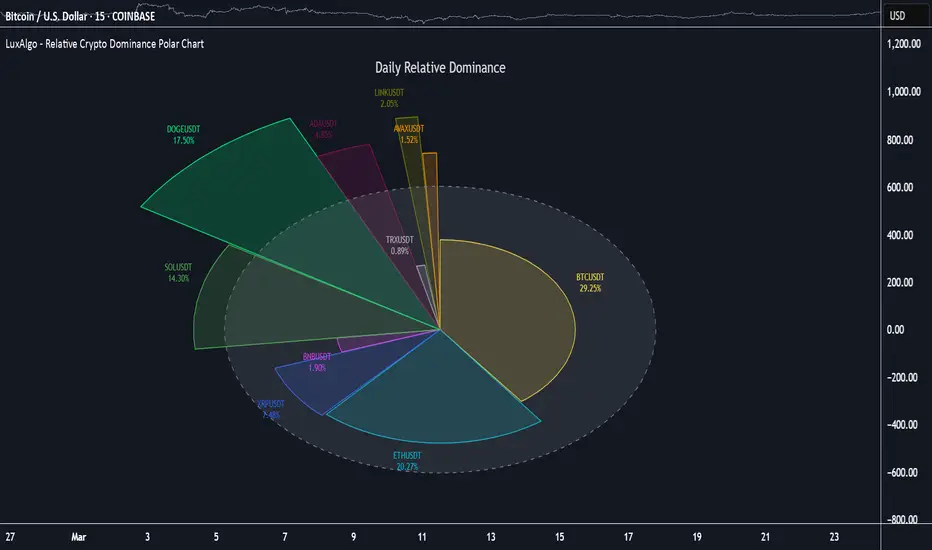
Relative Crypto Dominance Polar Chart [LuxAlgo]The Relative Crypto Dominance Polar Chart tool allows traders to compare the relative dominance of up to ten different tickers in the form of a polar area chart, we define relative dominance as a combination between traded dollar volume and volatility, making it very easy to compare them at a glan
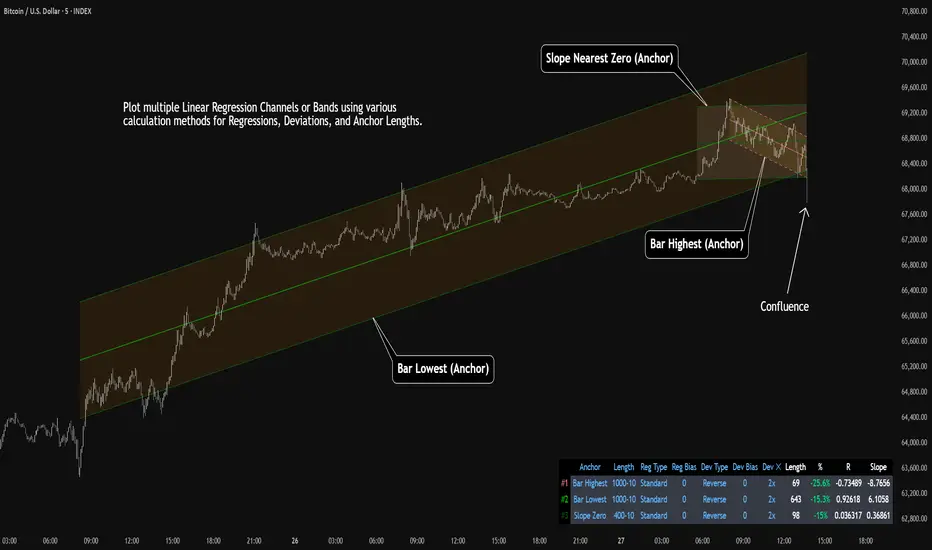
Multi-Anchored Linear Regression Channels [TANHEF]█ Overview:
The 'Multi-Anchored Linear Regression Channels ' plots multiple dynamic regression channels (or bands) with unique selectable calculation types for both regression and deviation. It leverages a variety of techniques, customizable anchor sources to determine regression lengths, and
See all indicators and strategies
Community trends
TSLA Drill Team is Back
Against the background of everything that is happening, from a fundamental point of view, Tesla is facing significant headwinds as we approach its Q1 2025 earnings.
A 13% year-over-year decline in deliveries, ongoing margin pressures from price cuts, and negative consumer sentiment tied to Elon Mu

Palantir Added 40%+ Since April 7. What Does Its Chart Say?Counter-terrorism-software giant Palantir Technologies NASDAQ:PLTR rose more than 500% between April 2024 and its February 2025 peak, sank some 47% from there to its April low, then rebounded 47% intraday between April 7 and April 16. What does technical and fundamental analysis say could happen n

When NOT to Trade – CTMI Strategy Warning in ActionNot every stock is worth your time.
CTMI Strategy doesn’t just show you when to buy —
It shows you when to walk away.
Low signal confidence. Weak trend. Elevated risk.
One glance at the panel, and you know.
Comment “CTMI Access” to get 7 days free and see how it helps you stay out of troub

$TWIN REFLECTIONIt is expected that this stock will move up as it is fundamentally below its fair value.

KULR - How we identified an obvious bearish liquidity buildThis is textbook. As will be the long entry once we arrive at the HTF orange selling which (if looked at on a daily chart) will prove tapered selling (a bullish liquidity build). That algorithm also lines up beautifully with a HTF demand zone in which we will begin building our position at around th

T Trading Guide 4/21/25AT&T (T) Trading Analysis for Monday, April 21, 2025
Sentiment Analysis
-Overview: Sentiment on X and StockTwits is neutral, with investors appreciating T’s 4.11% dividend yield but expressing concerns over tariff-driven cost increases. Analyst consensus remains stable, with a “Hold” rating and a

Looking for a 10% move down now that it has slowed downAfter a previously good description, which moved dramatically in our favor, it is now showing signs of moving fewer points below to reestablish itself.

AAPL Break Test Go!!!I am a macro trader, meaning my trades last a long time.
Up to years unless something changes in the process. As such, I am forced to repost this chart. Here is my initial post on AAPL back on April 3rd, 2025.
This is a classic break, test, go, setup.
WARNING! To all bulls!

We're seeing a nice box breakout NVDA | Bullish?We're seeing a nice box breakout here, which could indicate a good opportunity for a deeper correction. Therefore, we're setting the target at $91.5 and would continue moving lower until we see another box breakout in the opposite direction. Additionally, there is a major resistance level around the

NVDA Time For Bounce?Nvidia has been in a strict downtrend for the last few months, forming a constricting price action in the form of a falling wedge.
Generally, this can be seen as a bullish reversal pattern as "pressure" builds within the wedge before ultimately an explosive move.
I will look to take long trades

See all stocks ideas
Today
EBFEnnis, Inc.
Actual
0.35
USD
Estimate
0.37
USD
Today
CMAComerica Incorporated
Actual
1.25
USD
Estimate
1.16
USD
Today
BOHBank of Hawaii Corporation
Actual
0.97
USD
Estimate
0.89
USD
Today
GNTYGuaranty Bancshares, Inc.
Actual
0.75
USD
Estimate
0.71
USD
Today
CCBGCapital City Bank Group
Actual
0.99
USD
Estimate
0.74
USD
Today
HBTHBT Financial, Inc.
Actual
0.61
USD
Estimate
0.56
USD
Today
GMGIGolden Matrix Group, Inc.
Actual
−0.03
USD
Estimate
−0.00
USD
Today
WASHWashington Trust Bancorp, Inc.
Actual
0.63
USD
Estimate
0.63
USD
See more events
Community trends
Bitcoin - No one expect this move! 20% this week (plan here)Whales are preparing a huge trap for the retail traders, and you probably already know that the trap is this massive falling wedge! Falling wedge patterns are usually bullish, right? But not if they occur at the end of a trend. You probably want to trade wedges that are at the start of a trend. What

Bitcoin: Watch For These Break Out Scenarios.Bitcoin is consolidating within a very tight range: between 83 and 86K. Which way it breaks is a matter of catalyst, but recognizing the break can help to better shape expectations on this time horizon. IF 83K breaks, I will be watching for the higher low scenario (see blue square), for confirmation

Top Altcoins Choice —Your Pick (Session 3—2025)When Bitcoin grows, the Altcoins grow. It is easy to know when the Altcoins will be growing if Bitcoin is moving up with momentum, but what happens when Bitcoin isn't doing anything, just sideways?
When the Altcoins grow, Bitcoin grows. It is easy to know what will happen to Bitcoin by tracking the

BITCOIN Bulls in Control - Next Stop: $94,000?COINBASE:BTCUSD is trading within an ascending channel, signaling bullish momentum. The price has consistently respected the channel boundaries, forming higher highs and higher lows, which aligns with the continuation of the uptrend.
After consolidating within a tight range for several days, COIN

TradeCityPro | Bitcoin Daily Analysis #67👋 Welcome to TradeCity Pro!
Let’s move on to the analysis of Bitcoin and key crypto indicators. In this analysis, as usual, I want to review the New York futures session triggers for you.
✔️ Yesterday, the price was rejected from the 85,550 area, and today could be a sensitive and important day fo

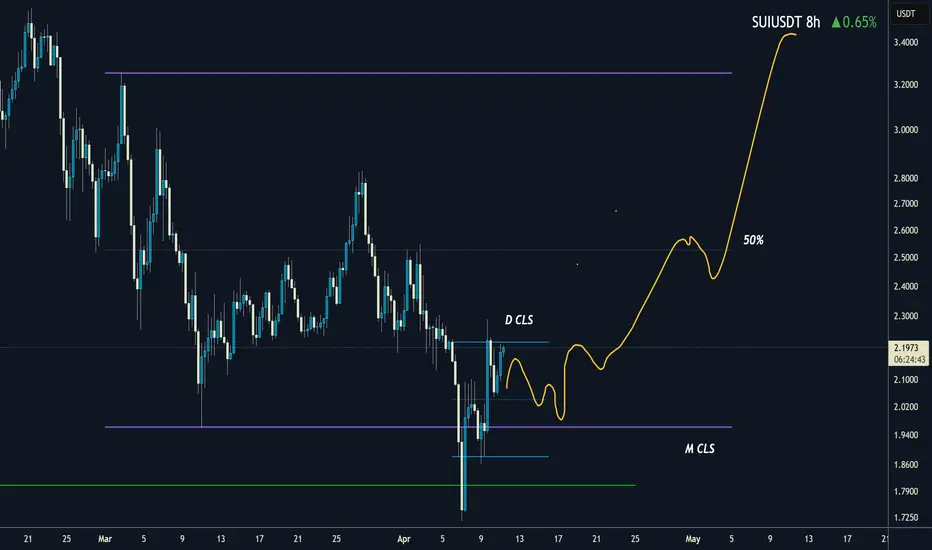
SUI I Monthly CLS I KL - OB I Model 1 I TP1 50% then openHey, Market Warriors, here is another outlook on this instrument
If you’ve been following me, you already know every setup you see is built around a CLS range, a Key Level, Liquidity and a specific execution model.
If you haven't followed me yet, start now.
My trading system is completely mech
BTC - The power of fibonacci This is a textbook example of how institutional price delivery often unfolds when targeting liquidity and rebalancing inefficiencies. The current BTC 1H chart displays a high-probability short scenario developing after a liquidity sweep, combined with entry into a fair value gap (FVG) chain and Fibo

Bitcoin Forming Head & Shoulders – Watch for a Fake-OutPattern Formation: A complex Head and Shoulders structure is forming:
Left Shoulder ✅
Double Head ✅
Right Shoulder forming 🔄
Resistance Zone: The price is currently near a strong resistance area (around $87,000–$88,000).
This zone is likely to act as a ceiling and reject the price.
Ex

BITCOIN → Retest 86190. There are chances for growthBINANCE:BTCUSD is starting to show positive signs, but it is too early to talk about a change in the downtrend or a bullish rally. Strong resistance ahead....
Against the background of everything that is happening, from a fundamental point of view, bitcoin in general has withstood the blows qu

BTC Next Move - Bulltrap or Take-off?In todays overview, we will discuss the price action of BTC and what we could expect in the short-term.
What will we discuss?
- Bitcoin approaching key resistance
- Daily trendline break - But no higher high yet
- Stochastic RSI overbought on the daily timeframe
- Defining the daily range
- Downsi

See all crypto ideas
Lingrid | GOLD Weekly OUTLOOK: strong UPTREND with RetracementsOANDA:XAUUSD continues its bullish momentum, closing another week up approximately 3.5%, primarily driven by Wednesday's breakout candle that pushed above the previous week's high. Following this strong upward movement, we've observed a period of retracement that manifested as a pinbar formation on

GOLD Trending Higher - Can buyers push toward 3,500$?OANDA:XAUUSD is trading within a clear ascending channel, with price action consistently respecting both the upper and lower boundaries. The recent bullish momentum indicates that buyers are in control, suggesting there's chances for potential continuation on the upside.
The price has recently bro

GOLD → The rally continues. Waiting for correction to tradeFX:XAUUSD supported by the weakness of the dollar and increased trade tensions between the U.S. and China continues to renew highs. At the moment the market is testing 3400...
After Friday's pullback caused by profit taking, the demand for gold rose again - investors are looking for protection

THE KOG REPORTTHE KOG REPORT:
In last week’s KOG Report we said we would be looking for a test of that 3250 level, then looking for the short into the target level given. This move played out well giving our traders a great start to the week. We then identified the level we wanted as the bias level, gave the b

GOLD ROUTE MAP UPDATEHey Everyone,
Great start to the week with our 1H chart idea playing out perfectly completing all our targets.
We started with our Bullish target at 3341 hit, followed with candle body close gaps to 3362 and 3382, as ema5 didn't catch up for the lock due to momentum. However, the body close breaks

GOLD Bullish Continuation - Is $3,600 the Next Stop?OANDA:XAUUSD is trading within a well-defined ascending channel, signaling strong bullish momentum. The price has consistently respected the channel boundaries, forming higher highs and higher lows, which aligns with the continuation of the uptrend.
It has recently broken above a key resistance zo

Habibi, the Price is Right at 70-79$Habibi, the Price is Right
Post Content (with emojis version of title at the top):
🤝🛢️ Habibi, the Price is Right at 70–79$ 💸🎯
The Call That Never Happened (But Might Have)
📞 I was just updating my crude oil chart when suddenly… my phone rang.
No caller ID. I answered. And somehow— I was patch

DeGRAM | GOLD Anchored Above the Channel📊 Technical Analysis
GOLD trades within an ascending channel, holding above $3 285 support.
A breakout from a triangle confirms bullish momentum. Key targets are $3 360 - $3 380.
💡 Fundamental Analysis
Demand is rising amid safe-haven flows, Chinese insurer interest, and central bank buy

HelenP. I Gold will start to decline, after long upward moveHi folks today I'm prepared for you Gold analytics. Recently, price has shown a powerful rally after breaking out from a prolonged consolidation phase that lasted several days. This sideways movement was confined inside the buyer zone near 2855 - 2835 points, which acted as a reliable base for bulls

ES UpdateNot many of my followers trade futures, but in case I don't have time to post an update before work tomorrow:
1) Another open gap down. I don't think it fills until RSI hits oversold and we get a bounce.
2) Dollar index broke support, but wouldn't surprise me if it did a backtest (maybe)
3) Gold t

See all futures ideas
EURCAD Approaching Major Resistance - Will Sellers Step In?OANDA:EURCAD is approaching a key resistance level, marked by significant selling pressure. This area has historically acted as a key supply zone, increasing the likelihood of a bearish reaction if sellers step in again.
The current market structure suggests that if the price confirms a rejection

NZDCAD Discretionary Analysis: Bounce at 0.83Hello traders and happy Easter Monday!
I'm expecting a bounce on NZDCAD. I'm interested in this 0.83 zone. It might turn into a strong bounce point. If the signs are there, I'm jumping in with a short.
Discretionary Trading: Where Experience Becomes the Edge
Discretionary trading is all about maki

gbpnzd xabcd buy/hold exit +300 pips🔸Hello traders, let's review the 40 minute chart for GBPNZD.
Chart looks oversold recently, expecting bounce setup soon.
🔸Speculative XABCD structure defined by point X 2460 point A 2210 point B 2400 point C 2180 point D/PRZ 2530 still pending. C also pending later today.
🔸Advanced BUY/HOLD from

USDJPY at a Crossroads: Resistance Held, But What’s Ahead?USDJPY at a Crossroads: Resistance Held, But What’s Ahead?
In our previous analysis, USDJPY respected the resistance zone near 144.40, and the price has already reached our first target.
The trade situation between the US and Japan remains uncertain, which could keep USDJPY under pressure. Japane

Euro can drop from top part of range and fall to support levelHello traders, I want share with you my opinion about Euro. Recently, price continued to grow inside a well-defined upward channel, maintaining a steady structure of higher highs and higher lows. The move started after a clear breakout from the buyer zone, which marked a strong bullish impulse and c

Lingrid | EURUSD bullish BREAKOUT Targeting CHANNEL BorderThe price perfectly fulfilled my previous idea . It reached the target zone. FX:EURUSD has formed a clear ascending triangle pattern and broke and closed above it, confirming the bullish breakout. The price has also moved above the significant psychological level at 1.15000, further strengthening

USDJPY Potential DownsidesHey Traders, in today's trading session we are monitoring USDJPY for a selling opportunity around 141.600 zone, USDJPY is trading in downtrend and currently is in a correction phase in which it is approaching the trend at 141.600 support and resistance area.
Trade safe, Joe.

GBPJPY is coming out of consolidation... With the decline of the dollar, the Japanese yen is gaining momentum and strengthening.
GBPJPY currency pair is under pressure from sellers.
The price is coming out of the triangle down, the continuation of the main downward movement is possible when the support at 188.23 is broken.
Scenario: Con

USDCHF: Classic Trend-Following Trading Setup Analyzing the price movement of 📉USDCHF.
Following a significant downward trend, the price started to consolidate within a horizontal channel on a 4-hour chart.
The violation of the channel's lower boundary indicates a strong bearish indication, suggesting a likely continuation of the downward tre

EURUSD - at Resistance: Will it drop to 1.11300?OANDA:EURUSD price is now at a strong resistance level, this is an area where it has struggled to break through in the past and reversed to the downside. It's also where sellers have stepped in before, so it’s worth keeping an eye on, especially for anyone considering short trades.
If we start see

See all forex ideas
| - | - | - | - | - | - | - | ||
| - | - | - | - | - | - | - | ||
| - | - | - | - | - | - | - | ||
| - | - | - | - | - | - | - | ||
| - | - | - | - | - | - | - | ||
| - | - | - | - | - | - | - | ||
| - | - | - | - | - | - | - | ||
| - | - | - | - | - | - | - |
Trade directly on the supercharts through our supported, fully-verified and user-reviewed brokers.


