AAPL: Buy ideaBuy idea on AAPL if only if we have the breakout with force the vwap and the resistance line by a big green candle follow by a large green volume.Thanks!

BABA: $155 | Looks like a RESET no stabilization fund SPY DOW are dazzling while this issue seems to be abandoned by speculators
until it goes sub 100 interest should kick in

3M Pulls Back3M is emerging as a potential turnaround story following years of downside. Now trend followers may take interest in its latest pullback.
The first pattern on today’s chart is the trio of high-volume bullish candles since early March. MMM raised guidance, spun off its Solventum NYSE:SOLV health-care division and then ended with a consensus-beating quarterly report.
The result has been a succession of higher lows and higher highs. Is a new uptrend emerging?
Next is the July 2023 high of $94.59. Prices stalled at this level in early April and bounced above it on May 8. The 50-day simple moving average is in roughly the same place. If prices remain above those spots, it may suggest a more significant turn has occurred.
Finally, stochastics have dipped toward oversold territory.
TradeStation has, for decades, advanced the trading industry, providing access to stocks, options and futures. See our Overview for more.
Past performance, whether actual or indicated by historical tests of strategies, is no guarantee of future performance or success. There is a possibility that you may sustain a loss equal to or greater than your entire investment regardless of which asset class you trade (equities, options or futures); therefore, you should not invest or risk money that you cannot afford to lose. Online trading is not suitable for all investors. View the document titled Characteristics and Risks of Standardized Options at www.TradeStation.com . Before trading any asset class, customers must read the relevant risk disclosure statements on www.TradeStation.com . System access and trade placement and execution may be delayed or fail due to market volatility and volume, quote delays, system and software errors, Internet traffic, outages and other factors.
Securities and futures trading is offered to self-directed customers by TradeStation Securities, Inc., a broker-dealer registered with the Securities and Exchange Commission and a futures commission merchant licensed with the Commodity Futures Trading Commission). TradeStation Securities is a member of the Financial Industry Regulatory Authority, the National Futures Association, and a number of exchanges.
TradeStation Securities, Inc. and TradeStation Technologies, Inc. are each wholly owned subsidiaries of TradeStation Group, Inc., both operating, and providing products and services, under the TradeStation brand and trademark. When applying for, or purchasing, accounts, subscriptions, products and services, it is important that you know which company you will be dealing with. Visit www.TradeStation.com for further important information explaining what this means.

May 31: More downside to correct Oct 2023 rallyNASDAQ:NVDA on weekly produced a bearish evening star candle, which coincides with bearish RSI divergence on the weekly and also 5 waves complete from Oct 2023.
More downside is expected, as seen in 1 hour chart where the first 3-wave (wxy) drop in the last week of May had RSI divergence which needs to be erased in a double correction.
Likely drop to at least retest the major psychological level of 1000.

APPLE Buyers In Panic! SELL!
My dear followers,
I analysed this chart on APPLE and concluded the following:
The market is trading on 192.38 pivot level.
Bias - Bearish
Technical Indicators: Both Super Trend & Pivot HL indicate a highly probable Bearish continuation.
Target - 184.58
Safe Stop Loss - 197.26
About Used Indicators:
A super-trend indicator is plotted on either above or below the closing price to signal a buy or sell. The indicator changes color, based on whether or not you should be buying. If the super-trend indicator moves below the closing price, the indicator turns green, and it signals an entry point or points to buy.
———————————
WISH YOU ALL LUCK

Cup & Handle Breakout.Looks like Coal India is ready for a sharp-up move in the coming month.
Entry: 493-495
Stoploss: 474
Targets: 505 / 570.

THE BATTLE IN THE CHANNELFirst of all I have to mention that what im going to write below is messed up,but you all will understand. My writing its not going to have any price analysis. Its going to flowing ideas about THE BATTLE IN THE CHANNEL.
The last few weeks we have seen a crazy volatility in the price action. We all have to agree with that this Battle is different than the others.
We expect crazy volatility.If you are lucky you can profit out of this.
I talk about GME. this volatility created THE CHANELL.
So, people jump in and expecting to profit out of this volatility.
I say,hold a second.
As i said you trade this volatility,you lucky,you make money.If you are not lucky,you no money no honey.
So after the break out of the 3.5 years FALLING WEDGE the price went BBRRRRRR,AND THEN BOOM 17.72$.
I bought one more time the dip. Volatility kicks away the loosers.
The price is in an uptrend chanell.
We call it THE CHANNEL.
10$ UP TREND CHANNEL.
I put out of conversation the parabolic movement to the 80$.
Back on THE CHANNEL again.
After of a few good news last week we saw the volume going down.But thats ok.
The price is at a good potision at the moment.
I feel that the price action after the break out its normal for the size of the money as at the size of the time on this HUGE falling wedge.
I believe that whoever reads this knows how a falling wedge works.
But this kind of approach to find out what the price is going to be in the future its very basic.
In this play THE BATTLE for the Bulls and the Bears is back again vol2 at this nice up trend CHANNEL.
Its goin to be very intresting in the month of June.
Lay back get your bananas and enjoy THE BATTLE. iTHINK BULLS HAVE THE UPPER HAND IN THIS ONE. LETS SEE...
Ofcource none of this above are financial advise. How can it be?
PS: If the MOASS theory comes true, then this play is going to have a long way up trend inside THE CHANNEL with the upside downs also.
Parabolic of course,eventually! NYSE:GME
Deffinetly Its going to be extravaganza style. NYSE:GME

Sail is Sailing!A crucial level is broken at 174.90. Price is clearly indicating another up move on the chart, this is a retrace to another level. Start accumulating from 155 to 145 Levels. Targets on the higher sides are 234.5 and 290.

NVDA to 1300 in next breakout. I believe NVDA will be $2,000 in a flash. but that's larger time frame. For now let's focus on seeing it hit $1,300 first.
Not financial Advice. But Most people didn't notice my MSTR ideas when I was banging the table. It was $487 and I believed it would hit $800 first. then after i saw the strength to $1,300 and quick support it created above $1,000, I KNEW $2,000 was coming.
Same vibes here. NFA - thoughts only

UNION BANK - Gearing up for a Break out?The PSU bank index has been moving in a slightly inclined upward channel showing positive bias. However, this stock has been moving in a sideways range for almost four months now. Now the stock is testing the top of the sideway range. The MFI indicates money is flowing into the stock. The momentum is also positive and increasing, the relative strength is also turning positive. We can see increases in the volume as well. Also, we can see increases in the delivery volumes indicating some interested buying coming in here. The minor trend and the immediate trend are also up. Looks like the stock is gearing up to break out of the range and move into the next higher orbit. So the level to watch out is 162. This stock should find a place on your watch list.

AMR Fib. Expansion. Next Resistance Level 457.80$After pullback, security has lost its value approximately %20 but that was pullback. It has happened with gap in daily chart. 07 August 2023 Symmetrical Triangle resistance was broken and second pullback can occur 457.80$ level. At the end of this week, we have to close this security more than 340.65$ level and it will be our support line.

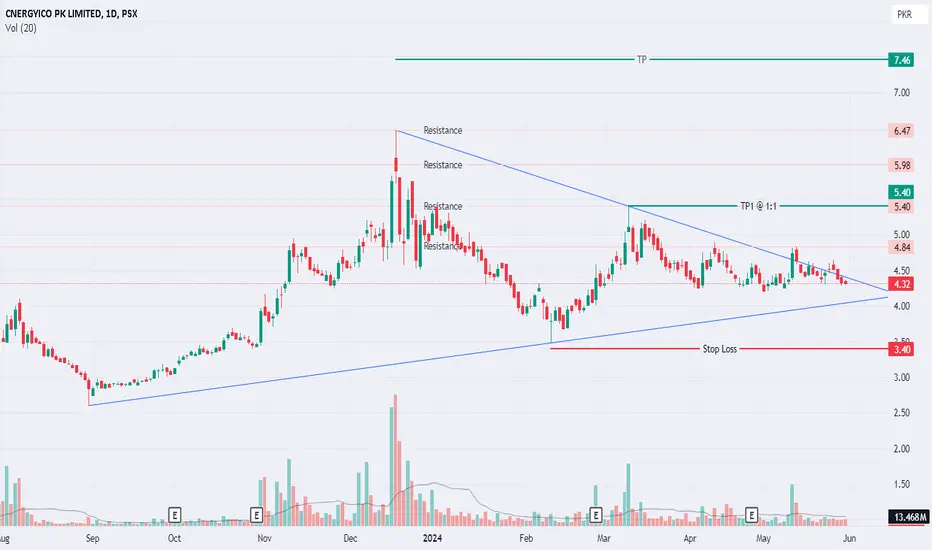
PSX: CNERGY foundation has been laid.From the start of this year the CNERGY has been struggling to sustain it journey to north and has not been successful in its attempts. In all this a triangle has been formed suggesting that it will resume its journey in whichever direction it breaks. Currently the price is breaching the upper trend line creating a bias for upward movement.
SL for the trade is 3.40 & correspondingly the TP is 5.40. Close above 5.40 shall lead to the medium term TP which is 7.48
Wishing you Profitable Trading
NKE broke out of a bear flag this weekHopefully we get that 20/50 cross that’s coming, too. Targets could be the bear’s top 95.88 or 97 based on trendline, or mental level 100. Not financial advice, just my opinoon

SWING IDEA - KNR CONSTRUCTIONSKNR Constructions , a leading infrastructure development company, is showing technical signals that suggest a potential swing trading opportunity.
Reasons are listed below :
325 Zone Tested Multiple Times : The 325 level has been a significant resistance zone. The price is now attempting to break through this level, indicating strong bullish momentum.
Bullish Marubozu Candle on Weekly Timeframe : The recent formation of a bullish marubozu candle on the weekly chart indicates strong buying pressure and suggests potential for further upward movement.
50 EMA Support on Weekly Timeframe : The stock is finding support at the 50-week exponential moving average, reinforcing the overall bullish sentiment and providing a strong support level.
Breaking Out of a 3-Year Consolidation Zone : KNR Constructions is breaking out of a long consolidation phase that lasted for 3 years, signaling a potential new bullish trend.
Sudden Surge in Volumes : A noticeable increase in trading volumes confirms the strength of the price move, indicating strong investor interest and participation in the current trend.
Trading at All-Time High : The stock is trading at its all-time high, suggesting strong market confidence and potential for further gains. However, traders should watch for potential overbought conditions or profit-taking at these levels.
Target - 400 // 450
Stoploss - weekly close below 265
DISCLAIMER -
Decisions to buy, sell, hold or trade in securities, commodities and other investments involve risk and are best made based on the advice of qualified financial professionals. Any trading in securities or other investments involves a risk of substantial losses. The practice of "Day Trading" involves particularly high risks and can cause you to lose substantial sums of money. Before undertaking any trading program, you should consult a qualified financial professional. Please consider carefully whether such trading is suitable for you in light of your financial condition and ability to bear financial risks. Under no circumstances shall we be liable for any loss or damage you or anyone else incurs as a result of any trading or investment activity that you or anyone else engages in based on any information or material you receive through TradingView or our services.
@visionary.growth.insights

Gap Stock Surges 26.87% After Revenue BeatGap shares ( NYSE:GPS ) surged more than 27% in Friday's trading session after the clothing and accessories retailer posted a better-than-expected quarterly earnings report and raised its full-year guidance. Comparable store sales in the quarter rose 3% from a year earlier, driven by each of Gap's four brands posting positive same store sales in the period. New CEO Richard Dickson has led an ambitious turnaround plan that has seen the retailer work on improving its operational efficiency and repositioning the company’s brands.
Gap's ( NYSE:GPS ) comparable store sales increased 3% from the year-ago period, showing a significant improvement from a 4% decline in last year’s corresponding quarter. The turnaround was driven by positive same store sales growth in each of the retailer's four brands, which include Old Navy, Gap, Banana Republic, and Athleta. Looking ahead, the company raised its full-year guidance, saying it now expects net sales to be up slightly, an improvement on its prior forecast where it projected flat annual sales. It also lifted its full-year operating income outlook to the mid-40% growth range, significantly higher than its earlier forecast of growth in the low-to-mid teens.
Gap ( NYSE:GPS ) CEO Richard Dickson told CNBC in an interview following the quarterly results that the plan is working and resonating with investors. Since finding a bottom in May last year, Gap shares have trended higher, with gains accelerating after the 50-day moving average (MA) crossed above the 200-day MA in early October to form a golden cross pattern. Leading into the retailer’s quarterly results, the stock has rallied towards the 50-day MA after a period of recent consolidation, indicating bullish expectations by market participants.
Amid the stock’s projected earnings-driven surge on Friday, investors should closely monitor the $28.50 level, an area where the price would likely run into overhead resistance from its March 2024 high. Gap's ( NYSE:GPS ) upgraded outlook gives Wall Street fresh proof that CEO Richard Dickson's turnaround strategy - to introduce trendier styles across its brands and ramp up marketing efforts to attract picky shoppers - is paying off less than a year after he joined the struggling mall retailer from Mattel.
The stock experience massive surged in price after a "Golden Cross" pattern exhibited since the last week of September, 2023 surging through to New Highs

TILRAY DUE FOR A BOUNCE???As you can see on the chart NASDAQ:TLRY has been bouncing off of the purple trend line since 2023. I think it is due for a pump.

Williams Companies ,,, Pullback Uptrend
As you see, the pullback has been completed. There is a good pullback to a broken price level and a good bullish candle, as a trigger, after that. I suppose setting a SL of about 39.5 can be sure and next target about $46.

Stock has its own character, #IOBAs we can visualize in chart, #IOB has is moving up and consolidate again. This looks like character of chart to consolidate and move up.
Like human being has own character this IOB has its own. And expecting to repeat it again.


Why bullish on GME?NYSE:GME 1.Fibannacci Retracement give us a price of 510$ per share in the all monthly chart.
2.Even with this move at 80$ the EMA CROSS SLOPE did not show us the long+2 signal.
3.MACD has crossed with a green buying singal and an uptrend verifacation
4.RSI at the lows with a revelsal forward to potential buying pressure
5. 2BILLION in the bank
6.25% locked and DRSED
7.Insiders buying and not selling
8. DFV THESIS
9.potential digital transformation of the company
10. PROVED WRONG SHORT THESIS.
These ten reasons are enough to just be BULLIsh on GME
Thats my hummble opinion and of cource its not any financial advise.
ANYWAY MARKET SEEMS TO BE BULLISH....CRAZY BUT IT IS INSTEAD! NYSE:GME

IF YOU DONT HAVE LABZ WHY!?!This stock is a breakout like Netcents in 2017! It's a rare approx. 2000% gain since listing, and it's just a little train that was a bit train that could! It's amazing; get on board!
LABZ = STRONG BUY
Caveat *watch closely!*

TESLA : Bullish - Butterfly-Wolfe Wave-Head Shoulders inverseTESLA : Bullish - Butterfly-Wolfe Wave-Head Shoulders inverse
A butterly was detected since several weeks
We have also a Head shoulders inverse
and a Wolf Wave Bullish
then the market can reach 207 and the 233 $
To monitor the EMA.50 and EMA.200 and ICHIMOKU "kijun"
NB : Divergences ROC and RSI , bullish

Sun Pharma is now under Breakout for Long RunSun Pharma is now under Breakout for Long Run
Note : I am Not a SEBI Registered Analyst. All Post and Levels Posting is only for educational and knowledge purpose. I Am not responsible for your any kind of loss or profit.
No Claim, All Rights Reserved.‼️
