PUT Spread on /ES Neutral to Long strategy58 days out, Jul 26th
90% chance to win on this trade without needing to adjust
-4690 +4640 PUT side
$100 premium, $13 in fees, $697 capital allocated 12.4%
Will close around 50-70%
Next time doing one of these will aim for at least $100 post fees.
Futures market

NIFTYNIFTY closed below va
1. gapup 22875 long till 22925
2. 22825-22730 trade reversal
3. gapdown 22730 short till 22650

Mapping gold Good morning everyone,
After reaching out and touching the diagonal resistance, the bulls seem to have stepped off the gas and are waiting for stronger supports. I see a multiple landing zones where buying opportunities are viable with the right set up and stop loss.
I believe the price will make its way back to the long term horizontal resistance and gather support closer to 2100 in the future.
As of right now I have sold and I’m patiently waiting for the bears to take their pound of flesh.
TP zones,
2313 and 2296
If we break through 2280 I’ll likely jump back in short after it retests ~2300.
Be patient

XAUUSD - SELL TRADE IDEAI'm looking to sell Gold for 350 pips. Overall, price is in a clear uptrend however I feel price is currently making a correction; I feel price can drop as low as 2292ish which is the Daily 38.2 Fib Level (Shallow Retracement) before resuming in Bullish momentum. For the past 9 days price has respected my micro down trend and currently price is respecting my 9 and 21 EMA. Today Gold has opened negative and the USD is strong which respects this sell idea. Looking to sell on the break and retest of 2332.250.
However, if price breaks 2348, I'll buy for 150 pips.

Bearish Divergence for Yellow Metal?Dear Traders,
Relative to USD Index analysis just now, We were expecting to have bearish move for Gold. Looks like we have found an indication the market might reverse. Any entry please have some based reasons. We targeting the market might pull-up and make HNS pattern before proceed to go down and head towards $2100.00 in upcoming weeks.
TVC:GOLD

GOLD The Target Is UP! BUY!
My dear subscribers,
This is my opinion on the GOLD next move:
The instrument tests an important psychological level 2344.0
Bias - Bullish
Technical Indicators: Supper Trend gives a precise Bullish signal, while Pivot Point HL predicts price changes and potential reversals in the market.
Target - 2351.1
About Used Indicators:
On the subsequent day, trading above the pivot point is thought to indicate ongoing bullish sentiment, while trading below the pivot point indicates bearish sentiment.
———————————
WISH YOU ALL LUCK

Gold/USDThe head and shoulders pattern in trading is a popular technical analysis formation used to predict a reversal in the market trend. It is widely considered one of the most reliable trend reversal patterns. Here’s an in-depth look at the head and shoulders pattern:
Components of the Head and Shoulders Pattern
Left Shoulder: The price rises to a peak and then declines.
Head: The price rises again, forming a higher peak than the left shoulder, and then declines.
Right Shoulder: The price rises again but to a level lower than the head, and then declines again.
Neckline: A line drawn through the lows of the two troughs between the head and shoulders. This line can be horizontal or slanted.
Types of Head and Shoulders Patterns
Head and Shoulders Top (Bearish Reversal):
This pattern forms after an uptrend, indicating a potential reversal to a downtrend.
Confirmation of the pattern occurs when the price breaks below the neckline after forming the right shoulder.
Inverse Head and Shoulders (Bullish Reversal):
This pattern forms after a downtrend, indicating a potential reversal to an uptrend.
Confirmation occurs when the price breaks above the neckline after forming the right shoulder.
Trading the Head and Shoulders Pattern
Identify the Pattern: Recognize the formation of the left shoulder, head, and right shoulder.
Draw the Neckline: Connect the lows (for a head and shoulders top) or highs (for an inverse head and shoulders) to form the neckline.
Wait for the Breakout: A trade signal is generated when the price breaks through the neckline.
Entry Point:
For a head and shoulders top, enter a short position once the price closes below the neckline.
For an inverse head and shoulders, enter a long position once the price closes above the neckline.
Target Price: The potential price target is estimated by measuring the distance from the head to the neckline and projecting this distance from the breakout point.
Stop-Loss: Place a stop-loss order to manage risk. For a head and shoulders top, the stop-loss is typically placed above the right shoulder. For an inverse head and shoulders, it is placed below the right shoulder.

XAU / USD 4 Hour ChartHello traders. We had a holiday here in the US yesterday and today my internet was down until an hour ago. Saying that, I have shown my area of interest on the 4 hour chart. We have news this week so I am in no hurry to rush a trade. If $2355 can hold as support, we may see a push up. Clean buy from $2363.10 to $2373. These are just a few of the potential trade set ups I can see as a possibility. Let's see how the overnight plays out. BIg G gets all my thanks. Happy Tuesday to everyone. Be well and trade the trend.

OIL: First green dayHi everyone and welcome to my channel, please don’t forget to support all my work subscribing and liking my post, and for any question leave me a comment, I will be more than happy to help you!
“Trade setups, not movements”
1. DAY OF THE WEEK (Failed Breakout, False Break, Range Expansion)
Monday DAY 1 Opening Range ✅ day 2 cycle
Tuesday DAY 2 Initial Balance
Wednesday DAY 3 (reset DAY 1) Mid Point Week
Thursday DAY 2
Friday DAY 3 Closing Range
2. SIGNAL DAY
First Red Day
First Green Day ✅
3 Days Long Breakout
3 Days Short Breakout
Inside Day
3. WEEKLY TEMPLATE
Pump&Dump
Dump&Pump ✅
Frontside ✅
Backside
4. THESIS:
Long: This market could coiling for an explosive move back to the previous HOW, where short traders are still in profit
Short: I do not exclude the secondary scenario of pump and dump starting from Friday, eventually evolving during the further days
Please note that the purpose of my analysis is to help me and you hunting the best trade setup for the day, none of my technical aspects are a way to forecast any directional market movement.
Gianni

Golden Slope All ideas are strictly my interpretation of price action. I am not a professional trader nor is this
professional advice.
I will continually update all trades.

XAUUSD: 2368-2373 is a good short trading range
In the past day, gold reached a high of around 2364, just one step away from the resistance. Today's focus is still on whether the resistance is broken or not.
Judging from the current market situation, I still want to try the resistance. It depends on whether I can accumulate enough bullish power in the 2347-2334 range during the backtest. If I can, then there is hope for the first attempt at resistance today.
If I want to break through the resistance and achieve the resistance in the range of 2383-2391, there is little chance today. The focus is on tomorrow's data. If it is favorable to gold bulls, then this possibility will be greater.
Today's trading focus is on the resistance range of 2368-2373. If it can reach this position, it will be a better short trading area. If it cannot be reached, continue to maintain the strategy of going long at a low position.
Friends who need detailed trading signals can leave me a message to receive them.

GOLD on the Major Support 1. Gold still on the consolidation.
2. Once its broken the resistance or support we can trade.
3. If major support broken we can take short entry. if not we can go for Long.

Orange Juice Crisis Prompts Search for Alternative FruitsThe global orange juice industry faces an unprecedented crisis due to bad weather and disease in Brazil, the world's largest orange exporter. Orange juice futures have surged to record highs, nearly doubling in price over the past year. This situation has led manufacturers to explore alternative fruits like mandarins for juice production.
Key Points:
- Record High Prices: Orange juice futures hit $4.92 a pound, reflecting concerns over supply shortages.
- Natural Disasters: A hurricane and cold snap in Florida, along with citrus greening disease, have devastated US orange groves.
- Brazil's Struggles: Brazil's orange production has fallen by 25% this year due to adverse weather and disease.
- Mandarins as Alternatives: Industry leaders are considering mandarins, which are more resilient to climate change, as a viable alternative for juice production.
- Regulatory Challenges: The International Fruit and Vegetable Juice Association is exploring legislative changes to include other citrus fruits in the definition of orange juice.
The long-term outlook remains uncertain as the industry adapts to these challenges, potentially leading to higher prices and new juice flavors for consumers.

nasdaq FUN TIME2 possible trades.
long and short.
target in green.
description on the chart.
have fun
Elektra 33

Primary count remains this one...last one was bearish alternateI still remain boolish... but want to make sure we are all aware of bearish alternate counts....this is my primaryt count for silver.

xbrusdThe chart is printing Bearish trends their is Divergence
The entry Point Will be 84.03 and the stop loss will be 85.05

XAUUSD 15 Min Bullish Support Xauusd 15 min bullish support zone to pull back upside mkt
Lets see whats hpn mkt

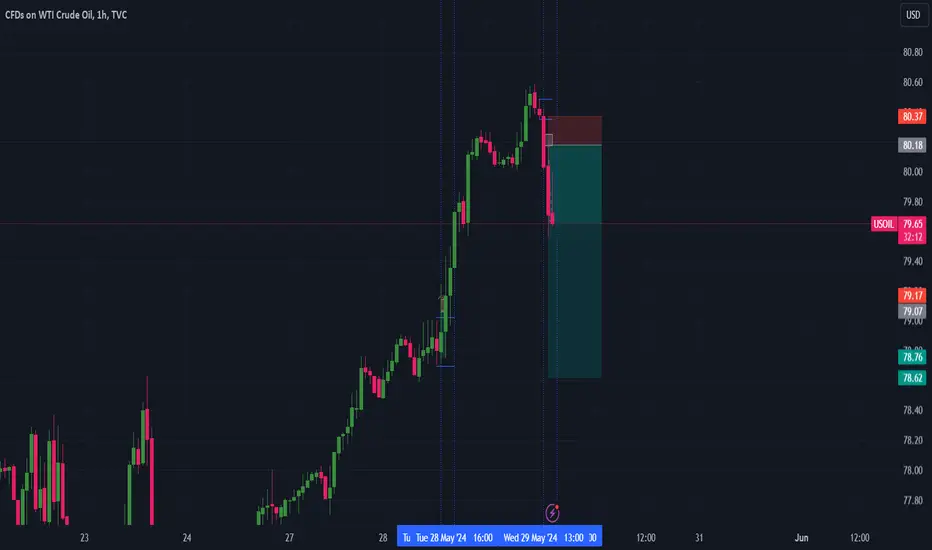
USOILUSOIL is in bullish trend.
Bearish divergence also form in RSI which shows that this might be the last HH.
We wait and watch for the breakout of last HL.

FROTO2! FUTURESExpect to see the last leg of a flat correction, with a target between 1019-1080. I suppose that correction will finish between 31th of May to 6th of June.

I don't believe youAll ideas are strictly my interpretation of price action. I am not a professional trader nor is this
professional advice.

Clean up on Isle 6All ideas are strictly my interpretation of price action. I am not a professional trader nor is this
professional advice.
