IREDA given a breakout ? cmp 182.70after a healthy correction of 48%, rebounded more than 55% and given a weekly breakout. expecting to move another 12% to 18% in short term.
Target 201, 213, 236
Support 153.60 - 163.50

SWING IDEA - IOB (INDIAN OVERSEAS BANK)With its strong foothold in the Indian banking sector and commitment to providing financial services to customers, Indian Overseas Bank presents an intriguing opportunity for swing traders.
Reasons are listed below :
Strong Support at 55-60 Zone : IOB has established a robust support base in the 55-60 zone, from which the price is rebounding, reflecting market confidence in the bank's stability and resilience.
Bullish Engulfing Candle : A bullish engulfing candlestick pattern on the daily timeframe, engulfing eight previous daily candles, indicates a strong reversal and potential upward momentum in IOB's stock price.
'W' Pattern Formation : The formation of a 'W' pattern suggests a potential reversal and bullish continuation, highlighting the underlying strength and positive sentiment surrounding IOB.
0.618 Fibonacci Support : Finding support at the 0.618 Fibonacci level reinforces the bullish outlook, providing a solid foundation for potential upward movement.
Increase in Volume : Notable increase in trading volumes reflects growing market interest and potential accumulation by investors, adding confirmation to the bullish thesis for IOB.
Higher Highs Formation : IOB has been forming higher highs, indicating a trend of increasing bullish momentum and reinforcing the potential for further gains.
Target - 70 // 82 // 90
Stoploss - daily close below 54
DISCLAIMER -
Decisions to buy, sell, hold or trade in securities, commodities and other investments involve risk and are best made based on the advice of qualified financial professionals. Any trading in securities or other investments involves a risk of substantial losses. The practice of "Day Trading" involves particularly high risks and can cause you to lose substantial sums of money. Before undertaking any trading program, you should consult a qualified financial professional. Please consider carefully whether such trading is suitable for you in light of your financial condition and ability to bear financial risks. Under no circumstances shall we be liable for any loss or damage you or anyone else incurs as a result of any trading or investment activity that you or anyone else engages in based on any information or material you receive through TradingView or our services.
@visionary.growth.insights

$GME Target updatesTarget #1: $24.5 ~ $27.7 We already in this zone
Target #2: $39.5
Target #3: $48.75
Target #4: $120+ Can we sustain the momentum to $120+? Unsure about how crazy this one can go.💎🙌
Will take profit at each target.

SWING IDEA - RCFMACD Cross is in play.
Volume has increased a lot this week.
1Y Beta is @ 1.78, which is very good for this stock.
This week could be your Entry week if stock retest levels mentioned on chart. Good change it might too.
Overall looks good till Swing High.

$GME Show me the tendiesIf we bounce from $20.20 (gap needs to be cleared) I would expect a move back to current highs - $64.83.
Once the current high is taken out at $64.83, I would expect a move to my wave 3 target.
It's all doable but will take patience and large amount of buying from retail investors from ITM calls options to send this rocket!
Hindsight is a wonderful thing, so time will tell.
Wave 3 target = $432
Wave 4 target = $65.60
Wave 5 target = $2852

I see the futureRemember this when you think something is unbeatable
Someone will cash his profits, a correction will happen at one point or another.

GameStop Surges After Company Completes $933 Mln Share RallyGameStop shares ( NYSE:GME ) surged 20% on Tuesday after the video game retailer successfully sold 45 million shares worth roughly $933.4 million, capitalizing on a recent meme rally in its share price. The sale helped the company capitalize on a recent social media-fueled meme rally that saw the stock soar around 135% over a two-day period earlier this month. Traders may book profits in GameStop shares around $27, an area on the chart where a May 13 gap sits in close proximity to a key horizontal line connecting a series of price action over the past 19 months.
GameStop ( NYSE:GME ) initially announced the share offering on May 17, several days after the peak of the social media-fueled rally, saying it planned to use the proceeds for general corporate purposes, such as investments and acquisitions. Although the company did not disclose the sale price of the shares, it said it executed the offering at-the-market, meaning it sold the shares at the prevailing market price, allowing the retailer to cash in on a portion of the meme-driven gains.
Investors will gain further insight into the company's financial position and outlook when it reports fiscal first-quarter earnings after the closing bell on June 5. GameStop ( NYSE:GME ) has given up about 70% of its gains in recent weeks, with the price falling towards a multi-month downtrend line. In upcoming trading sessions, investors should pay close attention to the $27 level, an area on the chart where traders may book profits near a key horizontal line connecting a series of price action over the past 19 months.
Technical Outlook
Gamestop stock ( NYSE:GME ) is up 14.32% as of the time of writing, forming a "golden cross" pattern at the 1 month-low region. The stock has a Relative Strength Index (RSI) of 52 which is prime for further surge in the long term. Accentuating to the bullish campaign is the upside gap formed in the daily price chart.

AMD CALL Bought AMD Call
Strike $180
Expiry 14 Jun
Entry $2.50
Expecting AMD to reach
1st Target $184
2nd Target $193
Analysis as below:
Weekly TF:
1. Uptrend -- Above SMA200
Day TF:
1. Structure -- Inverse Head and shoulder (broke out of neckline, now retesting)
2. RSI -- bullish divergence
4hr TF:
1. MA -- Price closed above EMA 25 (blue)
2. Fib R -- Price closed above 0.618 Fib R aka $158 (uptrend in tact)
3. Confirmation candle -- printed green body candle after bouncing off EMA 25 and 0.618.
4. RSI -- not overbought yet/no bearish divergence (More room for upside)
Remarks:
Price is currently testing the resistance of SMA100(purple) for the 5th time.
The frequency of price testing to break SMA100 becoming shorter (Weaker selling pressure)
If price is able to close above SMA50(green) and SMA100(purple), expect AMD to rally in no time.

GME - BULLFirst shot on this Bull has arrived
Here is a prediction for you all given the fact that the movie #Dumb #Money is out.
This has 3 targets and yes it has officially just started. I would expect a drop to 10 with confirmed lower structure for the hold and switch. All relevant structure is applied and you will see what it does at each of the points so feel free to follow along as a demo of my plugin (#UBS).
#GME #BULL
I will add to this as the idea develops... The targets are Time-frame specific likewise the stops...

$nvda update #Nvidia #NVDA update:
#Wallstreet back online after holidays with a familiar trend.
As major chipmaker stocks significantly outperformed the broader market.
Nvda stocks surged over 6% ->1.128, reaching New ATH.
( #ElonMusk xAI plans to build supercomputer fuel by #nvidea chips )
NVIDIA keeps on producing incredible results. We got ourselves another gap up to the next PPoint(1D). At this point we have adjust frames to continue analysis of the price movement but don't be surprised to see R5 touched, if R4 holds. Would like to see a double b bounce as with previous point for further confirmation.

PFC: Long Positional Opportunity for another 25-30%Power Finance Corporation (PFC) is looking good for both short and long term. Looks like a fresh cup and handle breakout pattern is done.
CMP - 517
Target - 600+
Keep tight SL of 470.
This is not a buy/sell recommendation. Please do your own research before acting on it.

$NVDA to 1150 by May.. Look back at THEE NVDA call.. #BullflagAfter multiple retests of 61.8 fib, I think JPOW just gave clearance past 1k. I implore you to look at what AVGO did when it broke 1,000 critical level as well as look back at TSLA in 2020 pre/post stonk split. NVDA is now a STONK, and those only go up. AMEX:SPY trend line was regained today, classic shake out before next leg up, thought we'd get a better dip honestly, jobless claims tomorrow probably priced in,,, kind of hard not to long this bull flag setup with the trend on your back, look for cheap 1050c for a couple weeks out is my target. Will post position in AM.

GMEWith the new issue sold out in one week and $2 billion now on the balance sheet things are looking up. Non performing store closures should begin to show up in the bottom line in the near future. The question has been raised as to how much shadow short interest actually exists on this security… how is that a thing/is it really a thing?
The chart has a trading range which once broken should result in a big move in either direction. With Apes holding strong…
I’m in for the potential short squeeze moonshot!

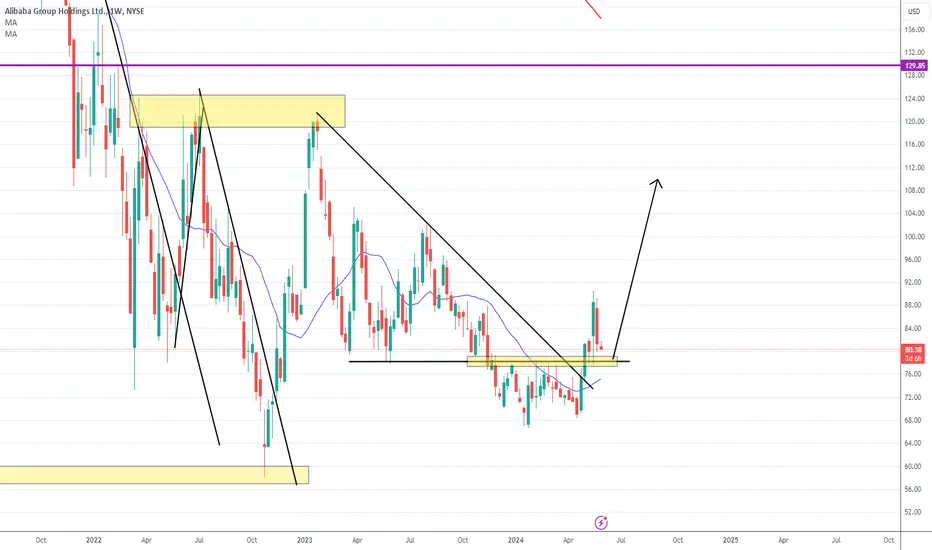
longCan we see a big move up on alibaba? We should watch if this can do a retest to the support zone
AMC pumps price and volume into fair value zone LONGAMC is on a 4H chart with a set of VWAP bands overlaid In the past two trading sessions price
and volume have pumps and so also the PV Trend indicator. There is no fundamental
footprint on this move. it is a pure meme much like a similar move of GME. I will go long
here hoping to ride the momentum and capture profit. I will set a stop loss fo 10% n
recognition of the volatilit The final target is the $ 120 range pivots of April and
August 202. The initial target is the $35 range of the ranging zone of August 2023. Upon
reaching the first target I will cut the position to 50% for the leg higher. I will cut the position
if momentum fades especially if the volume fades with it. This will be interesting at the least
and highly profitable at the very most.

CENTRALBKLooks good on Charts.
Volume Buildup seen in all PSU Banks.
Above all Key EMA.
Short term target 77 , 92.
Do Like ,Comment , Follow for regular Updates...
Keep Learning ,Keep Earning...
Disclaimer : This is not a Buy or Sell recommendation. I am not SEBI Registered. Please consult your financial advisor before making any investments . This is for Educational purpose only.

Pfizer implements $1.5bn cost-cutting initiative. Idea 27/05/24Pfizer Inc. (PFE) has announced a new multi-year plan to reduce operational costs by approximately 1.5 billion USD by the end of 2027. This initiative is in addition to a previously announced 4 billion USD cost reduction strategy in response to decreased investments and a sharp decline in sales from its COVID-19 vaccine. Amid these challenges, Pfizer has actively restructured its operations, including acquiring cancer drug manufacturer Seagen for 43 billion USD, aiming to diversify and strengthen its product portfolio.
Despite these financial adjustments, Pfizer has raised its full-year earnings forecast following better-than-expected earnings in Q1. These results were partly attributed to the successful implementation of cost-saving measures. To bolster its financial standing, the company focuses on operational efficiency, restructuring its network, and enhancing its product portfolio.
Given this backdrop, let's examine the potential trading opportunities for Pfizer Inc. (NYSE: PFE):
On the Daily (D1) timeframe, Pfizer's stock shows a resistance level at 29.65 USD and support at 28.45 USD. The resistance line of the ongoing downtrend has been breached, suggesting a potential shift in market sentiment. If the trend reverses downward, a possible target might be 25.30 USD.
If the current uptrend persists, a short-term target is 31.90 USD upon rebounding from the 29.65 USD resistance level. For a medium-term strategy, the stock price could reach 34.10 USD if the upward momentum continues.
—
Ideas and other content presented on this page should not be considered as guidance for trading or an investment advice. RoboMarkets bears no responsibility for trading results based on trading opinions described in these analytical reviews.
The material presented and the information contained herein is for information purposes only and in no way should be considered as the provision of investment advice for the purposes of Investment Firms Law L. 87(I)/2017 of the Republic of Cyprus or any other form of personal advice or recommendation, which relates to certain types of transactions with certain types of financial instruments.
Risk Warning: CFDs are complex instruments and come with a high risk of losing money rapidly due to leverage. 69.88% of retail investor accounts lose money when trading CFDs with this provider. You should consider whether you understand how CFDs work and whether you can afford to take the high risk of losing your money.

RIOT Platforms - Corsicana 2024! 🍿🤗🕺Been buying shares of RIOT, and will continue to add shares anytime this gets in the 9s. After a couple bad years of production, RIOT's new Corsicana facility is energizing and the new miners will boost hashrate and increase efficiency. Oh, and lets not forget the 8500 Bitcoin on the balance sheet and positive earnings. RIOT has been undervalued for too long!
As for the technicals, everything looks golden imo. Macro trend from 2020 retested. 618 held, .50 held. Not seeing anyway bears get this back to the 7s.
LFG!

COIN - COINBASE LongDear traders,
Id like to share this idea in order to take long positions, basically the price is within a bullish trend correction (flag bullish pattern), it look likes a quite healthy uptrend so we look at buying opportunities.
The idea to open new positions now is acceptable (230 Dollars), we might see Coinbase in 400 dollars. it might be pushed up with the potential ETH ETF approval.
best,

MSFT Bullish Continuation out of a Cup and Handle LONGMSFT on the daily chart shows the price action in the bull run out of the Covid lows then a
cup and handle pattern is printed and finally bullish continuation above the level of the cup.
Since the cup has a height of $145 and the level of the lip of the cup is $345, the pattern
forecasts bullish continuation for $ 145 above the cup's lip at $ 345 and so targeting $ 480.
I will continue to add to my MSFT position while watching for pivot lows on the 120-240 minute
charts. MSFT is a major player in the AI space and could even launch its own semi-conductor
division to compete with NVDA and the others. It has a healthy balance sheet and free flowing
cash from which to grow without dependence on interest rates coming down. The RSI indicator
shows consistent strength without signs of being overbought.

COIN setting up long after a pullbackCOIN has a big jump July 13 after some good news on SEC litigation against crypto
and a court ruling was issued. It is shown here on a 15 minute chart.
Since a double top it went sideways for a week and then down trended. The anchored VWAP
bands serve to give context and serve to show dynamic support and resistance price was at the
mean VWAP on July 13th when it popped. In the price action since price did a VWAP breakout
and then a breakdown to bounce off the same mean VWAP black line and is now a bit above it.
As I believe COIN is now trending up with the relative strengths of the low and high time frames
at about the 50 level. I have set a stop loss below the VWAP line and targets as TP1 -105
TP2- 107 and TP3 -109 although the price could reach the highs of 7/13 especially if
there are legal or regulatory updates favorable to the cryptocurrency sector. I will also take
a look at RIOT and MARA.

$LW, possible reversal?As of April 2024, market seem to be moving forward for a correction after the bullish uptrend for a couple of months.
Needless to say, if you are holding on to some stocks, you are likely to experience some drawbacks at this moment of time. Yes, I am currently holding a couples such as NASDAQ:AMZN , NASDAQ:GOOG , NASDAQ:ADBE , NYSE:UNH etc.
NASDAQ:ADBE and NYSE:UNH are currently giving me some headache due to their drawdowns but after some analyzing, I decided to hold it for a longer period of time. More on that on future posts.
As of now, let's take a look at NYSE:LW , which is having a drawdown as well. I am entering this stock now due to a possible uptrend reversal.
Let me know what do you think.

Container Corporation of India Ltd (ticker: CONCOR) ForecastThe chart provided is a 4-hour candlestick chart for Container Corporation of India Ltd (ticker: CONCOR) on the National Stock Exchange (NSE). Here’s a detailed analysis and summary of the chart:
Timeframe and Data:
- Timeframe: 4-hour
- Data Range: From early February 2024 to mid-June 2024
Price Analysis:
- Current Price: ₹1,102.00
- Price Movement: The stock has been in an uptrend since mid-March 2024. The chart shows a series of higher highs and higher lows, indicating an uptrend.
Technical Patterns and Indicators:
- Elliott Wave Analysis:
- The chart appears to be annotated with Elliott Wave counts.
- Wave (1): The first upward wave starting from the mid-March low.
- Wave (2): A corrective wave that retraced some of the gains of Wave (1).
- Wave (3): A strong upward wave that broke the previous high set by Wave (1).
- Wave (4): A corrective wave following Wave (3), not reaching the low of Wave (2).
- Wave (5): The final upward wave, which is currently forming.
- Rising Wedge Pattern:
- The price action appears to be forming a rising wedge pattern, with the upper trendline connecting the highs and the lower trendline connecting the lows.
- Upper Trendline Resistance: Around ₹1,125.00 to ₹1,130.00
- Lower Trendline Support: Around ₹1,065.00 to ₹1,075.00
Key Levels:
- Resistance Levels:
- Immediate resistance at the upper trendline of the rising wedge, approximately around ₹1,125.00 to ₹1,130.00.
- Psychological resistance at ₹1,150.00.
- Support Levels:
- Immediate support at the lower trendline of the rising wedge, around ₹1,065.00 to ₹1,075.00.
- Further support at previous swing lows near ₹1,020.00 and ₹990.00.
Trade Setup:
- Bullish Scenario: If the price breaks above the upper trendline of the rising wedge and sustains above this level, it could indicate further upside potential. The next resistance levels to watch would be ₹1,150.00 and beyond.
- Bearish Scenario: If the price breaks below the lower trendline of the rising wedge, it could signal a potential reversal or deeper correction. The next support levels to watch would be around ₹1,020.00 and ₹990.00.
Conclusion:
The chart for Container Corporation of India Ltd shows the stock in an uptrend, forming an Elliott Wave pattern and a rising wedge. The key levels to watch include the resistance at the upper trendline of the wedge around ₹1,125.00 to ₹1,130.00 and the support at the lower trendline around ₹1,065.00 to ₹1,075.00. A breakout above the upper trendline could suggest further upside, while a breakdown below the lower trendline could indicate a potential reversal or correction. Traders should look for confirmed breakouts in either direction to make informed trading decisions.
