Testing the new long term channelIf the market bounces from the low in the new channel, it might be bounce into a new high. If it drops back into its old channel, we might see lower lows. The bull market isn't broken long term.
VTI trade ideas


Divergence crashLarge divergence in price and momentum leading up to the 2007-2009 crash. Same is repeating, only much bigger right now.

Custom Market Cap Index shows the US stocks will trend higherThis custom Market Cap Index is something I used to gauge market conditions and capability with regards to trends, peaks, bottoms and more. You can see that is ranges price volatility quite well and allows me to see what the market is capable of doing over the next few weeks and months.
Right now, the US stock markets have quite a bit of upside price range to go. Don't be surprised if the US stock markets continue to rally over the next 3+ weeks and then stall out for the remainder of the fall season. Increased volatility may come in early November or December as my cycle indicators show volatility should increase near this time.
Pay attention to my posts. You may find my work is far deeper and more advanced than simple trading triggers. I've just predicted what will happen over the next 4~5 months with a relative degree of certainty.
Follow me to learn more and I'll share even more resources with you.

Short on VTIBroad index's will always mean-revert. If we look at the 750 MA or 1250 MA, prices have been blowing up thanks to the US policies and big companies' growth. Prices seem to not be able to break above their all-time high, yet, everyone seems to be buying at any pullback opportunity.
This ETF will be going down by at least 5-10%. Once it has, it will become a very attractive buy; the US economy is good and the companies are flooded with cash; people want to get in on that... at the right price.


US Market OverboughtFollowing the trend lines shows deeper correction in next 3-5 months.
I'd say next earnings season (June-July) will be the spark.

Where is the US stock market headed?I've done ideas on the DJIA and the SPX, but I haven't really looked at the entirety of the US market. My prediction is in the chart. I put my thoughts on why it would go down on my ideas on the indices. I think it'll be a mix of political factors (Trump's idea of tariffs), people moving to bonds, and overall fear of the market as it has stayed bullish so long.
Tell me what you think below,
-Kristian

VTI: Ascending Wedge, Bearish Harami, bearish IndicatorsA late push by VTI changed a bearish Engulfing to a bearish Harami.

VTI daily counter trendVTI daily is counter trend. Intermediate bearish. Eyes on the target just below the kijun sen.


VTI/VWO - trend may be turning - 8/5/2016VWO has been outperforming since the start of the year. So far, the overall trend is still up but showing signs of crack. RSI and MACD are both breaking. the ratio itself is still above the support, and the MA cross is yet to generate a sell signal.


$VTI weeklyJust seeing what happens with this next week. Could be that it consolidates a bit under resistance. Would like to see weekly MACD cross down.

large mkt etf short going into cloud money flow weak china growtelevated valuation of large stocks/buybacks taper off in summer/us president election uncertainty/waning policy of fed/cci and percent r in bottom range/stoc crossed/relative strength weak/leaders lagging/maybe another rate hike/summer months possibility of spread of zika virus/


VTI weekly looking for rejection hereI am looking for a possible rejection on this VTI weekly chart. This is a very good indicator chart. See if we get the rejction

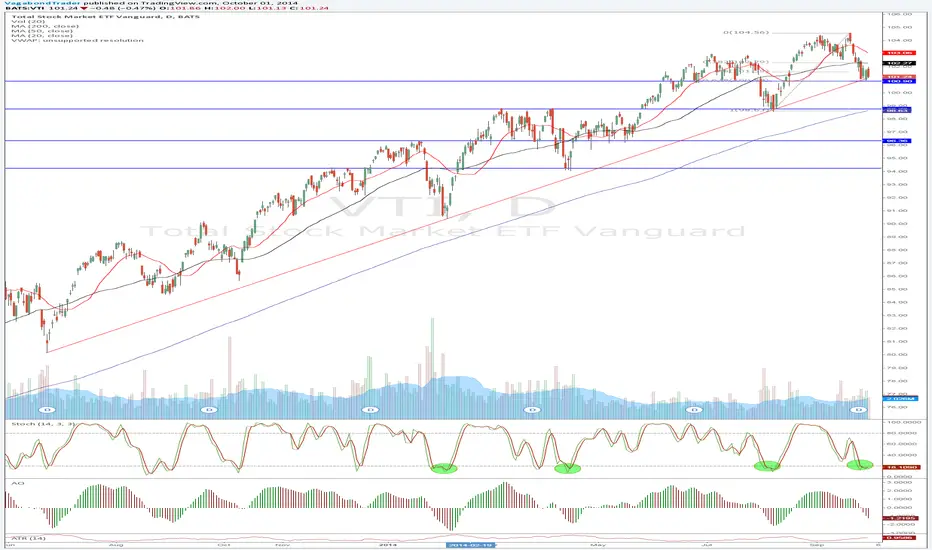
VTI - PullbackWill the buy the dippers come back in and push the market higher?
Reasons to buy:
1. Stoch oversold
2. Horizontal support
3. Rising trend line
4. Fib retracement