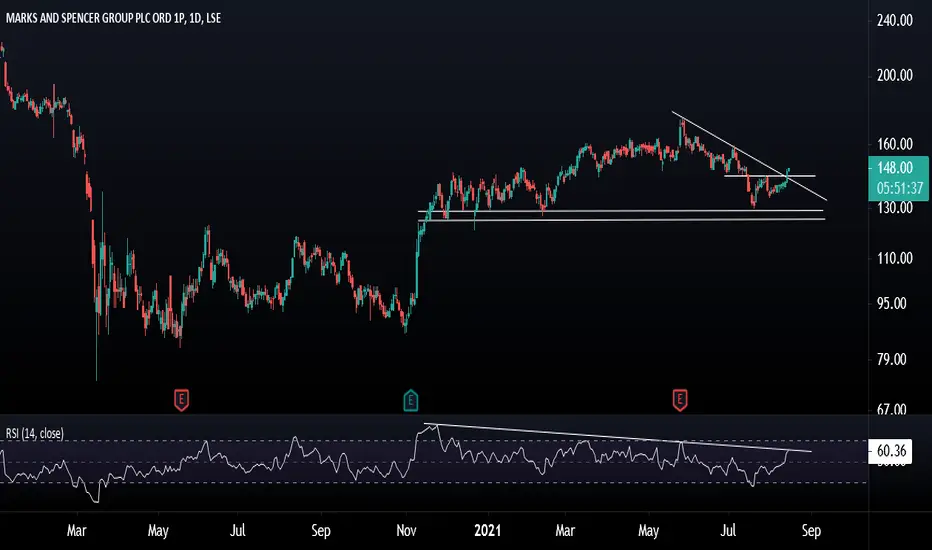
Breakout by Marks & SpencerDouble bottom formed from May 19.
Breakout Nov 23
Retest Feb 24 and now broken out to the upside in May
Appears bullish to me but do your own research and decide on your own trades. This in NOT a recommendation.
Next report date
—
Report period
—
EPS estimate
—
Revenue estimate
—
4.59MXN
9.02 BMXN
272.80 BMXN
2.02 B
About MARKS & SPENCER GROUP ORD GBP0.01
Sector
Industry
Headquarters
London
Founded
1884
ISIN
GB0031274896
FIGI
BBG003TLFHP4
Marks & Spencer Group Plc engages in the retail of clothes, food, and home products. It operates through the following segments: UK Clothing and Home, UK Food, International, Ocado, and All Other. The UK Clothing and Home segment retails womenswear, menswear, lingerie, kidswear and home products. The UK Food segment includes the results of the UK retail food business and UK Food franchise operations. The International segment is composed of Marks and Spencer owned businesses in Europe and Asia and the international franchise operations. The Ocado segment represents the group's share of profits or losses from the investment in Ocado Retail Limited. The All Other segment covers other business activities and operating segments, including M&S Bank and M&S Energy. The company was founded by Michael Marks and Thomas Spencer on September 28, 1884 and is headquartered in London, the United Kingdom.

Marks & Spencer Gap PLC - LSE - Making a bounce!!we've got Marks and Spencer bouncing back from its recent lows - looks like a fantastic chance to leap in for a buy trade.

2 Retail Stocks to WatchMarks & Spencer (MKS)
Financials:
Marks & Spencer reported strong growth in both its Food and Clothing & Home businesses for the first 19 weeks of the financial year. Food sales increased by over 11%, driven by price changes, while Clothing & Home sales grew by more than 6%, primarily due to in

MKS weekly time frame analysisMKS has created a higher low on the weekly time frame. It's a great confirmation of the uptrend after such a brutal long-term bear trend.
Expecting 100 % move up on weekly so it will take some time but our target would be around 377 $.
However it's not the best entry now as the stop loss would have

Marks and Spencer Plc. +11% on FY Guidance Raised. Take Profit MKS shares gaining 11-12% this Friday as FY guidance raised. Traders could use advance to book profits into the weekend.
Original idea attached (13/08).

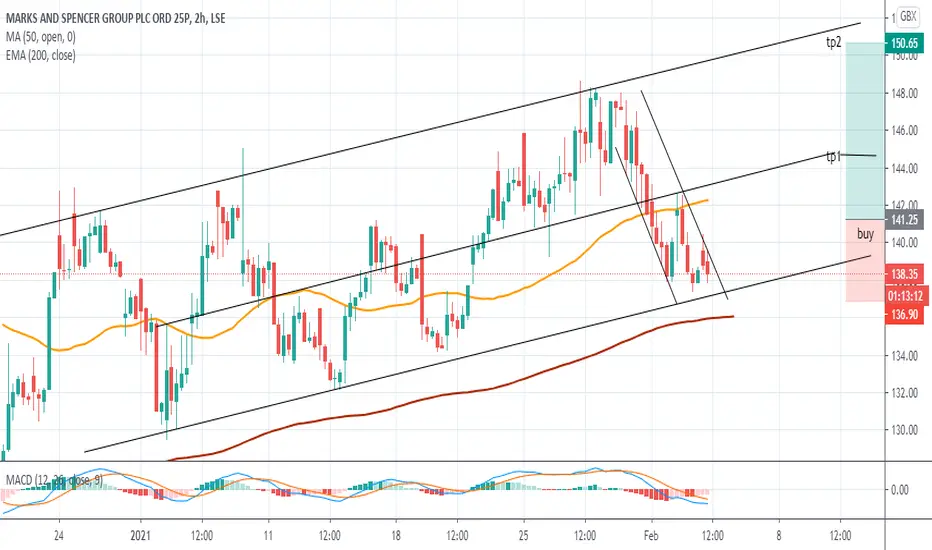
Trade Setup: Buy/Long Marks & Spencer Plc (MKS)Double trend line resistance cleared
Daily 50-EMA and 200-SMA cleared
14-day RSI testing resistance, possible breakthrough
Trade Levels: Buy at current levels, 148.00 or better
Stop: 139.00
Target: 164.00


Marks and sparks undervalued M&S have had an unfortunate ride with the sudden exit of their CEO followed by Covid-19. Nonetheless, we are trading far below its intrinsic value.
As seen we are reaching the final quarter of our descending channel as well as nearing a return to normality from the Corona virus. We can reasonably

See all ideas
Trade directly on the supercharts through our supported, fully-verified and user-reviewed brokers.


Curated watchlists where MKS/N is featured.

Frequently Asked Questions
The current price of MKS/N is 57.81 MXN — it has increased by 15.16% in the past 24 hours. Watch MARKS & SPENCER GROUP stock price performance more closely on the chart.
Depending on the exchange, the stock ticker may vary. For instance, on BMV exchange MARKS & SPENCER GROUP stocks are traded under the ticker MKS/N.
MKS/N stock has risen by 15.16% compared to the previous week, the month change is a 15.16% rise, over the last year MARKS & SPENCER GROUP has showed a 102.84% increase.
We've gathered analysts' opinions on MARKS & SPENCER GROUP future price: according to them, MKS/N price has a max estimate of 79.45 MXN and a min estimate of 55.08 MXN. Watch MKS/N chart and read a more detailed MARKS & SPENCER GROUP stock forecast: see what analysts think of MARKS & SPENCER GROUP and suggest that you do with its stocks.
MKS/N reached its all-time high on Oct 12, 2015 with the price of 118.67 MXN, and its all-time low was 28.18 MXN and was reached on Jun 26, 2020. View more price dynamics on MKS/N chart.
See other stocks reaching their highest and lowest prices.
See other stocks reaching their highest and lowest prices.
MKS/N stock is 13.16% volatile and has beta coefficient of 0.40. Track MARKS & SPENCER GROUP stock price on the chart and check out the list of the most volatile stocks — is MARKS & SPENCER GROUP there?
Today MARKS & SPENCER GROUP has the market capitalization of 124.83 B, it has decreased by 0.63% over the last week.
Yes, you can track MARKS & SPENCER GROUP financials in yearly and quarterly reports right on TradingView.
MARKS & SPENCER GROUP is going to release the next earnings report on Nov 6, 2024. Keep track of upcoming events with our Earnings Calendar.
MKS/N earnings for the last quarter are 2.32 MXN per share, whereas the estimation was 2.23 MXN resulting in a 3.93% surprise. The estimated earnings for the next quarter are 2.95 MXN per share. See more details about MARKS & SPENCER GROUP earnings.
MARKS & SPENCER GROUP revenue for the last quarter amounts to 145.29 B MXN despite the estimated figure of 141.70 B MXN. In the next quarter revenue is expected to reach 136.97 B MXN.
MKS/N net income for the last quarter is 4.67 B MXN, while the quarter before that showed 4.42 B MXN of net income which accounts for 5.59% change. Track more MARKS & SPENCER GROUP financial stats to get the full picture.
EBITDA measures a company's operating performance, its growth signifies an improvement in the efficiency of a company. MARKS & SPENCER GROUP EBITDA is 27.62 B MXN, and current EBITDA margin is 10.13%. See more stats in MARKS & SPENCER GROUP financial statements.
Like other stocks, MKS/N shares are traded on stock exchanges, e.g. Nasdaq, Nyse, Euronext, and the easiest way to buy them is through an online stock broker. To do this, you need to open an account and follow a broker's procedures, then start trading. You can trade MARKS & SPENCER GROUP stock right from TradingView charts — choose your broker and connect to your account.
Investing in stocks requires a comprehensive research: you should carefully study all the available data, e.g. company's financials, related news, and its technical analysis. So MARKS & SPENCER GROUP technincal analysis shows the buy rating today, and its 1 week rating is buy. Since market conditions are prone to changes, it's worth looking a bit further into the future — according to the 1 month rating MARKS & SPENCER GROUP stock shows the buy signal. See more of MARKS & SPENCER GROUP technicals for a more comprehensive analysis.
If you're still not sure, try looking for inspiration in our curated watchlists.
If you're still not sure, try looking for inspiration in our curated watchlists.