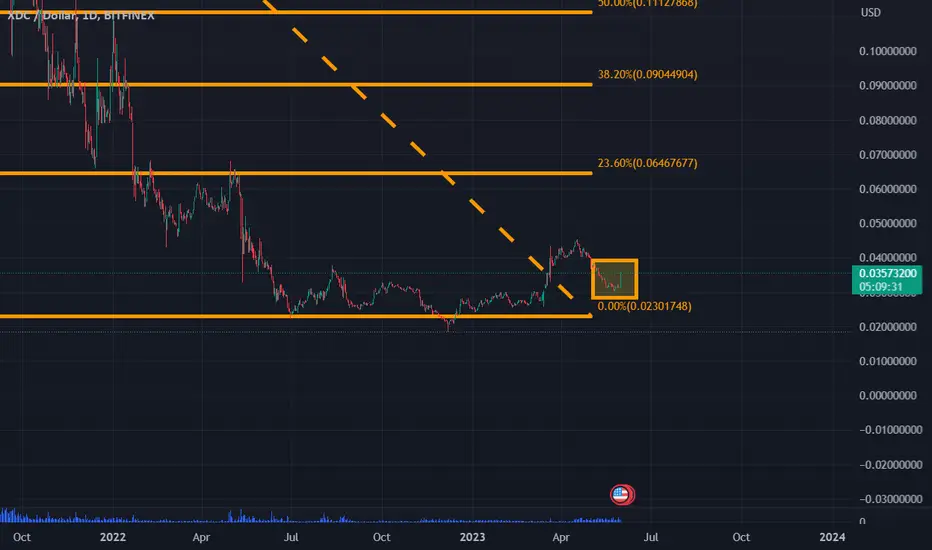
XDC Network (XDC)XDC Network chart is simple: a huge impulse wave followed by a corrective wave that ended at the 0.382 Fib level. Then, XDC broke the downtrend line, and an upward move started. Let's see how high XDC can go.
XDCUSD trade ideas


XDC at a Critical Juncture: Will It Crash or Soar? XDC Network is currently forming a descending triangle pattern, raising alarms for a potential price drop.
The price trend is consistently showing lower highs, indicating a weakening bullish momentum.
Key support is being tested at the 200-day EMA, a decisive point for XDC's future direction.
A break below this crucial level could see XDC plummet to around $0.043, marking a significant downtrend.
The market's slow response is adding to the uncertainty, as buyers seem hesitant to step in.
A death cross looms if XDC fails to maintain above the 200-day EMA, a bearish signal for traders.
On the flip side, a bullish reversal from this point could propel XDC to as high as $0.53.
This critical phase makes buying XDC a high-risk move, requiring careful consideration from traders.
The current market dynamics and technical indicators suggest a precarious situation for XDC.
Investors and traders are closely watching the 200-day EMA level for clues on XDC's next big move.
The outcome of this pattern will be crucial for XDC's trajectory in the coming weeks.


XDC At the end of a roadXDC Has momentum indicators turning green, it has a long bullish pattern formation almost complete, and a new upgrade coming soon with ISO20022 implementation worldwide.

Nice Cup and Handle on XDCXDC has a nice cup and handle that has formed. A break above 7.5 cents would confirm and a run to $1+ could be in the cards for 2024. This next bullrun will be swift and fast. Just my opinion, not financial advice. Thank you.

XDC Xinfin IS ABOUT TO RIP TO THE UPSIDEXDC Xinfin has been in this falling wedge bull flag pattern for a while and it broke out and is now holding above it. The RSI and the Stoch RSI is getting a fresh curl to the upside. I believe XDC is about to explode. I would say about $.06 then a correction and continuation to the upside after that. I believe XDC can get way past its all time high in this next run. If I take a measured move of the wedge/flag it would put XDC over a dollar. This is not financial advice this is just my opinion. Thank you

XDC monthly heiken ashiXDC on monthly. Used Heiken Ashi candles to clear up the trading noise. Conservative trend lines show $1 at end of year. Used Pivots to show resistance and support.

XDCUSD: Get ready for this signal.XDCUSD is neutral on the 1D timeframe (RSI = 51.811, MACD = -0.002, ADX = 40.140) with the price consolidating insde the 1D MA50 and the 0.0500 Support. In accordance to the two prior consolidation into recovery waves of this Fibonacci Channel, the next crossing over the 1D MA50, will be a buy signal.
The 1D MACD pattern is a lot like the bottom formations of February and June. Be ready to buy that breakout and target R1 (TP = 0.09350).
## If you like our free content follow our profile to get more daily ideas. ##
## Comments and likes are greatly appreciated. ##

XDCUSD Near the best buy signal provided by the MACD.The XDC Network (XDCUSD) is having a strong 1D green candle breaking again above the 1D MA50 (blue trend-line) after holding the 1W MA100 (yellow trend-line). The trend is more effectively displayed by the Fibonacci Channel where it appears that every Higher High is +0.5 Fib more than the previous.
If the 1D LMACD forms a Bullish Cross (which is close to completing), it will be the best buy entry on a 3 month basis. In that case we will buy and target 0.14000, which is within the 1.5 and 2.0 Fibonacci extensions.
-------------------------------------------------------------------------------
** Please LIKE 👍, FOLLOW ✅, SHARE 🙌 and COMMENT ✍ if you enjoy this idea! Also share your ideas and charts in the comments section below! **
-------------------------------------------------------------------------------
💸💸💸💸💸💸
👇 👇 👇 👇 👇 👇

XDC following XRP on fibs.XDC is forming a nice bearish head and shoulders to re test the 236 fib level. In the short term, I think it re-tests .06 then blast off. Watch XRP though, because it seems to be following it closely. XRP did not hold the 236 fib, so it will be interesting to watch XDC in the next few days.
I have a buy order placed at .06 I feel confident there. If it breaks down, I am not too worried about this project in the long term.

XDC has major momentum and this trend could continueXDC has major momentum and this trend looks very bullish with many catalysts coming for cryptocurrency

XDC to $10 USD by 2025?Here is my simple and humble analysis ( not financial advice ) that watches the potential of XDC. Possibly reaching the 10 USD levels by ~ 2025 or around that.

XDCUSD Strong bullish break out signalXDCUSD is having an excellent two week bullish streak as after last week's candle that crossed over the MA100 (1w), this week the price is attempting to close over it.
It also crossed above the Channel Up and we need the Fibonacci Channel levels to determine the next High.
Trading Plan:
1. Buy on the current market price.
Targets:
1. 0.0800 (Fibonacci 1.5 extension).
Tips:
1. The next target after a strong pull back will the the All Time Falling Resistance. Above that, XDC will aim at a new All Time High.
Please like, follow and comment!!

✴️ XDC Network 1,2,3,4 Steps Pattern Leads To 95% JumpWe've been looking at this pattern since early June, believe or not. I will be sharing some examples in the 'Related Ideas' at the bottom of this post.
The entire Cryptocurrency market, Bitcoin + Altcoins, is undergoing a 1,2,3,4 Steps Pattern.
The market is now at #4, which is a new bullish wave.
Let's recap real quick:
#1 | The initial bullish breakout early 2023.
#2 & #3 | The correction.
#4 | A new bullish wave.
This is all you need to know.
What one does, the rest follows.
XDC Network is clearly undergoing #4.
This should continue producing higher highs and higher lows.
The rest of the market, many are at #3 while a few already entering the new bullish wave.
Bitcoin also went through this pattern... Solana as well, even the TOTAL index chart.
See the examples below... Remember to boost and comment.
Namaste.

C & H on XinFin (XDC)Cup and handle pattern on the long term chart of KUCOIN:XDCUSDT XDCUSD.
Fib levels show a 2025 cycle top price target of at least $0.75 (25x from today's price of $0.035).
If fib level 2.272 is hit, that would put the price of XDCUSD by the end of 2025 at around $3 to $4 (100x from today's price).
Disclaimer: Keep in mind that market predictions are about as reliable as a weather forecast in outer space. Use this analysis as a conversation starter, not as financial advice. Investing in cryptocurrencies carries risks, so do your homework and make informed decisions. Remember, no crystal balls here—just a pinch of insight and a dash of caution

XDCUSD About to break above the 1D MA50. Bullish.The XinFin Network (XDCUSD) is on a noticable rise today after it held the previous days and rebounded on both the 1W MA50 (red trend-line) and 1D MA200 (orange trend-line). The Fibonacci Channel levels gives us a better understanding of the Support and Resistance levels involved during this uptrend since the December 07 2022 market bottom.
If the price closes a 1D candle above the 1D MA50 (blue trend-line) we may see a rally similar to mid March - April, since the MACD has just completed a Bullish Cross, the first since March 13. In that case, we will take this bullish break-out signal and target more comfortably first Resistance 1 (0.04545) and then the 2.0 Fibonacci extension and 1W MA100 (yellow trend-line) cluster at 0.05200.
-------------------------------------------------------------------------------
** Please LIKE 👍, FOLLOW ✅, SHARE 🙌 and COMMENT ✍ if you enjoy this idea! Also share your ideas and charts in the comments section below! **
-------------------------------------------------------------------------------
💸💸💸💸💸💸
👇 👇 👇 👇 👇 👇

XDC XinFin Networknetwork is only as good as those who use it and nobody is using this, perhaps thatll chnge

XDC Long Idea Spot long XDC to around 0.10c-0.11c, With a potential reversal from that area to look to go short.


XDC - LONGShort-term LONG
XDC could have a 90% move to the upside towards $0.05-0.06 before we see a continuation to the downside.

Xinfin #XDC Network updateThe XDC Network (formerly called XinFin Network) is an enterprise-grade, EVM-compatible blockchain equipped with interoperable smart contracts.
