GOLD → Countertrend correction, retest of 3345 before growthFX:XAUUSD , undergoing a deep correction after a false breakout of local resistance at 3433, has reached the support of the upward trend. Will the bulls be able to maintain the trend?
Gold held below $3,400 on Friday, rebounding from $3,350, and is poised to end the week higher. Investors are watching the conflict between Thailand and Cambodia, which is boosting demand for safe-haven assets, and are also awaiting decisions from the Fed and the Bank of Japan next week. The markets received additional support from US trade deals with Asian countries and progress in negotiations with the EU, easing fears of a tariff war.
As part of the correction, gold is testing trend support and the 3345-3337 zone of interest. A false breakdown, lack of downward momentum, and bulls holding prices above 3345 could trigger growth and a continuation of the main upward trend.
Resistance levels: 3375, 3383
Support levels: 3345, 3337, 3330
Technically, the support level of 3345 plays a fairly important role in the market. If, during the correction, the bulls manage to hold their ground above this zone, the prospects for recovery will be high, especially against the backdrop of geopolitical problems.
Best regards, R. Linda!
Chart Patterns

AUD/USD - Breakout (25.07.2025)The AUD/USD Pair on the M30 timeframe presents a Potential Selling Opportunity due to a recent Formation of a Trendline Pattern. This suggests a shift in momentum towards the downside in the coming hours.
Possible Short Trade:
Entry: Consider Entering A Short Position around Trendline Of The Pattern.
Target Levels:
1st Support – 0.6551
2nd Support – 0.6513
🎁 Please hit the like button and
🎁 Leave a comment to support for My Post !
Your likes and comments are incredibly motivating and will encourage me to share more analysis with you.
Best Regards, KABHI_TA_TRADING
Thank you.
Disclosure: I am part of Trade Nation's Influencer program and receive a monthly fee for using their TradingView charts in my analysis.

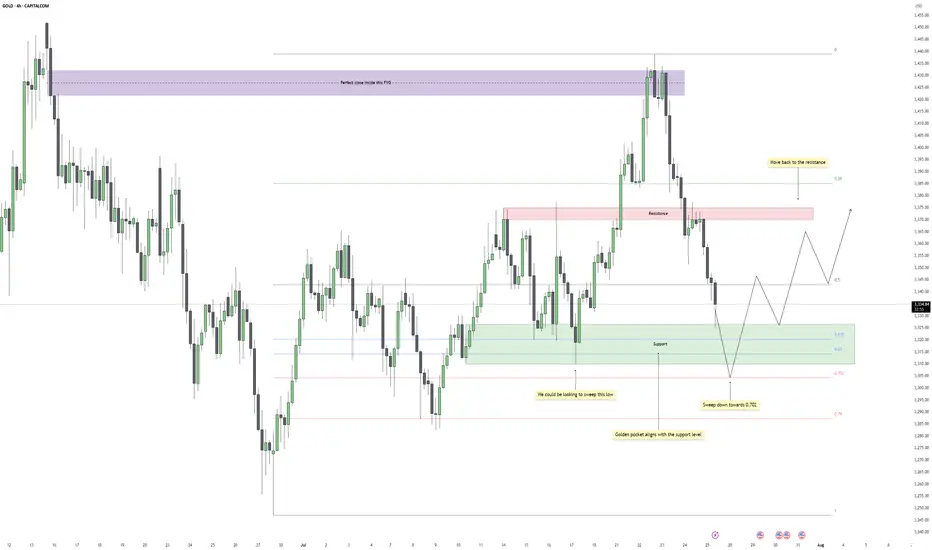
Gold - Eyes on the Final Flush Before ReclaimGold recently dropped after reacting perfectly inside a higher time frame fair value gap. That zone acted as clean supply, offering a precise close within the imbalance and initiating a strong bearish leg. The move confirmed that buyers were overwhelmed at that level, and price began its descent back into a broader consolidation range.
Support Cluster and Fibonacci Alignment
The current zone being tested holds significant weight. Price has tapped into a clear support region, one that has already caused multiple strong bounces in recent sessions. What adds further confluence is the alignment of this zone with the golden pocket region of the entire upward leg. This kind of technical overlap increases the chances of responsive buying once liquidity is cleared below.
Liquidity Target and Inducement Setup
Just below current price action, there's a clean low that hasn't been taken out yet. This low acts as the inducement, sitting right above deeper Fibonacci levels, especially the 0.702. If price continues lower in the short term, a sweep of that low into the golden pocket would provide the ideal liquidity grab before a reversal. The market often rewards those who wait for that final flush.
Bullish Recovery Path
Once the liquidity is taken and price stabilizes at the golden pocket zone, the path is open for a recovery move back into the midrange and potentially higher. The most likely magnet for price after a successful bounce would be the previous resistance zone, which coincides with the 0.5 retracement of the recent drop. That area should act as the next decision point and could either cap the rally or provide the base for a continuation if buyers show strength.
What I’m Watching
The cleanest scenario would be a sweep of the low just below support, ideally pushing into the lower green box near the 0.702 level, followed by a strong bullish reaction. I’ll be watching for a market structure shift on the lower timeframes at that point to confirm the entry. If that happens, the trade has room to develop back into the prior resistance zone, offering a solid range for intraday or swing setups.
Conclusion
Gold remains in a broader range for now, but the technicals suggest one more drop to clear late long positions before a recovery. The reaction at the support cluster will be crucial. If bulls step in after the sweep, there’s a high-probability path back toward resistance, with the move likely supported by the golden pocket confluence.
___________________________________
Thanks for your support!
If you found this idea helpful or learned something new, drop a like 👍 and leave a comment, I’d love to hear your thoughts! 🚀
GBP/CAD - H4 - Bearish Flag (26.07.2025)The GBP/CAD Pair on the H4 timeframe presents a Potential Selling Opportunity due to a recent Formation of a Bearish Flag Pattern. This suggests a shift in momentum towards the downside in the coming Days.
Possible Short Trade:
Entry: Consider Entering A Short Position around Trendline Of The Pattern.
Target Levels:
1st Support – 1.8242
2nd Support – 1.8139
🎁 Please hit the like button and
🎁 Leave a comment to support for My Post !
Your likes and comments are incredibly motivating and will encourage me to share more analysis with you.
Best Regards, KABHI_TA_TRADING
Thank you.
Disclosure: I am part of Trade Nation's Influencer program and receive a monthly fee for using their TradingView charts in my analysis.

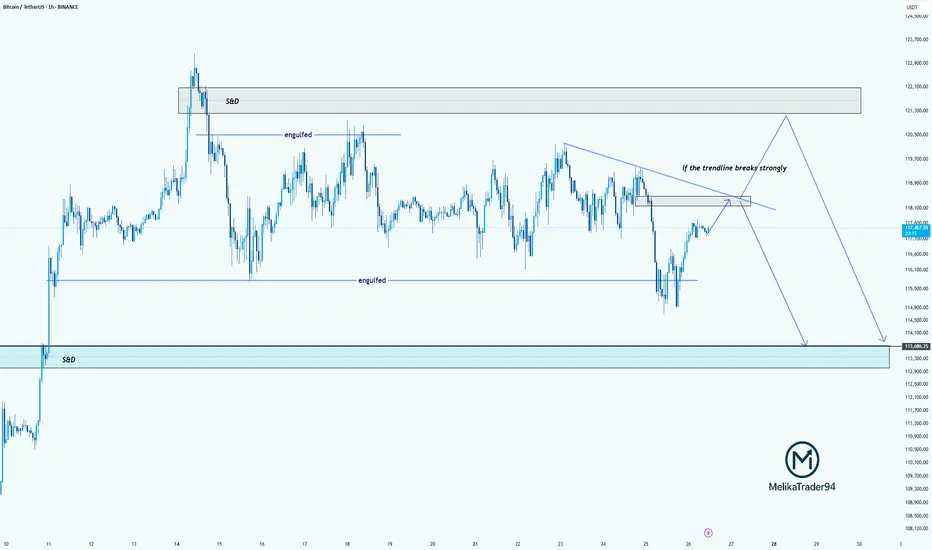
TC Analysis – Watching That Trendline Closely!Hello guys!
Bitcoin is currently approaching a key decision point. As highlighted on the chart, we’ve got a descending trendline acting as strong resistance. If this trendline breaks with strength, we may see price push up into the supply & demand zone around 121,000–122,000 before potentially reversing.
However, if the trendline holds, this current move could be a retest, setting up for another drop. The engulfed level at 114,000 has already been tested once, and if we break below that again, the price could slide down into the S&D demand zone around 113,000–112,000.
summry:
Trendline resistance is critical right now
Watch for a strong breakout or a fakeout & rejection
Possible bearish continuation if we fail to reclaim above 118,500
Let’s see how BTC reacts around this zone.
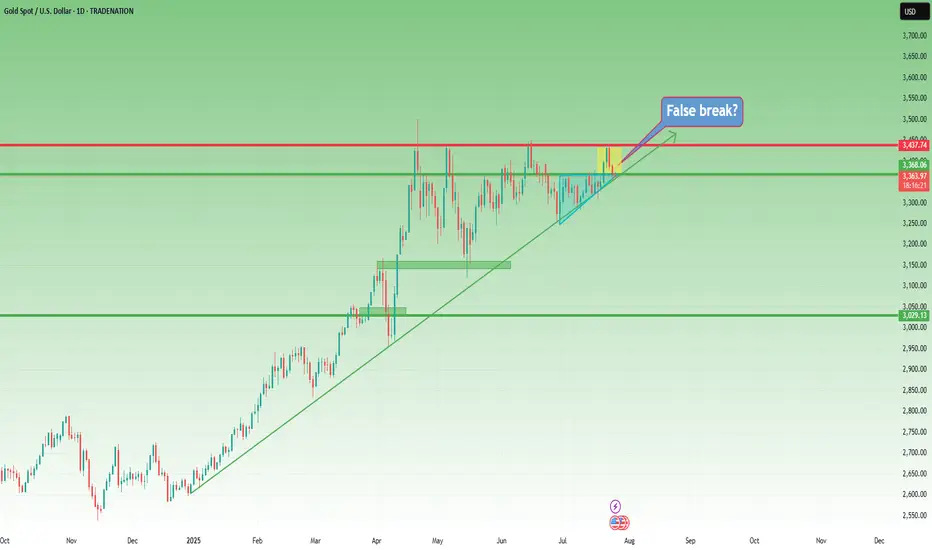
XAUUSD – The Structure Is Still Bullish... But Barely Holding 📌 In yesterday’s analysis, I mentioned that although Gold corrected deeper than expected, dropping below 3400, the bullish structure remained intact — and I stayed true to that view by buying dips.
🎯 The trade didn’t go as planned. Fortunately, the New York rebound from 3350 helped me exit at breakeven.
🧭 So now the big question is:
Is Gold reversing to the downside?
The answer: Not confirmed yet.
The structure is technically still bullish, but the chart is far from pretty.
🧨 What’s going wrong?
❌ Bearish engulfing candle on Wednesday – I chose to ignore it yesterday, but it’s still there.
❌ The breakout above 3375 (ascending triangle resistance) is failing – and could now turn into a false breakout trap.
❌ The ascending trendline from January 2025 is under pressure.
❌ And if today we close near 3350, the weekly chart will show a bearish Pin Bar – not exactly a sign of strength.
📉 My current plan:
- If price rallies back above 3380 → I’m looking to sell into strength, not buy.
- If we break below 3350 → I’ll also look to sell the breakdown.
Right now, for Gold to regain bullish momentum, it needs to reclaim 3400. No compromise.
⚠️ Summary:
Yes, the bigger structure is still bullish.
But momentum is fading, and price action is starting to turn against the bulls.
We need confirmation, not hope.
If 3350 breaks cleanly – things could accelerate to the downside.
Disclosure: I am part of TradeNation's Influencer program and receive a monthly fee for using their TradingView charts in my analyses and educational articles.
BITCOIN → Correction within a downward channel. 112K or 125K?BINANCE:BTCUSDT is consolidating. However, a local downward trading range is forming relative to the current setup. What is the probability of a correction continuing to 112K or growth to 125K?
Daily structure: a local correctional channel within a global bullish trend. We have cascading resistance at 119.2, 119.6, 120, and 120.8. It will be quite difficult to break through this zone on the first attempt, but MM can use it to form traps and collect liquidity.
At the bottom, everything is simpler — a breakdown of the local bullish structure, the formation of an intermediate minimum, below which there is a void down to 112K.
Yesterday, relative to 115-116K, mm staged a massacre (trap) on both sides of the market.
Liquidity collection, return to the range, and growth. The reaction to the false breakdown of support is quite strong. Since the opening of the session, Bitcoin has been heading towards resistance, but there may not be enough potential to break through the upper resistance conglomerate, so I expect to see a pullback or decline to 116-115-114.
Resistance levels: 119.2, 120.1, 120.85
Support levels: 116.37, 115.67, 112
Technically and fundamentally, I do not see any drivers that could support the market (I am talking about Bitcoin, since the driver for altcoins is the decline in Bitcoin's dominance). It is possible that this may appear later. In the current situation, I am considering a false breakout and correction, as the market has not yet finished consolidating or correcting, and the current downward trading range may be extended.
PS: As the price moves towards resistance, it is necessary to monitor the reaction. The market itself will show what it is preparing for...
Best regards, R. Linda!

NZDCHF – Bullish Breakout Sets Stage for ReversalNZDCHF has broken decisively out of a long-term descending channel, signaling a potential trend reversal. Price action confirmed multiple bullish flags within the falling structure, followed by a clean breakout and higher low retest, supporting a bullish continuation bias.
Currently, the pair is stabilizing just above prior resistance turned support around 0.4760–0.4780, forming a potential launchpad for the next leg higher.
Upside Targets:
TP1: 0.48336
TP2: 0.48844
TP3: 0.49319
Invalidation Zone:
A drop below 0.4720 would invalidate the breakout structure and expose the downside.
Fundamental Drivers:
🇳🇿 NZD Strength: RBNZ remains relatively hawkish compared to other central banks, and the Kiwi may gain from improving risk sentiment and easing global recession fears.
🇨🇭 CHF Weakness: Swiss Franc is under mild pressure as safe-haven flows weaken amid improving tone on US-China-EU trade headlines and fading ECB rate cut bets.
🗓️ Macro Flow: Upcoming risk events (Fed comments, trade updates, and NZ economic prints) could inject momentum into the pair, especially if risk appetite improves.
Bias: ✅ Bullish (Buy)
Confidence: ★★★★☆
Watch for: Clean hold above 0.4770 zone + bullish momentum continuation.

ARKK: The Calm Before the Innovation Storm -ALTSEASON Is COMING🚀 ARKK: The Calm Before the Innovation Storm 🌪️
The markets are shifting, and disruption is about to go vertical. ARK Innovation ETF (ARKK) is quietly positioning itself for what could be the most explosive move of this decade. With high-conviction bets in AI, Bitcoin, genomics, and next-gen tech, this isn’t just a fund—it’s a launchpad for exponential growth.
This post breaks down exactly why ARKK could go parabolic—and why the smart money is already moving in. 👇
Explosive upside in 2026
ARKK is already up over 24% YTD , showing strong momentum compared to broader markets and signaling early stages of a potential parabolic move .
High-conviction concentration in game-changers
Top 10 holdings include Tesla, Roku, Zoom, Coinbase, UiPath, Block, Crispr Therapeutics, DraftKings, Shopify, and Exact Sciences. These are leaders in innovation sectors with massive upside potential .
Deep exposure to Bitcoin and digital assets
Heavy allocation to Coinbase and Block gives indirect exposure to Bitcoin . If BTC breaks into a new cycle high , ARKK stands to benefit significantly.
Positioned in exponential growth sectors
Focus on AI, genomics, EVs, fintech, robotics, and blockchain , all of which are entering accelerating adoption phases globally.
Aggressive smart-money accumulation
Cathie Wood’s team continues buying aggressively during dips, reinforcing institutional confidence in the fund’s long-term trajectory.
Technical breakout structures forming
Ascending triangle and multi-month consolidation breakouts suggest a technical setup primed for explosive upside .
Innovation supercycle aligning
ARKK's themes are aligned with major global shifts like de-dollarization, decentralized finance, and AI convergence .
High beta = massive upside leverage
With a beta above 2 , ARKK tends to outperform in bull runs , offering leveraged exposure to innovation without the need for margin.
Resurgence of top holdings
Names like Coinbase, Tesla, Shopify, and Roku are up 50%–100% YTD , driving ARKK’s NAV growth and fueling bullish sentiment .
Long-term vision with short-term catalysts
The fund projects 5x returns over the next five years , while Bitcoin halving cycles, tech innovation, and regulatory clarity serve as short-term ignition points .
Marty Boots | 17-Year Trader — smash that 👍👍, hit LIKE & SUBSCRIBE, and share your views in the comments below so we can make better trades & grow together!

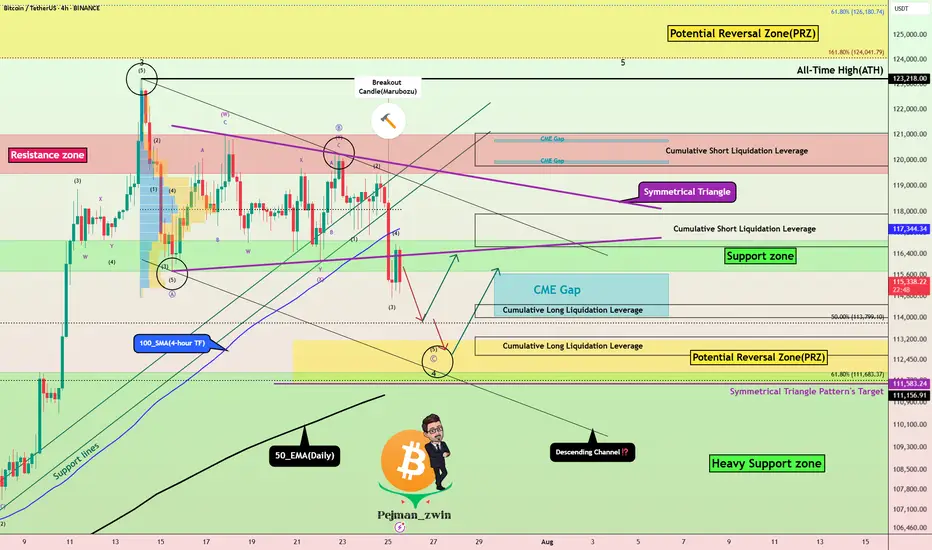
Bitcoin Correction Maturing – Long Setup Brewing!Bitcoin ( BINANCE:BTCUSDT ) has fallen by more than -4% over the past day.
Let's take a look at the reasons for the decline.
One of the key reasons behind Bitcoin’s decline in the past 24 hours ( July 25 ) could be the reduced likelihood of Jerome Powell being replaced as Chair of the Federal Reserve.
In recent days, market participants were speculating that Donald Trump might replace Powell — a scenario that was considered bullish for risk assets like Bitcoin. However, recent reports of a meeting between Trump and Powell, and signs that Powell might not be dismissed, have weakened this fundamental narrative.
This meeting may signal a truce or reduced tension between Trump’s team and Powell , which could imply a continuation of current Fed policies. That’s bad news for Bitcoin, as it removes a potential psychological tailwind from the market and dampens speculative sentiment.
As a result:
Over $500 million in liquidations(Long Positions) occurred
Weak inflows into Bitcoin ETFs
A stronger U.S. Dollar Index ( TVC:DXY )
And declining Gold( OANDA:XAUUSD ) prices over the past two days
all added additional selling pressure on BTC. Now let's take a look at Bitcoin's conditions on the 4-hour time frame .
Bitcoin currently appears to have broken the Support zone($116,900-$115,730) , Support lines , 100_SMA(4-hour TF) , and the lower line of the Symmetrical Triangle Pattern with a bearish Marubozu candle .
Note : In general, trading was difficult when Bitcoin was inside a symmetrical triangle (about 10 days).
It also seems that the pullback to these zones has ended and Bitcoin is waiting for the next decline .
In terms of Elliott Wave theory , Bitcoin appears to be completing microwave 5 of microwave C of major wave 4 . There is a possibility that main wave 4 will create a descending channel and complete at the bottom of the descending channel (at Potential Reversal Zone(PRZ) ).
I expect Bitcoin to start rising again after completing the CME Gap($115,060-$114,947) from Cumulative Long Liquidation Leverage($114,480-$114,000) or Cumulative Long Liquidation Leverage($113,284-$112,603) near the PRZ and Heavy Support zone($111,980-$105,820) .
Cumulative Short Liquidation Leverage: $117,904-$116,665
Cumulative Short Liquidation Leverage: $121,046-$119,761
Do you think Bitcoin has entered a major correction, or does it still have a chance to create a new ATH?
Please respect each other's ideas and express them politely if you agree or disagree.
Bitcoin Analyze (BTCUSDT), 4-hour time frame.
Be sure to follow the updated ideas.
Do not forget to put a Stop loss for your positions (For every position you want to open).
Please follow your strategy and updates; this is just my Idea, and I will gladly see your ideas in this post.
Please do not forget the ✅' like '✅ button 🙏😊 & Share it with your friends; thanks, and Trade safe.
The End of the Altcoins Bull Market? BTC.D Turns Bullish?Bitcoin Dominance produced a bullish trend that was more than 1,000 days long. While this was a major development, the action never happened just straight up. There were always fluctuations.
Bitcoin Dominance broke out of a major rising wedge pattern. A pattern that lasted years in the making.
Recently, Bitcoin Dominance produced the highest bearish volume since 2021. A strong chart signal.
The major breakdown following the multiple years long uptrend signals the start of a change of trend. A downtrend. This downtrend is extremely bullish for the altcoins market because BTC.D only goes down when the altcoins are going up and doing so faster than Bitcoin.
What we are seeing now is an inverted correction, a pullback. Simply put, BTC.D already made a strong drop and it needs some relief. This relief is not the end. Bitcoin Dominance can move just a little higher to later resume its newly developing downtrend. Which means that the altcoins market bull market has not reached its end, it is only getting started.
Thank you for reading.
Namaste.

Gold Recovery Setup = Divergence + Support ClusterGold ( OANDA:XAUUSD ) fell to the lower line of the ascending channel and the Support zone($3,350-$3,326) , as I expected in my previous idea .
Gold is currently near a set of Supports .
Supports:
Support zone: $3,350-$3,326
Monthly Pivot Point: $3,333
Potential Reversal Zone(PRZ): $3,339-$3,329
Lower line of the ascending Channel
50_EMA(Daily)
Support lines
In terms of Elliott Wave theory , Gold appears to be completing a bearish wave 5 .
Also, we can see the Regular Divergence(RD+) between Consecutive Valleys .
I expect Gold to rise to at least $3,359 .
Second target: $3,367
Note: Stop Loss (SL) = $3,319
Do you think Gold can break the Support cluster by the end of trading hours?
Gold Analyze (XAUUSD), 1-hour time frame.
Be sure to follow the updated ideas.
Do not forget to put a Stop loss for your positions (For every position you want to open).
Please follow your strategy; this is just my idea, and I will gladly see your ideas in this post.
Please do not forget the ✅ ' like ' ✅ button 🙏😊 & Share it with your friends; thanks, and Trade safe.

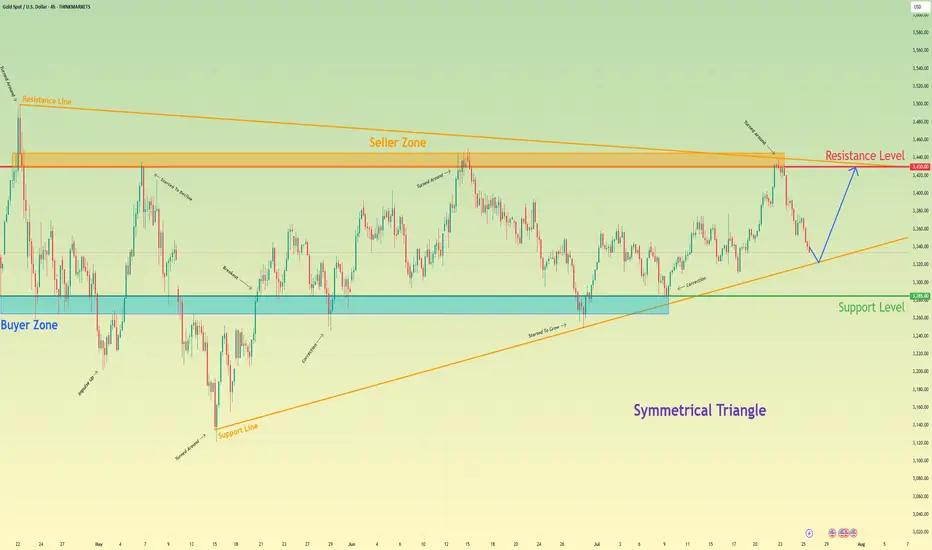
Gold will rebound from support line of triangle and rise to 3430Hello traders, I want share with you my opinion about Gold. Following a sequence of significant upward trends and the subsequent downward corrections that defined its range, gold has entered a broad market zone of consolidation. This battleground is clearly anchored by the historically significant buyer zone around 3285 and a formidable seller zone near 3430. Currently, the asset's price action is coiling and contracting within the confines of a large symmetrical triangle, a classic pattern that signifies a period of equilibrium and energy build-up before a potential high-volatility breakout. After a recent upward rebound was decisively rejected by the upper resistance line, the price is now in a corrective descent, heading towards the crucial ascending support line of the triangle. The primary working hypothesis is a long scenario, which is based on the expectation that this downward move will find strong buying interest on this key trendline, respecting the pattern's integrity. A confirmed and strong bounce from this level would signal another complete upward rotation within the triangle is underway. Therefore, the tp is logically and strategically set at the 3430 resistance level, as it not only aligns with the formation's upper boundary but also represents the major seller zone, a natural magnet for price on such a rebound. Please share this idea with your friends and click Boost 🚀
Disclaimer: As part of ThinkMarkets’ Influencer Program, I am sponsored to share and publish their charts in my analysis.
The Pullback Panic? Your Whole Plan Dies?!!!!!One red candle is all it takes to destroy your entire plan.
Why do we panic so fast? Why do we exit too early before a rally?
And worse: why do we FOMO back in at the worst possible time?
Hello✌️
Spend 3 minutes ⏰ reading this educational material.
🎯 Analytical Insight on Dogecoin:
BINANCE:DOGEUSDT is approaching the key psychological level of 0.20, which also aligns with a strong daily support and the final Fibonacci retracement zone 🧭. Despite recent volatility, it continues to hold its mid-range Fib level, suggesting potential accumulation. If this support holds, a rebound toward the 0.30 resistance — a move of around 27% remains on the table 🎯.
Now , let's dive into the educational section,
🧠 The Victim Mindset in Crypto Markets
Here’s the uncomfortable truth.
Most traders believe they’re making rational decisions but in reality, they’re reacting emotionally to past pain.
One bad experience during a correction makes us fear all pullbacks.
Missing one big rally creates constant FOMO.
We can’t handle drawdowns but we accept buying tops again and again.
It’s not just you. This is how most retail traders operate and whales know it.
🐳 How Whales Profit From Our Fear
Whales never buy during hype. They buy during fear.
Mini pullbacks, shakeouts and false breakdowns are designed for one thing.
To make you exit so they can enter.
A red candle, a small wick, maybe a fake support break.
We sell out of fear, they buy the dip.
We FOMO back in too late.
Pullbacks are not just price moves. They are psychological traps.
📈 How to Break This Cycle
You don’t need to predict the future. You need to understand yourself.
Ask if this correction is technical or emotional.
Use confirmation from volume, OI and divergence.
Enter after traps, not inside them.
Question your feelings before every move.
You are not trading the chart. You’re trading your mind reacting to the chart.
📊 TradingView Tools to Escape the Fear Greed Cycle
TradingView gives you access to several practical indicators that can help protect your capital from emotional decision-making.
🔹 Fear and Greed Index (Crypto)
Simple but powerful. When the index drops below 30, most traders are in panic mode. That is exactly where whales accumulate, while we run away.
🔹 Open Interest Heatmaps
When open interest rises but price stays flat, it often signals an upcoming shakeout. One scary-looking red candle and the weak hands are gone.
🔹 Volume Profile and VPVR
Perfect for distinguishing between healthy corrections and manipulative dumps. If price pulls back but buying volume remains strong, it's not a real sell-off. It’s a trap.
🔹 Divergence Indicators like MACD or RSI
If RSI rises during a pullback, there’s a hidden bullish divergence. Exiting may be the worst thing to do.
🔹 Liquidity Maps
These show where stop losses and liquidation clusters are located. Often before any major move up, the market takes a detour to liquidate these levels.
Use these tools to stop reacting emotionally and start trading rationally.
📍 Final Thoughts
Small corrections are not the enemy.
Your emotional reaction to them is the real threat.
Before you panic-exit, ask yourself if this fear is justified or just mental conditioning.
The market always gives second chances but we rarely wait for them.
✨ Need a little love!
We pour love into every post your support keeps us inspired! 💛 Don’t be shy, we’d love to hear from you on comments. Big thanks , Mad Whale 🐋
📜Please make sure to do your own research before investing, and review the disclaimer provided at the end of each post.

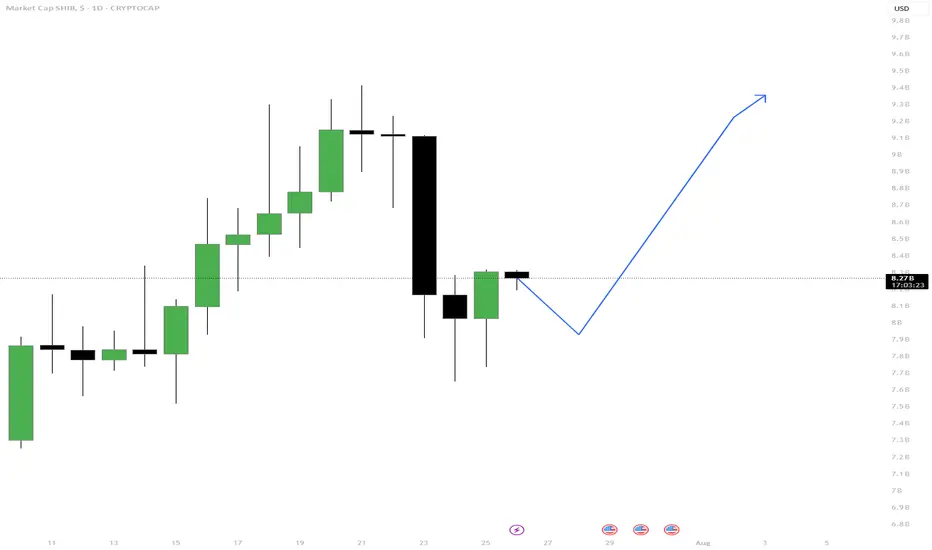
SHIB Market Cap – Dip Before the Rip?Hey Traders!
🧠 Idea: After a strong bounce from recent lows, SHIB’s market cap is showing signs of consolidation. A minor dip could come first, but if support holds, the next move may be a solid push upward.
📌 Tip of the Day:
Smart pullbacks often precede significant breakouts. Be patient and let the structure play out.
🔍 Why This Setup Makes Sense:
🔻 Big drop followed by recovery: Indicates buyers are stepping in.
💚 Strong support at 7.65B zone (wick rejection) shows buying interest.
📉 Short dip expected to shake out weak hands before possible rally.
🔼 Break above 8.4B–8.5B could trigger a continuation pump.
✅ Rules to Follow:
Don’t chase the green; wait for confirmation after any dip.
Key support to hold: 7.65B
Key breakout zone: 8.4B–8.5B
Invalidation: If market cap loses 7.65B and fails to bounce, reassess the setup.
Remember: Whales often buy dips, not breakouts. Let price come to you.
Let me know what you guys think about this post, don't hesitate to ask questions, drop some comments, boost this post and follow for more updates.
-Neo
#SHIB #CryptoCap #Altcoins #TradingView #CryptoAnalysis #MarketUpdate #DipBuyers #PatienceWins
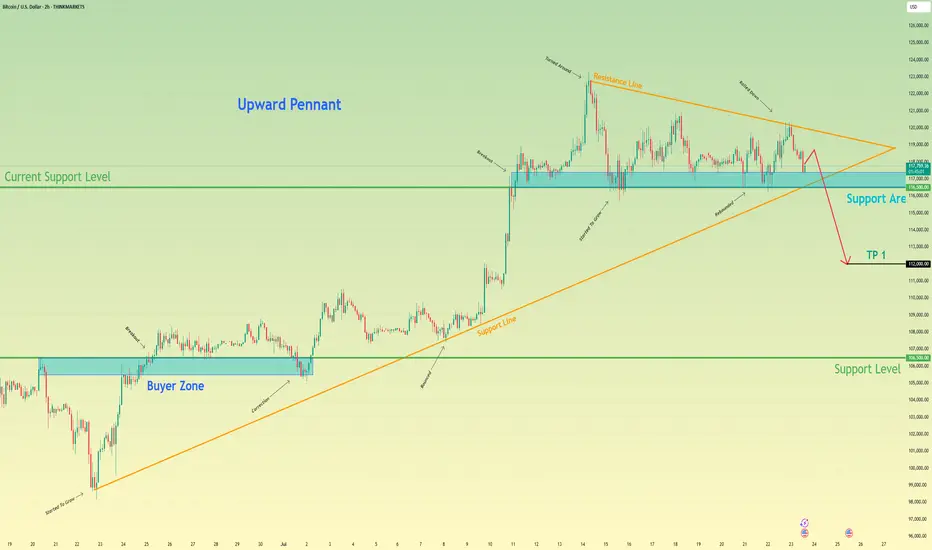
Bitcoin can start to decline and break support levelHello traders, I want share with you my opinion about Bitcoin. After completing a powerful upward impulse that originated from the buyer zone near 106500, the price action for BTC has transitioned into a corrective market phase. This consolidation has taken the form of an upward pennant, characterised by a narrowing trading range that suggests a significant directional move is forthcoming. Currently, the asset is undergoing a sequence of downward corrections within the pennant, exerting repeated pressure on the critical demand zone between 116500 and 117400. The importance of this zone is amplified by its confluence with the lower trend line of the formation itself. The primary working hypothesis is a bearish resolution, anticipating that persistent selling pressure will culminate in a decisive breakdown of this support. This event would act as a bearish breakout from the pennant, providing strong confirmation for the continuation of the downward impulsive momentum and shifting the local market structure. Therefore, the take-profit level is logically positioned at the 112000 mark. Please share this idea with your friends and click Boost 🚀
Disclaimer: As part of ThinkMarkets’ Influencer Program, I am sponsored to share and publish their charts in my analysis.
Gold Showing Signs of Reversal After Hitting Key ResistanceHello Guys.
Gold has reached a major resistance zone around 3439–3425, which has already acted as a strong ceiling in the past. The price tapped into this area again, forming a clear divergence, and failed to break higher.
Here’s what stands out:
Divergence signals a weakening bullish momentum at the top.
The price rejected the resistance and is now breaking structure to the downside.
A minor pullback may occur before continuation, as shown in the projected moves.
First target: 3259.792
Second target (if support breaks): 3136.869, a deeper zone for potential bounce or further drop.
This setup hints at a bearish trend building up. Stay cautious on longs unless the price structure changes again.


XAU/USD) bullish the support Read The captionSMC Trading point update
Technical analysis of (XAU/USD) on the 4-hour timeframe, indicating a potential bounce from a key trendline support within a rising channel.
---
Analysis Summary
Pair: XAU/USD (Gold Spot vs. USD)
Timeframe: 4H
Current Price: 3,338.715
Bias: Bullish rebound within ascending channel
---
Key Technical Elements
1. Ascending Channel:
Price has been respecting a well-defined rising channel, bouncing between support and resistance levels.
2. Key Support Zone:
The yellow highlighted area marks a critical support level and lower boundary of the channel.
Also intersects with the trendline, strengthening the potential for a bounce.
3. 200 EMA (Dynamic Support):
The 200 EMA at 3,343.616 lies just below current price, acting as a dynamic support level.
4. RSI (14):
RSI is around 34.93, nearing the oversold zone, suggesting a buying opportunity may be near.
---
Target Points
First Target: 3,402.099
Second Target: 3,446.661
---
Trade Idea
Direction Entry Zone Stop-Loss Target Zones
Buy 3,330–3,345 Below 3,320 3,402 / 3,446
Mr SMC Trading point
---
Summary
Gold is currently testing a key support level and ascending trendline. If price holds above this area, we can expect a bullish rebound toward 3,400–3,446 levels, aligning with the upper channel resistance.
Please support boost 🚀 this analysis)

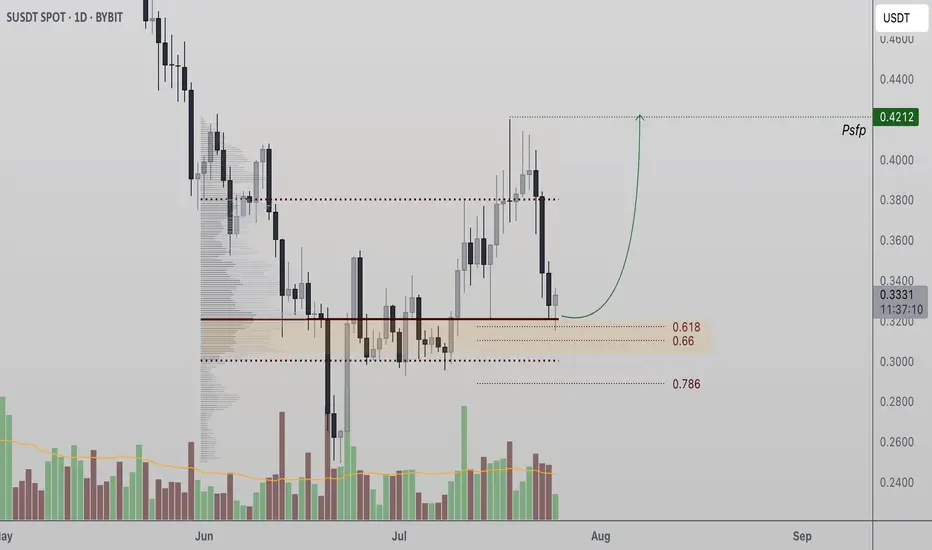
Sonic Token Tests Critical Support at Point of Control Sonic Token (S) is holding a major confluence support zone that could act as the foundation for a bullish reversal. A strong bounce here may lead to a retest of the $0.42 swing high.
Sonic Token (S) has corrected into a significant support region, aligning with both the Point of Control (POC) and the 0.618 Fibonacci retracement level. This confluence of technical factors marks a decisive zone where the current bullish structure could either confirm or break down. For bulls to remain in control, price must continue closing daily candles above this support in the coming sessions.
Key Technical Points:
- Key Support Zone: POC and 0.618 Fibonacci retracement form a strong support base
- Market Structure at Risk: Losing support would invalidate the current bullish structure
- Upside Target at $0.42: A reclaim of the swing high confirms continuation with a higher high
This level has become a make-or-break point for Sonic Token’s trend. From a structural perspective, holding this zone would confirm a higher low, preserving the uptrend and increasing the likelihood of a rotation toward the swing high at $0.42. Multiple high time frame indicators now intersect at this support region, making it a vital area for bulls to defend.
The volume profile supports this level’s importance, as historical price action shows significant accumulation and trade density in this range. So far, there are signs that support is holding — but what’s missing is a consistent pattern of daily candle closes above this level. Until that happens, any bounce should be viewed with cautious optimism rather than full confirmation.
If Sonic Token fails to maintain this level, the market risks entering a deeper corrective phase, potentially breaking below the bullish structure that’s been in place since the last major swing low. This would delay any retest of $0.42 and could invite further selling pressure.
On the other hand, if the token manages to hold the confluence zone and reclaim momentum, a move back toward $0.42 would not only retest the previous high but potentially trigger a breakout and continuation of the larger bullish trend. What’s needed now is clear evidence of strength, both in candle structure and volume support.
What to Expect in the Coming Price Action
Sonic Token needs to hold its current support zone on a daily close basis to maintain bullish structure. If it does, a rotation toward $0.42 is likely. A breakdown risks a deeper correction.
BITCOIN (BTCUSD): Recovery Starts
Bitcoin is going to rise from a key daily support.
After a liquidity grab, the market shows a clear strength,
forming a double bottom on an hourly time frame.
I expect a bullish movement at least to 117100
❤️Please, support my work with like, thank you!❤️
I am part of Trade Nation's Influencer program and receive a monthly fee for using their TradingView charts in my analysis.

GBPUSD → Retest of previously broken resistance...FX:GBPUSD has entered a correction phase after breaking through the local downtrend. If the price remains in the 1.3450–1.346 zone, this will confirm the formation of a new trading range...
The market is entering a correction phase due to the dollar. A countertrend retest of the support zone is forming. Earlier, the currency pair broke the local trend and is entering a flat phase. The retest of support may end with a recovery. If, within the local movement and after a false breakout of the 1.345 - 1.3467 zone, the bulls keep the price above the buying zone, then in the short and medium term, we can expect growth to continue.
Support levels: 1.3467, 1.345
Resistance levels: 1.35, 1.3584
A false breakdown of support at 1.3467 will confirm a change in the local trend (correction). The market may return to the recovery phase of the global trend.
Best regards, R. Linda!

