Bitcoin Double-Top: A Repeat Of 2021?Back in 2021, Bitcoin hit a major high in April. 210 days later a slight higher high, and a technical double-top, was hit in November.
The first high toward April 2021 was preceded by rising volume.
The second high toward November 2021 was preceded by decreasing volume.
In 2024, the first high reaching March was preceded by rising volume.
The second high toward October 2024 was preceded by decreasing volume.
➢ The November 2021 higher high/double-top ended in a major crash (the decreasing volume was a strong revealing signal).
➢ The October 2024 lower/higher high/double-top has very low volume and also very, very low market participation, only whales are playing right now (no retail).
Will the second high of 2024 lead to a major crash?
This is a high probability scenario.
Bearish at resistance.
Bullish at support.
Q: What is the difference between December/November 2022 and October/November 2024?
A: The price... One was a bottom and the latter is a top.
Patience is key.
Thanks a lot for your continued support.
Namaste.
Community ideas

Bitcoin will trap everyone! 78k then 20% crash! (must see)Bitcoin is currently very bullish; that's clearly visible and soon will hit a new all time high. That's exactly the point where a lot of people will start buying with the belief of going to 100k - 130k. But you may know that Bitcoin is under extreme manipulation by BlackRock and other institutions. This is not a stock market, so they will not let Bitcoin go up, and instead they will trigger a massive crash back to 63k. Nobody likes Blackrock, but it's how it is.
So what is the plan? First, I expect Bitcoin to go up and reach 78k. Then, when everyone buys, the price will crash to 63k. Do not forget that we also need to see a successful retest of the bullish flag. There is no retest yet. Bitcoin needs to confirm this uptrend, so do not FOMO in. I have been bullish since 60k or so, and I predicted the majority of Bitcoin movements in past months.
Why is 63k important? We have a 200 daily moving average and FVG (Fair Value GAP) around this level. Also, the RSI indicator is starting to be overbought; you want to buy low when everyone is bearish.
Write a comment with your altcoin, and I will make an analysis for you in response. Also, please hit boost and follow for more ideas. Trading is not hard if you have a good coach! This is not a trade setup, as there is no stop-loss or profit target. I share my trades privately. Thank you, and I wish you successful trades!

GOLD 4H CHART MARKET UPDATEHey Everyone,
Another great day on the chart for us today with price rejection on the final range after hitting all our targets. As shared yesterday we don't like chasing targets all the way to the top on a new range and safer to buy dips and that's what we have been doing,
Today once again we were able to use our 1H chart levels to buy 30 to 40 pip dips from our strategic levels even against todays trend. That's the power of our chart setups!!
We now have a gap left on the top of the range and seeing price reject into the 4H chart retracement range. We expect a reaction here for a bounce or a cross and lock below this range will see the swing range.
We are now also seeing price back in the range on both 1H and 4H chart and therefore the levels and our cross and lock weighted levels are active once again, for us to track and trade the movement.
We will keep the above in mind when taking buys from dips. Our updated levels and weighted levels will allow us to track the movement down and then catch bounces up.
We will continue to buy dips using our support levels taking 30 to 40 pips. As stated before each of our level structures give 20 to 40 pip bounces, which is enough for a nice entry and exit. If you back test the levels we shared every week for the past 24 months, you can see how effectively they were used to trade with or against short/mid term swings and trends.
BULLISH TARGET
2760 (EMA5 LOCK ABOVE 2737 WILL FURTHER CONFIRM THIS) - DONE
POTENTIALLY 2779 - DONE
EMA5 CROSS AND LOCK ABOVE 2779 WILL OPEN THE FOLLOWING BULLISH TARGET
2797
POTENTIALLY 2814
BEARISH TARGETS
2737 - DONE
2715
EMA5 CROSS AND LOCK BELOW 2715 WILL OPEN THE SWING RANGE
SWING RANGE
2693 - 2669
As always, we will keep you all updated with regular updates throughout the week and how we manage the active ideas and setups. Thank you all for your likes, comments and follows, we really appreciate it!
Mr Gold
GoldViewFX

Bitcoin: Fed Cut, Spot ETFs, Michael Saylor, Doubts & Questions I am always considering the other "side," the competing point of view. I always accept what others are saying, try to see things the way others see it.
Everyday, I try to see Bitcoin moving higher and I stay open to 100K. I've been open and waiting since March 2024 and with every day that passes I get more and more convinced that 100K is not happening, but instead we are seeing a massive consolidation phase.
But I never give...
— What am I not seeing?
— What are they seeing that I am missing?
— Why or how do I see lower highs on the chart, am I making them up?
— Are prices rising and somehow I am ignoring this?
— Did Bitcoin hit 84,000 on a wick on the 5th of August and somehow I saw it in reverse?
— Where am I wrong?
— What am I missing?
But with each passing day, I am more and more convinced that my friends here might be wrong. It is painful but I have to accept that I might be seeing it the way I think I see it... But I keep trying.
Ok... What are the signals that you look for a bullish breakout to happen?
High volume, a major low being hit, bullish divergence on the indicators, low prices after a major bearish cycle, etc. Are these present here? No.
Ok... Maybe you are justified in thinking that the chart is bearish.
Maybe you are not fooling yourself.
Maybe these people are wrong...
But how can they be wrong, if they are wrong it means I am right, and if I am right, it means that Bitcoin has been going down and not up since March 2024.
Let me ask you a question, what is the difference between October 2024 and October 2023?
In October 2024 Bitcoin is trading at $67,800 and the price was around $26,000 in October 2023.
Do you belief Bitcoin will hit $100,000 in October 2024?
Of course not. This is very unlikely.
Do you think Bitcoin will remain at the same level in October 2024?
Leave a comment.
What tends to happen before the elections?
If Bitcoin is ultra-bullish, why is it not already trading at $90K?
If we have Michael Saylor claiming to the moon, the Spot ETFs, Fed Cuts and the rest, why is Bitcoin not trading at 100K already?
Why Bitcoin has not grown in the last 7 months?
Because we are in the distribution phase, and the distribution phase ends in a major crash, prices go down not up. That's why. It is because after a bullish wave, the market produces a correction.
We are in the correction phase right now. Only after the correction is over we can see growth.
But Michael Saylor bought Bitcoin!
The company that he runs bought Bitcoin, it is likely that on the outside he is building a massive SHORT.
Namaste.

EURUSD - 4hrs ( Buy Trade Target Range 200 PIP ) 🟢 Pair Name :EUR/USD
Time Frame : 4hrs Chart / Close
Scale Type : Large Scale
------
spreading knowledge among us and to clarify the most importan+t points of entry, exit and entry with more than 5 reasons
We seek to spread understanding rather than make money
🟢 Key Technical / Direction ( Long )
———————————
Bullish Break
1.08600 Area
Reasons
- Major Turn level
- Visible Range Hvn
- Fixed Range Hvn
- Channel Break
- Choch Zone
Bearish Reversal
1.10400 Area

GOLD 1H AND 4H CHART ROUTE MAP UPDATEHey Everyone,
Another PIPTASTIC day on the charts today with our 1H chart complete and 4h chart targets also smashed. We got the EMA5 cross and lock above 2762 opening 2772 and 2781, which were hit today completing this 1h chart idea (please see below)
Our 4h chart also had ema5 cross and lock above 2737, opening 2760 and 2779, which were both hit completing this range. We now have ema5 lock above 2779 opening the range above. We always take caution chasing targets all the way to the top and that why using our Goldlturns to buy dips is the safest way to chase targets in a new range
We will keep the above in mind when taking buys from dips. Our updated levels and weighted levels will allow us to track the movement down and then catch bounces up.
We will continue to buy dips using our support levels taking 30 to 40 pips. As stated before each of our level structures give 20 to 40 pip bounces, which is enough for a nice entry and exit. If you back test the levels we shared every week for the past 24 months, you can see how effectively they were used to trade with or against short/mid term swings and trends.
BULLISH TARGET
2760 (EMA5 LOCK ABOVE 2737 WILL FURTHER CONFIRM THIS) - DONE
POTENTIALLY 2779 - DONE
EMA5 CROSS AND LOCK ABOVE 2779 WILL OPEN THE FOLLOWING BULLISH TARGET
2797
POTENTIALLY 2814
BEARISH TARGETS
2737 - DONE
2715
EMA5 CROSS AND LOCK BELOW 2715 WILL OPEN THE SWING RANGE
SWING RANGE
2693 - 2669
As always, we will keep you all updated with regular updates throughout the week and how we manage the active ideas and setups. Thank you all for your likes, comments and follows, we really appreciate it!
Mr Gold
GoldViewFX

Be careful with Apple !!!In my opinion, the shares of this company should be 13.4% lower than the current price, which means at $199 .
So, any correction in the shares of tech giants is an opportunity for investment entry....
✨We spend hours finding potential opportunities and writing useful ideas, we would be happy if you support us.
Best regards CobraVanguard .💚
_ _ _ _ __ _ _ _ _ _ _ _ _ _ _ _ _ _ _ _ _ _ _ _ _ _ _ _ _ _ _ _
✅Thank you, and for more ideas, hit ❤️Like❤️ and 🌟Follow🌟!
⚠️Things can change...
The markets are always changing and even with all these signals, the market changes tend to be strong and fast!!

EURUSDHello Traders! 👋
What are your thoughts on EURUSD?
After reaching a key support area and trendline, this currency pair has begun a bullish corrective move, as expected. This correction is anticipated to continue up to a specified resistance level, where selling pressure may increase, potentially triggering a new bearish wave.
Don’t forget to like and share your thoughts in the comments! ❤️

Best Level to BUY/HOLD TSLA 100% upside TP 500/550 USD🔸Hello traders, today let's review 8hour chart for TSLA. Entering re-accumulation stage now, expecting range bound trading during next few weeks as we enter pullback/correction. We are closing in on heavy overhead resistace / limited upside currently.
🔸The speculative chart pattern is bullish C*H in progress, expect more range locked price action for a few weeks as we re-accumulate and get ready to clear the overhead resistances. Measured move price projectiong for the C*H structure is 500/550 USD, 100%+ upside from the recommended BUY ZONE.
🔸Recommended strategy bulls: wait for TSLA to re-accumulate in the sliding bull flag formation into the liquidity zone and get ready to BUY/HOLD low near 220 USD, target based on measured move projection is 550 USD. good luck traders!
🎁Please hit the like button and
🎁Leave a comment to support our team!
RISK DISCLAIMER:
Trading Futures , Forex, CFDs and Stocks involves a risk of loss.
Please consider carefully if such trading is appropriate for you.
Past performance is not indicative of future results.
Always limit your leverage and use tight stop loss.

BTC towards $76k!hello guys
Channel Breakout: Bitcoin is moving within an ascending channel, with price action close to the upper boundary, indicating bullish momentum.
Resistance Test: After breaking above a long-term downward trendline, Bitcoin has held steady, suggesting that the previous resistance is now acting as support.
Next Target Zones: Price is heading toward the next resistance area around $74,000–$76,000, highlighted by potential bullish continuation patterns.
Upside Potential: A successful breakout above the $76,000 level could propel Bitcoin toward the $80,000+ range, fueling further optimism for a strong uptrend.
Watch for Retests: If Bitcoin retraces, it could find support within the channel or around the previous breakout point, making these ideal zones for potential entry.

Google - It Is Bullish Either Way!Google ( NASDAQ:GOOGL ) will follow one of two scenarios:
Click chart above to see the detailed analysis👆🏻
Google just perfectly followed the anticipated bullish break above the previous all time high, the retest and the bullish continuation towards the upside. Even if we see another retest of the breakout level, Google remains in an overall uptrend and the path of least resistance is higher.
Levels to watch: $200, $150
Keep your long term vision,
Philip (BasicTrading)

GOLD → The calm before the storm. News ahead... FX:XAUUSD is at a strong resistance of 2790. Traders are getting nervous before the news. Risks as well as the price are rising. PCE, Initial Jobless Claims, Chicago PMI are ahead.
Traders have taken a wait-and-see stance ahead of the news. PCE along with NFP on Friday should give an insight into the Fed's interest rate outlook. Against the backdrop of a steady US labor market, a 0.25% cut is the most likely scenario. The metal is holding back any fall that could be seen as a correction due to election uncertainty. There is not much time left. As well as news from China and the escalated conflict in the Middle East.
Technically gold is in a range, the chart indicates stronger levels and liquidity zones. The most probable scenario is a retest of one of the support zones and further growth after liquidity capture. Targets in such a case could be 2789-2800.
Support levels: 2771, 2758, 2745
Resistance levels: 2789, 2800
It is not excluded that there may be a strong shakeout on the background of the news. Market behavior at the moment will depend on the actual data. The reaction may be extremely aggressive.
Rate, share your opinion and questions, let's discuss what's going on with ★
FX:XAUUSD ;)
Regards R. Linda!

Lingrid | GOLD reached Historic HIGHSThe price perfectly fulfilled my previous idea. It hit the target zone. OANDA:XAUUSD has reached another all-time high after breaking and closing above the triangle pattern. The market has been forming small candles, which may indicate a potential pullback, especially with high-impact news scheduled for today that could influence market volatility. I believe the market might retest the previous day's high before moving higher towards another psychological level. Keeping an eye on the news and price action will be essential for determining the next moves. My goal is resistance zone around 2800
Traders, if you liked this idea or if you have your own opinion about it, write in the comments. I will be glad 👩💻

GOLD → Risks are rising and so is the price. News ahead! FX:XAUUSD updates ATH to 2790. This is probably not the limit, but the risks, like the price, are rising ahead of strong news and the US election race.
Gold feels support for several reasons: stopping the rally in DXY (profit taking is possible), positive hints about the Chinese economy, escalating conflict in the Middle East. The dollar stops the rally and forms consolidation for the last few days, which is generally favorable for gold.
The metal is updating the highs and in the current conditions trading is quite simple: we trade either a breakdown of resistance in order to continue the movement, or search for strong support zones, where we can trade price pullbacks.
Today the Nonfarms from ADP, US GDP will be released. This is worth paying attention to. Weaker data can greatly increase volatility and provoke the continuation of metal growth. And vice versa.
Resistance levels: 2789, 2800
Support levels: 2777, 2771, 2758
Gold is in a local correction. Emphasis on strong support zones with the purpose of rebound and continuation of growth. But, we need to watch the news, there may be shake-ups, but the general background for gold is expected to remain favorable.
Rate, share your opinion and questions, let's discuss what's going on with ★ FX:XAUUSD ;)
Regards R. Linda!

XAU/USD : Ready for more LONG ? (READ THE CAPTION)By analyzing the #Gold chart in the 15-minute timeframe, we can see that gold is currently trading around the $2780 level. If it holds above this level, I expect further upward movement. The potential targets for this rise are $2784, $2787, and $2790.
Please support me with your likes and comments to motivate me to share more analysis with you and share your opinion about the possible trend of this chart with me !
Best Regards , Arman Shaban

Can BNB reach around $1000 ?...The BNB is in a ascending triangle now which means the price will increase and also It is expected that the price would at least grow as good as the measured price movement(AB=CD)
Note: we should wait for the breaking of the triangle and than make a move!
See my first anaysis on BNB in 2020
✨We spend hours finding potential opportunities and writing useful ideas, we would be happy if you support us.
Best regards CobraVanguard.💚
_ _ _ _ __ _ _ _ _ _ _ _ _ _ _ _ _ _ _ _ _ _ _ _ _ _ _ _ _ _ _ _
✅Thank you, and for more ideas, hit ❤️Like❤️ and 🌟Follow🌟!
⚠️Things can change...
The markets are always changing and even with all these signals, the market changes tend to be strong and fast!!

CRUDE OIL (WTI): Time to Fill the Gap?!WTI Oil experienced a significant drop at the opening due to tensions between Israel and Iran.
Historically, there is a high probability that such gaps will be filled. This presents a potential opportunity for long positions.
The price has now reached a crucial daily support level and is consolidating within a narrow range on the 4-hour chart.
I have identified a confirmed breakout of a resistance zone within this range, indicating a potential upward movement. It is possible that the oil price will increase and reach levels around 70.00 - 71.00.

THE KOG REPORT - UpdateEnd of day update from us here at KOG:
In Sunday's KOG Report we gave the levels of interest above that we wanted to long into and then said we would be looking for RIPs there to short the market. We did get a bit of a stretch and range above, but the 2780-85 region worked well together with KOG's bias of the day completing all the bullish targets and then giving us the move down that we wanted today following the bias level targets and the red boxes. A phenomenal move on Gold which may have caught many traders by surprise, but after the move we've had, it's normal to see this type of pullback.
Now we've tapped into the order region and price looks like it's exhausting, we will suggest no shorting here, rather be looking for the 2730 level to hold us up and for there to be a potential move upside into the initial levels of 2745 and above that 2750. Expect there to be a lot of ranging and choppy price action now pre-event NFP tomorrow. For now, that's been a pretty accurate week again for the KOG Report.
As always, trade safe.
KOG

Ethereum (ETH): Rejection From Resistance!Since yesterday we had a nice touch to the upper resistance zone, where after that sellers showed dominance and price got rejected.
We are now looking for a few candles to show us further sellers dominance, giving us final confirmations of a good downward movement.
RSI has started a nice downtrend and Bollinger Bands has stabilised as well, ready to fall.
Swallow Team

Solana May Move Down After Pattern CompletionSolana May Move Down After Pattern Completion
Solana has completed a large bearish harmonic pattern near $183.30.
The pattern looks solid, and given that it was created in a strong historical zone, the odds are that we may see Solana moving down as shown on the chart.
This time, we have an aggressive bearish scenario, because the market is also speculating about the US elections and USD strength.
However, this is the nature of this pattern—it can push the price down aggressively when we least expect it.
I am watching for support zones at $165.00 and $154.00.
Let's see how the market unfolds.
You may find more details in the chart!
Thank you and Good Luck!
❤️PS: Please support with a like or comment if you find this analysis useful for your trading day❤️

Bitcoin Analysis==>>New All-Time High(ATH) is Loading!!!For a better view of Bitcoin ( BINANCE:BTCUSDT ), I suggest you read yesterday's post first.👇
As I expected, Bitcoin corrected to the Support zone($72,000-$70,820) and is currently moving in a descending channel(small) .
According to Elliott wave theory , Bitcoin has completed wave 4 and we should wait for wave 5 .
I expect Bitcoin will touch New All-Time High(ATH) soon. (After breaking the upper line of the ascending channel).
⚠️Note: If Bitcoin falls below the Support zone($72,000-$70,820), it may fall further.⚠️
Bitcoin Analyze (BTCUSDT), 15-minute time frame⏰.
🔔Be sure to follow the updated ideas.🔔
Do not forget to put Stop loss for your positions (For every position you want to open).
Please follow your strategy and updates; this is just my Idea, and I will gladly see your ideas in this post.
Please do not forget the ✅' like '✅ button 🙏😊 & Share it with your friends; thanks, and Trade safe.

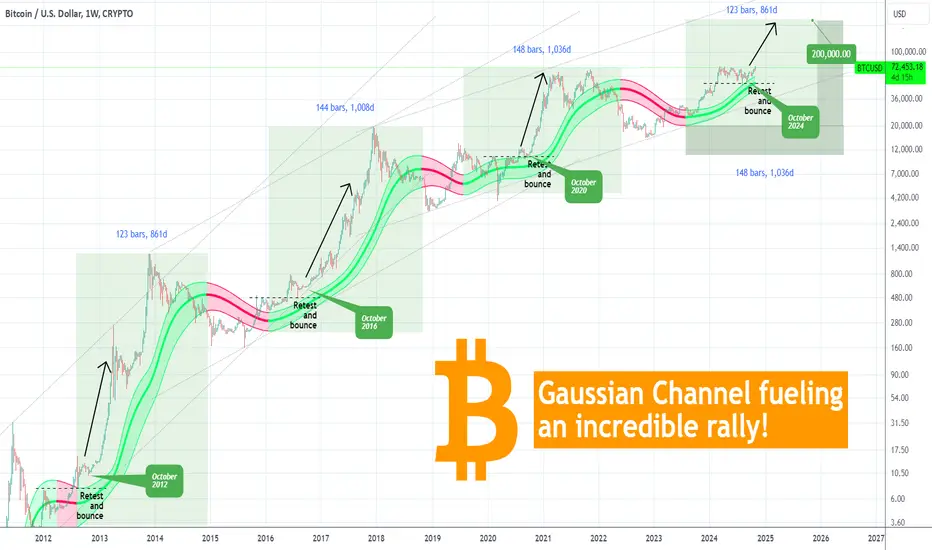
BITCOIN Gaussian Channel telling you the rally has already begunBitcoin (BTCUSD) is illustrated here on the 1W time-frame from the 2011 Cycle until today. We've used the Gaussian Channel (GC) after a long time and the reason is simple. Since the August 05 2024 Low, it has been supporting the uptrend up to today's test of the All Time High (ATH).
** Gaussian October support every 4 years **
This continuous support is a critical feature moving forward as every time the GC held at this stage of the previous Cycles (October 2020, 2016 and 2012), BTC started its final (and most aggressive) Parabolic Rally of the Cycle.
** Resistance turned Support **
What's equally interesting is that during those stages, the price also re-tested and held the former Resistance (of the previous Higher High), turned it into a Support (while the GC held) and bounced to the Parabolic Rally. This is a remarkably consistent feature taking place every 4 years!
** The green GC length matters **
Now as to the GC in more detail. What we want you to keep from it, is that the green part of the GC has lasted in the previous Cycles 123, 144 and 148 weeks respectively, which translates to 861, 1008 and 1036 days, until it turned red. As a result, we can expect the current green phase to last until December 08 2025 (minimum) and June 01 2026 (maximum). It is more reasonable to expect the longer case as the recent Cycles tend to have stabilized most of their common time patterns.
The Bear Cycle tends to start when a 1W candle is closed below the GC. Until then, based on the parallel Channel Up patterns that encompass 3 Cycles each time, we can even expect a price as high as $200000 for this Cycle Top.
Do you think that's realistic? And if so, do you also expect the GC wave to support a parabolic rally all the way to the top? Feel free to let us know in the comments section below!
-------------------------------------------------------------------------------
** Please LIKE 👍, FOLLOW ✅, SHARE 🙌 and COMMENT ✍ if you enjoy this idea! Also share your ideas and charts in the comments section below! This is best way to keep it relevant, support us, keep the content here free and allow the idea to reach as many people as possible. **
-------------------------------------------------------------------------------
💸💸💸💸💸💸
👇 👇 👇 👇 👇 👇
Bitcoin Roadmap!!!Bitcoin ( BINANCE:BTCUSDT ) moved as ✅I expected in the previous post .
Bitcoin is moving near the Potential Reversal Zone(PRZ) and the upper line of the ascending channel .
According to Elliott's wave theory, Bitcoin is completing wave 3 . I expect the Bitcoin rally will need a Correction to continue near the All Time-High(ATH) .
I expect Bitcoin to drop down to the Support zone($72,000-$70,820) and Support line .
🔔Let's first short position, and I will try to update for the long position.🔔
⚠️Note: If Bitcoin falls below the Support zone($72,000-$70,820), it may fall further.⚠️
Bitcoin Analyze (BTCUSDT), 1-hour time frame⏰.
🔔Be sure to follow the updated ideas.🔔
Do not forget to put Stop loss for your positions (For every position you want to open).
Please follow your strategy and updates; this is just my Idea, and I will gladly see your ideas in this post.
Please do not forget the ✅' like '✅ button 🙏😊 & Share it with your friends; thanks, and Trade safe.
