BITCOIN - Price can correct to support area and then start riseHi guys, this is my overview for BTCUSD, feel free to check it and write your feedback in comments👊
For a significant period, the price of Bitcoin was trading upwards within the confines of a rising channel.
Strong buying pressure led to a breakout above the channel's upper boundary, signaling an acceleration of the uptrend.
After this breakout, the upward momentum stalled, and the price entered a new phase of horizontal consolidation, forming a wide flat range.
The price recently tested the upper resistance of this range near $122800 and was rejected.
As a result, the asset is currently in a corrective move downwards, approaching the key support area located between $114000 and $115000
I expect that the price will find support at the bottom of this flat range, reverse its course, and begin a new rally back towards the top of the range at $122800
If this post is useful to you, you can support me with like/boost and advice in comments❤️
Disclaimer: As part of ThinkMarkets’ Influencer Program, I am sponsored to share and publish their charts in my analysis.
Trend Analysis

TON/USDT - Bullish Channel in H4 (27.07.2025)The TON/USDT pair on the H4 timeframe presents a Potential Buying Opportunity due to a recent Formation of a Bullish Channel Pattern. This suggests a shift in momentum towards the upside and a higher likelihood of further advances in the coming Days.
Possible Long Trade:
Entry: Consider Entering A Long Position around Trendline Of The Pattern.
Target Levels:
1st Resistance – 3.770
2nd Resistance – 3.989
🎁 Please hit the like button and
🎁 Leave a comment to support for My Post !
Your likes and comments are incredibly motivating and will encourage me to share more analysis with you.
Best Regards, KABHI_TA_TRADING
Thank you.

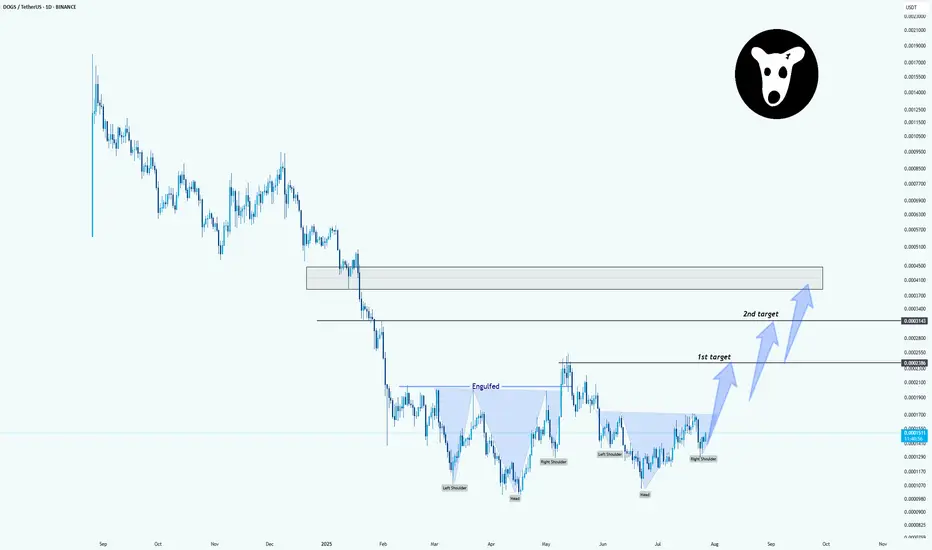
DOGSUSDT: Inverse Head & Shoulders Pattern in PlayHello.
The chart clearly shows an inverse head and shoulders formation. Price has now formed:
Left Shoulder
Head
Right Shoulder (recently completed)
The neckline was engulfed after a strong move, which adds confidence to the breakout potential. If the price continues to hold above the right shoulder and gains momentum:
First target is around the 0.0002280 area
Second target is marked near 0.0003430
If volume increases or we see continuation candles, this setup could offer a good bullish opportunity.
Invalidation: Breakdown below the right shoulder lows would weaken the pattern.
GOLD 1H CHART ROUTE MAP UPDATE & TRADING PLAN FOR THE WEEKHey Everyone,
Please see our updated 1h chart levels and targets for the coming week.
We are seeing price play between two weighted levels with a gap above at 3348 and a gap below at 3328 . We will need to see ema5 cross and lock on either weighted level to determine the next range.
We will see levels tested side by side until one of the weighted levels break and lock to confirm direction for the next range.
We will keep the above in mind when taking buys from dips. Our updated levels and weighted levels will allow us to track the movement down and then catch bounces up.
We will continue to buy dips using our support levels taking 20 to 40 pips. As stated before each of our level structures give 20 to 40 pip bounces, which is enough for a nice entry and exit. If you back test the levels we shared every week for the past 24 months, you can see how effectively they were used to trade with or against short/mid term swings and trends.
The swing range give bigger bounces then our weighted levels that's the difference between weighted levels and swing ranges.
BULLISH TARGET
3348
EMA5 CROSS AND LOCK ABOVE 3348 WILL OPEN THE FOLLOWING BULLISH TARGETS
3369
EMA5 CROSS AND LOCK ABOVE 3369 WILL OPEN THE FOLLOWING BULLISH TARGET
3397
EMA5 CROSS AND LOCK ABOVE 3397 WILL OPEN THE FOLLOWING BULLISH TARGET
3422
BEARISH TARGETS
3328
EMA5 CROSS AND LOCK BELOW 3328 WILL OPEN THE FOLLOWING BEARISH TARGET
3305
EMA5 CROSS AND LOCK BELOW 3305 WILL OPEN THE SWING RANGE
3289
3267
As always, we will keep you all updated with regular updates throughout the week and how we manage the active ideas and setups. Thank you all for your likes, comments and follows, we really appreciate it!
Mr Gold
GoldViewFX

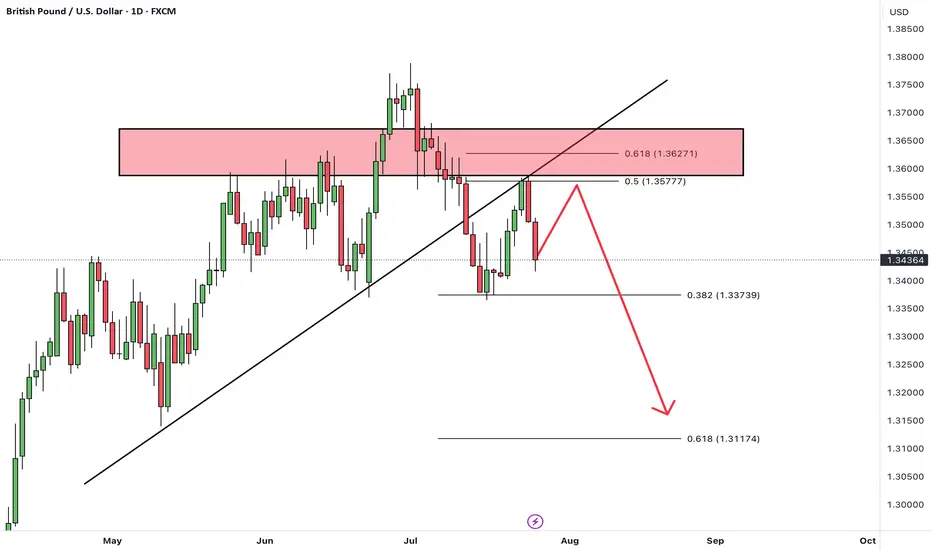
GBPUSDHello Traders! 👋
What are your thoughts on GBPUSD?
GBP/USD has broken below a trendline and has completed a retest (pullback) to the broken level.
The pair is now positioned for a potential downward move.
After some short-term consolidation, we expect price to drop at least toward the next identified support level.
As long as GBP/USD stays below the broken trendline, the bearish bias remains valid, and further downside is likely.
Don’t forget to like and share your thoughts in the comments! ❤️
BITCOIN → Correction within a downward channel. 112K or 125K?BINANCE:BTCUSDT is consolidating. However, a local downward trading range is forming relative to the current setup. What is the probability of a correction continuing to 112K or growth to 125K?
Daily structure: a local correctional channel within a global bullish trend. We have cascading resistance at 119.2, 119.6, 120, and 120.8. It will be quite difficult to break through this zone on the first attempt, but MM can use it to form traps and collect liquidity.
At the bottom, everything is simpler — a breakdown of the local bullish structure, the formation of an intermediate minimum, below which there is a void down to 112K.
Yesterday, relative to 115-116K, mm staged a massacre (trap) on both sides of the market.
Liquidity collection, return to the range, and growth. The reaction to the false breakdown of support is quite strong. Since the opening of the session, Bitcoin has been heading towards resistance, but there may not be enough potential to break through the upper resistance conglomerate, so I expect to see a pullback or decline to 116-115-114.
Resistance levels: 119.2, 120.1, 120.85
Support levels: 116.37, 115.67, 112
Technically and fundamentally, I do not see any drivers that could support the market (I am talking about Bitcoin, since the driver for altcoins is the decline in Bitcoin's dominance). It is possible that this may appear later. In the current situation, I am considering a false breakout and correction, as the market has not yet finished consolidating or correcting, and the current downward trading range may be extended.
PS: As the price moves towards resistance, it is necessary to monitor the reaction. The market itself will show what it is preparing for...
Best regards, R. Linda!

GOLD WEEKLY CHART MID/LONG TERM ROUTE MAPHey Everyone,
Weekly Chart Update – 3387 Tested, Channel Top Rejected
Quick follow up on our Weekly Chart roadmap – price continues to respect the structure with precision.
As anticipated, we got the test of 3387, completing the short term magnet move we've been tracking. That level aligned perfectly with the channel top, and true to form, we saw a clean rejection right on cue just short of the full channel top leaving that open.
Importantly, there was no close or lock above that zone, reaffirming it as valid resistance for now. As a result, the range remains active, with price still oscillating between 3281 support and 3387 resistance.
Key structural notes:
🔹 Structure remains intact
No weekly close above 3387, no breakdown below 3281. The rising channel is still fully respected, and EMA5 has yet to turn bearish.
🔹 3281 Holding Strong
This level continues to act as a key weekly pivot. As long as it holds, we maintain a constructive outlook within the current range.
🔹 3387 Tested + Rejected
First test gave us the expected reaction. Until we see a confirmed close above, it remains the top of the current range.
Updated Levels to Watch:
📉 Support – 3281
Weekly pivot and current range low. Still our key area for dip buys within this structure.
📈 Resistance – 3387
Now tested and confirmed. No break or lock above = valid rejection level.
📈 Resistance 2 – 3482
Unfilled weekly gap. Still the broader target, but we need a proper breakout above 3387 first.
Plan: We continue to treat 3281–3387 as the active weekly range. If 3281 fails, we reassess at the midline of the channel. If 3387 breaks and holds, we shift focus toward 3482.
Thanks again for all the incredible engagement and support, it means a lot to us here at GoldViewFX. Stay focused, stay disciplined.
Mr Gold
GoldViewFX

Bitcoin Cash $2,615 Minimum · $4,178 Possible · Plan Ahead105 days. This is definitely the longest stretch of bullish action since 2021. Bitcoin Cash has been growing non-stop for 105 days.
If someone told you this would be the case some months ago or a few years back you wouldn't believe it. What if someone tells you now that you've seen nothing yet? What if I told you that the best is yet to come? This is only the build-up process. Bitcoin Cash is about to shoot up really strong. It will skew the chart. People won't be able to comprehend what is happening less adapt to the market. It will be chaos, bullish chaos.
Years of consolidation. Bitcoin Cash has been on a wide trading range since February 2024. We can easily say since mid-2023 if we consider using a wider range. This is all the build-up process for this moment now. The 2025 bull market. Predicted years ago, now it cannot be denied, it is right in your face.
Let's play the other side for entertainment's sake. Bitcoin Cash stops rising, either a lower high now or a reversal at the December or April 2024 high. What would happen then? A bear market? No! Just a down-wave, more consolidation before the final advance, price jump and market bull run.
Let's go back to reality for accuracy's sake. Bitcoin Cash will grow in bullish momentum and will break all resistance one next to the other, stops will be short. If there is a correction in-between the action, it won't be long.
Look back to the 2021 bullish wave, the fifth wave; notice three weeks red, two weeks red, one week red, etc., in-between the rising wave. Straight up but obviously, there are some stops. When we are in the experience, when it is happening, these weeks feel like forever and we never know if it will continue rising or if that's it, we reached the end. I am telling you now, it will not be over until a major new all-time high hits, and the levels are being shown now. When we are more advanced in the market cycle, I will not try to predict the short-term. Instead, I will tell you to secure profits and move on. Once prices are really high, close your position and start looking for the ones still trading low near support. Of course, writing this won't change anything, people will still be attracted to the action and mistakes will be the norm. Only if you bought early when prices were low, you will be able to withstand the market pressure. If you buy late, the market will kill you and take everything from you. This is a friendly reminder. Plan ahead.
Namaste.

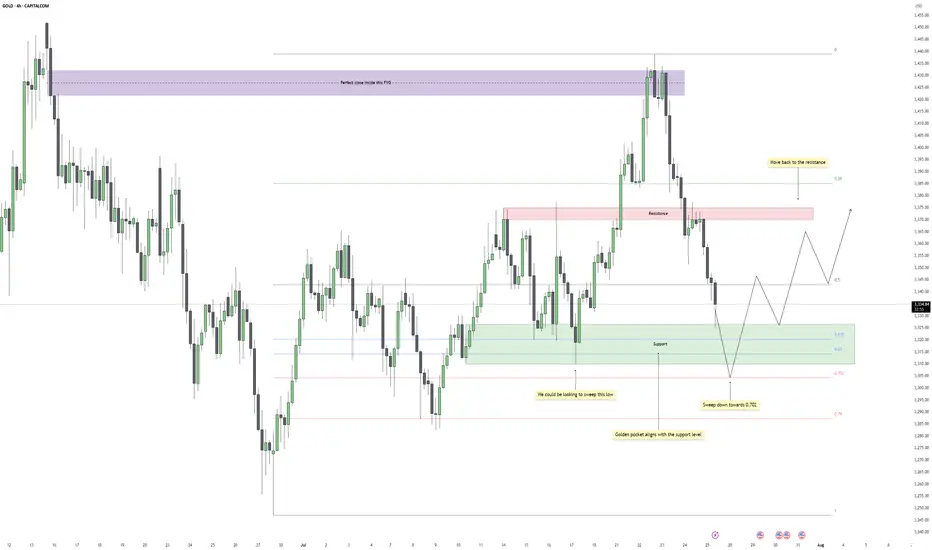
Gold - Eyes on the Final Flush Before ReclaimGold recently dropped after reacting perfectly inside a higher time frame fair value gap. That zone acted as clean supply, offering a precise close within the imbalance and initiating a strong bearish leg. The move confirmed that buyers were overwhelmed at that level, and price began its descent back into a broader consolidation range.
Support Cluster and Fibonacci Alignment
The current zone being tested holds significant weight. Price has tapped into a clear support region, one that has already caused multiple strong bounces in recent sessions. What adds further confluence is the alignment of this zone with the golden pocket region of the entire upward leg. This kind of technical overlap increases the chances of responsive buying once liquidity is cleared below.
Liquidity Target and Inducement Setup
Just below current price action, there's a clean low that hasn't been taken out yet. This low acts as the inducement, sitting right above deeper Fibonacci levels, especially the 0.702. If price continues lower in the short term, a sweep of that low into the golden pocket would provide the ideal liquidity grab before a reversal. The market often rewards those who wait for that final flush.
Bullish Recovery Path
Once the liquidity is taken and price stabilizes at the golden pocket zone, the path is open for a recovery move back into the midrange and potentially higher. The most likely magnet for price after a successful bounce would be the previous resistance zone, which coincides with the 0.5 retracement of the recent drop. That area should act as the next decision point and could either cap the rally or provide the base for a continuation if buyers show strength.
What I’m Watching
The cleanest scenario would be a sweep of the low just below support, ideally pushing into the lower green box near the 0.702 level, followed by a strong bullish reaction. I’ll be watching for a market structure shift on the lower timeframes at that point to confirm the entry. If that happens, the trade has room to develop back into the prior resistance zone, offering a solid range for intraday or swing setups.
Conclusion
Gold remains in a broader range for now, but the technicals suggest one more drop to clear late long positions before a recovery. The reaction at the support cluster will be crucial. If bulls step in after the sweep, there’s a high-probability path back toward resistance, with the move likely supported by the golden pocket confluence.
___________________________________
Thanks for your support!
If you found this idea helpful or learned something new, drop a like 👍 and leave a comment, I’d love to hear your thoughts! 🚀
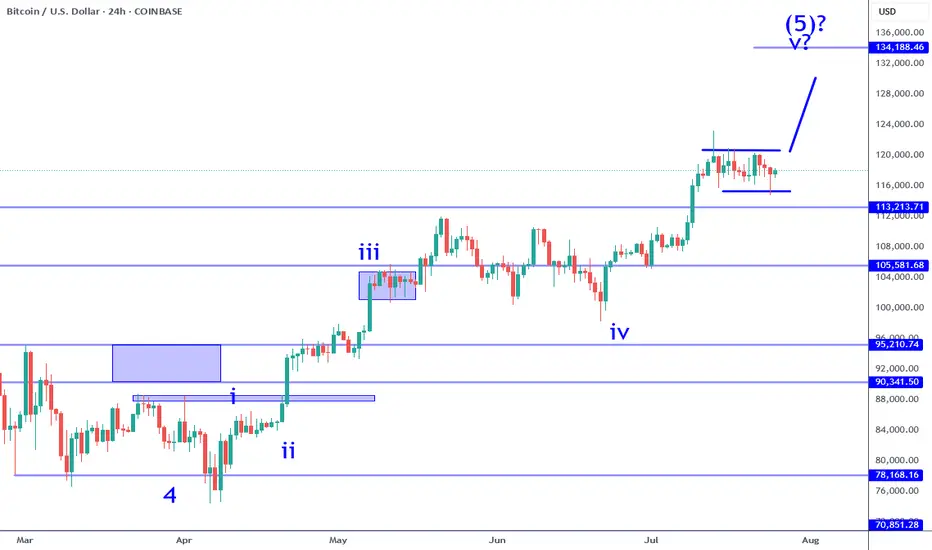
Bitcoin Still Consolidating For Wave 5 RallyBitcoin sub wave 4 consolidation continues to persist. While there was a failed break out over the previous week, it has not changed the bullish impulse at all. The current structure implies that there is a higher probability that one more leg higher (sub wave 5) is likely. It could be the coming week or next, it is all a function of catalyst. Keep in mind this consolidation can test as low at 113K and still be within the criteria of a wave 4. There are numerous opportunities in this situation when it comes to day trade and swing trade longs.
The break out: IF price pushes beyond 120K with conviction (large sustained candle on this time frame) that would be a swing trade long signal. IF there is no instant pullback (fake out), this can be the momentum required to test the 130Ks. Keep in mind, there is an inflection point in the 133K area which serves as a profit objective to measure from. Price can potentially go beyond that point, but participating in that is all about waiting and watching how price behaves. There is NO way to know how this will play out in advance. You have to adjust as new information becomes available.
The retest: if price pulls back into the 116K to 113K area and establishes a reversal on this time frame (or on adjacent time frames like 4H). This can appear in numerous ways: pin bar, engulfing candle, inverse head and shoulders, etc. This scenario would offer greater potential especially if the break out occurred soon after (high probability). IF the 113K level breaks instead, it will put the impulse structure into question. Meaning the probability of a wave 5 to follow will become lower.
This environment in my opinion is not easy to navigate for traders. People who bought into the alt coin weakness months ago are now getting paid and enjoying "alt season", which is great but not good if you are looking to buy something now with a longer time horizon in mind. Wave 5's often signal a corrective move is likely to follow and Bitcoin is potentially completing a very large magnitude Wave 5. I have been pointing this out for months. Most investors will ignore this because they will be biased by greed. The wise this to do is lock in profits along the way at inflection points such as whole numbers, price proportions (like 133K) and/or clear candle reversal signals after significant moves.
Thank you for considering my analysis and perspective.
GBP/CAD - H4 - Bearish Flag (26.07.2025)The GBP/CAD Pair on the H4 timeframe presents a Potential Selling Opportunity due to a recent Formation of a Bearish Flag Pattern. This suggests a shift in momentum towards the downside in the coming Days.
Possible Short Trade:
Entry: Consider Entering A Short Position around Trendline Of The Pattern.
Target Levels:
1st Support – 1.8242
2nd Support – 1.8139
🎁 Please hit the like button and
🎁 Leave a comment to support for My Post !
Your likes and comments are incredibly motivating and will encourage me to share more analysis with you.
Best Regards, KABHI_TA_TRADING
Thank you.
Disclosure: I am part of Trade Nation's Influencer program and receive a monthly fee for using their TradingView charts in my analysis.

NZDCHF I Daily CLS I Model 1 I Pullback entryYo Market Warriors ⚔️
Fresh Crypto Analysis— if you’ve been riding with me, you already know:
🎯My system is 100% mechanical. No emotions. No trend lines. No subjective guessing. Working all timeframes. Just precision, structure, and sniper entries.
🧠 What’s CLS?
It’s the real smart money. The invisible hand behind $7T/day — banks, algos, central players.
📍Model 1:
HTF bias based on the daily and weekly candles closes,
Wait for CLS candle to be created and manipulated. Switch to correct LTF and spot CIOD. Enter and target 50% of the CLS candle.
For high probability include Dealing Ranges, Weekly Profiles and CLS Timing.
Analysis done on the Tradenation Charts
Disclosure: I am part of Trade Nation's Influencer program and receive a monthly fee for using their TradingView charts in my analysis.
Trading is like a sport. If you consistently practice you can learn it.
“Adapt what is useful. Reject whats useless and add whats is specifically yours.”
David Perk aka Dave FX Hunter
💬 Comment any Coin I ll give you my quick view

GOLD 4H CHART ROUTE MAP UPDATE & TRADING PLAN FOR THE WEEKHey Everyone,
Please see our updated 4h chart levels and targets for the coming week.
We are seeing price play between two weighted levels with a gap above at 3354 and a gap below at 3297. We will need to see ema5 cross and lock on either weighted level to determine the next range.
We will see levels tested side by side until one of the weighted levels break and lock to confirm direction for the next range.
We will keep the above in mind when taking buys from dips. Our updated levels and weighted levels will allow us to track the movement down and then catch bounces up.
We will continue to buy dips using our support levels taking 20 to 40 pips. As stated before each of our level structures give 20 to 40 pip bounces, which is enough for a nice entry and exit. If you back test the levels we shared every week for the past 24 months, you can see how effectively they were used to trade with or against short/mid term swings and trends.
The swing range give bigger bounces then our weighted levels that's the difference between weighted levels and swing ranges.
BULLISH TARGET
3354
EMA5 CROSS AND LOCK ABOVE 3354 WILL OPEN THE FOLLOWING BULLISH TARGETS
3424
EMA5 CROSS AND LOCK ABOVE 3424 WILL OPEN THE FOLLOWING BULLISH TARGET
3499
EMA5 CROSS AND LOCK ABOVE 3499 WILL OPEN THE FOLLOWING BULLISH TARGET
3561
BEARISH TARGETS
3297
EMA5 CROSS AND LOCK BELOW 3297 WILL OPEN THE SWING RANGE
3236
3171
EMA5 CROSS AND LOCK BELOW 3171 WILL OPEN THE SECONDARY SWING RANGE
3089
3001
As always, we will keep you all updated with regular updates throughout the week and how we manage the active ideas and setups. Thank you all for your likes, comments and follows, we really appreciate it!
Mr Gold
GoldViewFX

GOLD DAILY CHART ROUTE MAPHey Everyone,
Daily Chart Update – Bounce + Rejection: Structure Still Dominates
Just a quick follow up on our range structure, we got exactly what we were anticipating.
Price gave us the perfect bounce off 3272, launching into 3433 for THE test of resistance. That move delivered another clean 160+ pip rotation, once again showing how laser accurate the structure has been.
As expected, 3433 held as resistance, and the lack of a break and hold above confirms another clean rejection. The range between 3272 support and 3433 resistance remains firmly in play, and structure continues to govern price action to the pip.
Here’s where we are now:
🔹 Range Still Active
Price continues to rotate inside our 3272–3433 box. Until we see a clean break and close beyond either boundary, we’ll keep playing the range.
🔹 No Breakout = No Change
The failure to break and lock above 3433 confirms rejection. We’re still looking for EMA5 lock for potential breakout confirmation, until then, range trades rule.
🔹 Precision Holds
Both 3272 and 3433 have now been tested and held perfectly. The respect these levels continue to show reaffirms their importance in our roadmap.
Updated Key Levels
📉 Support – 3272
Continues to act as a major pivot. Valid long entries remain on dips into this zone, unless a breakdown occurs.
📈 Resistance – 3433
Now officially tested and confirmed. Watching closely for any future breakout attempts or another rotation lower.
Thanks again for all the amazing support. Sticking to the plan, trading the structure, and staying disciplined.
Mr Gold
GoldViewFX

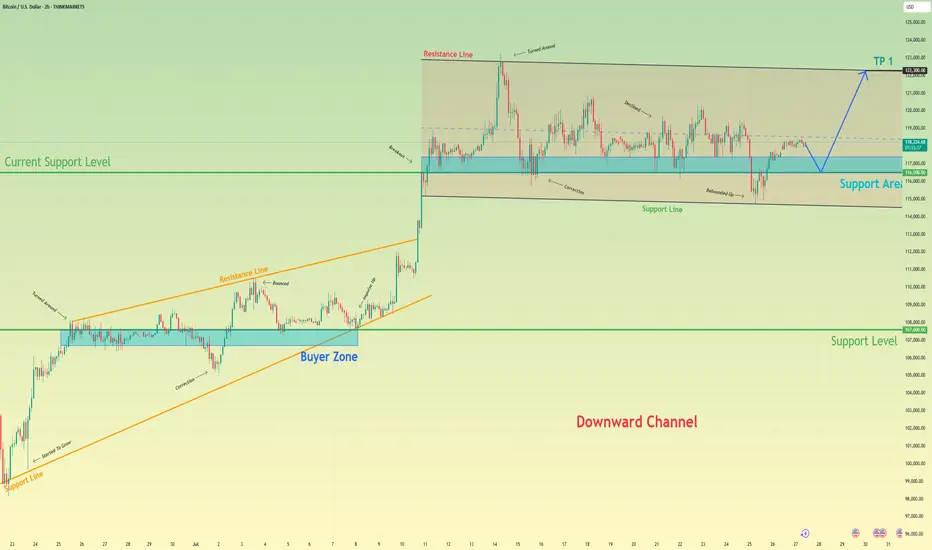
Bitcoin will rebound up from support area to resistance lineHello traders, I want share with you my opinion about Bitcoin. After a strong upward trend that originated from the buyer zone and evolved through an upward wedge, bitcoin executed a decisive breakout, shifting the market into a new, higher-value market phase. This powerful move has since led to an extended period of wide consolidation within a well-defined horizontal channel, a classic sign of the market pausing to absorb the prior impulse and build cause for its next major leg. Currently, the asset's price action is rotating within this structure, defined by a key support area around 116500 and an upper resistance line. Having been rejected from the top, the price is now completing another downward correction and is approaching the channel's foundational support for a crucial test. The primary working hypothesis is a long scenario, predicated on the proven resilience of this support level. A confirmed upward rebound from this 116500 zone would signal that the accumulation within the channel is continuing and likely to resolve upwards. Therefore, the tp is logically and strategically placed at 122300, as this level not only coincides perfectly with the channel's upper resistance line but also represents the completion of the internal rotation, setting the stage for a potential continuation of the larger uptrend. Please share this idea with your friends and click Boost 🚀
Disclaimer: As part of ThinkMarkets’ Influencer Program, I am sponsored to share and publish their charts in my analysis.
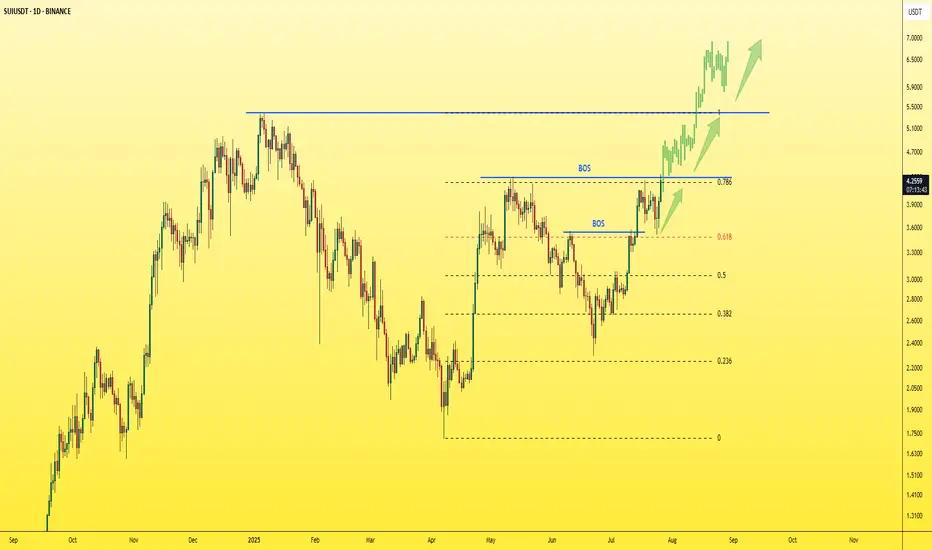
SUI - Just one step away from the explosion!The last candle on the daily chart just confirmed a BOS (Break of Structure) — a clear and strong sign of bullish continuation for the asset.
✅ This is a textbook entry for a long position.
🎯 Next target: $5 — and so far, no bearish signs in sight.
Best regards,
Ceciliones 🎯
TradeCityPro | Bitcoin Daily Analysis #137👋 Welcome to TradeCity Pro!
Let’s go over the Bitcoin analysis. I’m making a change to how I analyze Bitcoin — I will no longer include indicators like dominance charts.
🔍 From now on, I’ll be analyzing Bitcoin in daily, 4-hour, and 1-hour timeframes only.
📅 Daily Timeframe
On the daily timeframe, Bitcoin is in a strong uptrend that started from the 78,397 level and in two bullish legs has reached the 122,733 zone.
✅ This level, along with the 0.618 Fibonacci Extension, has created a strong resistance zone. Although price has attempted multiple times to break into or above this area, it has not yet succeeded in closing a candle above or inside the range.
🎲 We also have a curved trendline from higher timeframes, which the price is reacting to even on the daily chart. Currently, the price is near this trendline. There is a possibility that price consolidates over time until it reaches this trendline and then begins its next bullish leg.
📊 If that happens, breaking 122,733 or 120,140 would be triggers for opening a long position on the daily timeframe.
I do not recommend buying Bitcoin on spot right now, because I believe we’re close to the top of this bullish cycle, and this current leg might be the last one.
⭐ A breakout of 76.50 on the RSI would be a strong confirmation of bullish momentum, and would mark the continuation of the uptrend.
🔑 If we get a pullback, the price could correct to dynamic zones like SMA25 or SMA99. Important static support levels are at 110,183 and 100,763.
⏳ 4-Hour Timeframe
In the 4-hour chart, we can see more details of the bullish leg. After the sharp move to 122,733, a correction phase began, forming a range box.
💥 The bottom of the box is around 116,829, which I’ve marked as a zone. It also overlaps with the 0.382 Fibonacci, making it a very important PRZ (Potential Reversal Zone).
The top of the range is at 120,041.
🧩 Yesterday, price made a fakeout to the downside. As you can see, it dumped hard with heavy selling volume and hit the 0.5 Fibonacci level, but couldn’t hold there and quickly bounced back above 116,829.
🧲 Today, I think it's better not to go below the 4-hour timeframe and avoid getting caught up in small market noise.
A break above 120,041 can trigger a long entry.
Another breakdown from the box might trigger a deeper correction.
❌ Disclaimer ❌
Trading futures is highly risky and dangerous. If you're not an expert, these triggers may not be suitable for you. You should first learn risk and capital management. You can also use the educational content from this channel.
Finally, these triggers reflect my personal opinions on price action, and the market may move completely against this analysis. So, do your own research before opening any position.

Bitcoin Next Leg Incoming? Targets $134K from Bullish WedgeBTCUSDT is consolidating within a descending wedge right above a critical demand zone, following a impulsive breakout from its prior range structure. This current setup suggests another potential bullish continuation, especially as price continues to respect both the wedge support and internal demand.
With the higher timeframe structure favoring bulls and previous demand zones holding firm, the projected breakout targets align with $123,218 and $134,446 respectively.
A clean invalidation would only be confirmed on a sustained break below the wedge and loss of the strong support area near $110K.
All eyes on the wedge apex as BTC prepares for its next major leg.

Gold price continues to decrease, keep the rate unchanged✍️ NOVA hello everyone, Let's comment on gold price next week from 07/28/2025 - 08/1/2025
⭐️GOLDEN INFORMATION:
Gold (XAU/USD) looks set to close the week lower, pressured by upbeat U.S. economic data and progress in trade negotiations, which have reduced demand for safe-haven assets. Despite declining U.S. Treasury yields, the U.S. Dollar regained some ground. At the time of writing, XAU/USD is trading around $3,336, down nearly 1%.
Looking ahead, the Federal Reserve is widely expected to keep interest rates steady at 4.25%–4.50% for the fifth time this year. Recent data supports this stance, with Initial Jobless Claims falling for the fourth straight week—signaling a resilient labor market—while Friday’s sharp drop in Durable Goods Orders, driven by weaker aircraft demand, adds a mixed tone to the outlook.
⭐️Personal comments NOVA:
Gold prices continue to fall as interest rates remain unchanged almost this week. Along with the H4 time frame, prices continue to break important support and continue to follow a downward trend.
🔥 Technically:
Based on the resistance and support areas of the gold price according to the H4 frame, NOVA identifies the important key areas as follows:
Resistance: $3350, $3428
Support: $3312, $3280, $3246
🔥 NOTE:
Note: Nova wishes traders to manage their capital well
- take the number of lots that match your capital
- Takeprofit equal to 4-6% of capital account
- Stoplose equal to 2-3% of capital account
- The winner is the one who sticks with the market the longest

Bitcoin is getting Ready for 143K$ nowMajor red resistance trendline is now broken also last week the retest is completed now price is range for a while for new week to start and fresh volume and buys that make path easier to reach above 140K$.
Get ready and take a look at important zones at chart and possible scenarios which are all mentioned.
DISCLAIMER: ((trade based on your own decision))
<<press like👍 if you enjoy💚

Ethereum: Multiple Time Frame AnalysisEthereum: Multiple Time Frame Analysis
From the chart, we can see that Ethereum is in a clear uptrend on all timeframes.
The daily chart is bullish and is not yet showing signs of a reversal on the May timeframe.
Yesterday, ETH also confirmed an ascending triangle pattern on a lower timeframe, indicating potential upside as shown in the chart.
Key target areas: 3960; 4100 and 4250
You may find more details in the chart!
Thank you and Good Luck!
PS: Please support with a like or comment if you find this analysis useful for your trading day

Lingrid | GOLD Weekly Market Outlook: Resistance Zone RejectionOANDA:XAUUSD markets have encountered significant resistance at the $3,450 level, resulting in a notable rejection and subsequent pullback toward support zones. The precious metal is now testing critical technical levels that will determine whether the broader bullish momentum can be sustained or if deeper correction is imminent.
The 4H chart reveals a clear level rejection at the resistance zone, followed by an impulse leg lower that has broken the upward trendline. This development suggests a potential shift in short-term momentum, with gold now trading within the consolidation zone between $3,365 and $3,285. The break of the ascending trendline is particularly significant, indicating that bulls may be losing control of the immediate price action.
The second chart provides valuable context with the weekly and 16-hour timeframe analysis. The pinbar rejection candle on the weekly chart confirms strong selling pressure at these elevated levels. The 16-hour chart shows multiple tests of the upward trendline, with the recent break potentially signaling a bearish impulse leg. However, the overall structure remains within the broader ascending channel, suggesting this could be a healthy correction within the long-term uptrend.
Critical levels to monitor include the $3,285 support zone and the broken trendline at $3,365. A decisive break below $3,285 could trigger a deeper correction toward $3,200, while reclaiming the upward trendline would restore bullish momentum toward new highs.
If this idea resonates with you or you have your own opinion, traders, hit the comments. I’m excited to read your thoughts!

