#DOT_#CRYPTO_#BEARISH_ShortScript still not gettng momentum after continually trading inside the parallel channel, it finally break down and printed new lower lows. Still the momentum is week and looks like it will soon test the levels marked on the chart.
#DYOR (Do your own research)
DOTUSDT trade ideas

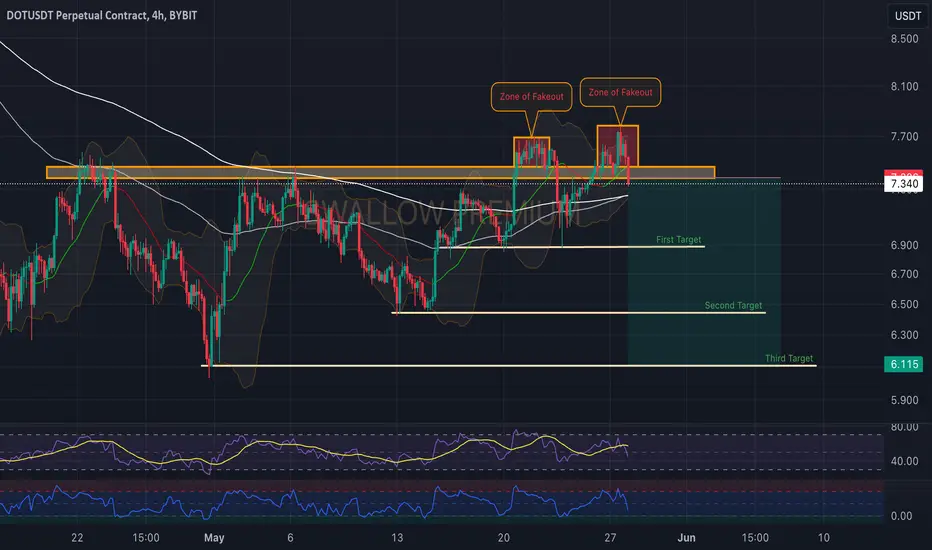
Polkadot (DOT): Another Fake-out Zone / Time To Short?Polkadot has made yet another fake-out zone, showing us the demand for downward movement here.
We are seeing a great chance of those EMAs there being touched and broken, which would result in a nice downward movement!
Swallow Team


Polkadot (DOT) Trade Analysis and StrategyPolkadot (DOT) has encountered difficulties in reclaiming the critical $7.5 resistance region, which aligns with the 200-day moving average at $7.4. The current bullish momentum appears insufficient, suggesting a possible short-term consolidation near this pivotal level. A detailed examination of Polkadot’s daily chart reveals that after a resurgence of demand near the $6.5 support level, the asset experienced a bullish surge. This movement brought DOT to a critical resistance zone defined by the 200-day moving average and the static level at $7.5.
Breaking out from this key price range could attract more demand, leading to a sustained bullish movement. However, the current price action around the $7.5 mark indicates fading bullish momentum. Buyers are facing significant challenges pushing the price beyond this resistance. Therefore, a sideways consolidation or slight rejections are likely before the next decisive move.
In this scenario, the $6.4 level will be the primary support in the mid-term. Should DOT retrace to this level, it will be crucial to observe the market's response. A strong rebound from this support could renew bullish efforts to break the $7.5 resistance. Conversely, a failure to hold the $6.4 support could lead to further declines, necessitating a reassessment of the asset's short-term outlook. As the market navigates this critical juncture, traders should monitor these levels closely and adjust their strategies accordingly.

Ascending Triangle Pattern : Polkadot to the moon Looking at the chart if you're familiar with the pattern it's self explanatory .
My entry was 7.5 . Knowing this pattern we'll probably see 14 or 20 going forward.

POLKADOT Are you ready to move 30% ?Polkadot: Coiling for a Breakout?
Polkadot, the interoperable blockchain platform, has been exhibiting a relatively slow and steady price movement in recent weeks. This methodical approach, however, could be laying the groundwork for a significant breakout.
Price Action and Support Levels
After forming a well-defined box pattern, Polkadot has established an ascending trendline that is currently acting as support. This consolidation phase has allowed the bulls to gather strength and prepare for a potential surge.
The key resistance level to watch is $7.6. A decisive break above this level could trigger a rapid upward movement, potentially pushing Polkadot towards its first target of $8.7.
Bullish Momentum and Potential Targets
The recent break of the downtrend line and positive technical indicators indicate that Polkadot is ready to break. The bullish momentum could further accelerate if the price manages to hold above the $7.6 support level.
With the downward trendline out of the way, a $10 target is not out of the realm of possibility. This ambitious target could be achieved if Polkadot continues to demonstrate strong buying pressure and positive market sentiment.
Potential Pullback and Overall Outlook
While the bullish outlook is promising, it's important to acknowledge the possibility of a pullback to the $7.6 support area before the continuation of the upward trend. Such a pullback would be a healthy retracement and could provide an opportunity for new buyers to enter the market.
Overall, the technical analysis suggests that Polkadot is in a favorable position for a breakout. The price action, support levels, and technical indicators all align with a bullish scenario. However, as with any investment, it's crucial to exercise caution and conduct thorough research before making any trading decisions.

$DOTBINANCE:DOTUSDT
LONG
LEVERAGE
TARGET 1 - 7.500
TARGET 2 - 8.500
TARGET 3 - 9.800
DOT formed a potential ascending triangle pattern on the daily timeframe. Full send after a breakout

DOT/USDTHello everyone, welcome to a quick review of the DOT chart. As we can see on the chart, we are locally moving along a downward trend line. After unfolding the fib retracement grid, you can see the price staying above the strong support level at $7.04, then the support level at $6.73, and then the strong support level at $6.44. Looking the other way, you can similarly identify resistance points. And here we can see the resistance at the level of $7.17, the next important place is $7.40, after which we will be able to see an upward movement towards the resistance at the price of $7.77.


#DOT, Amazing bull wave is occuring, Never miss this tradersWelcome, Trader. Welcome to our cryptocurrency community! 🚀We are delighted to welcome you, whether you are an experienced trader or a newcomer to cryptocurrency.
We are going to discussing #DOTUSDT 💹👉✅
#DOTUSDT 🔥🚀
-----------
Update:
#DOT is moving upside over a 8 hr time frame. It is forming an ascending channel pattern which is a bullish sign as well.
Expected move from this point is minimum of 45% 💰for the mid long term.
Crypto Analyst Hub👉✅

DOT/USDT 4HInterval Chart ReviewHello everyone, let's take a look at the DOT to USDT chart on a 4-hour time frame. As you can see, the price is moving in the upward trend channel, at its upper limit.
Let's start by determining the support and as you can see, the first support in the near future is $7.31, if the support is broken, the zone from $7.07 to $6.89 is visible, then we can go down to the level of $6.67 and then in In the event of a bottom exit from the upward channel, the drop may result in a price around $6.
Now let's move on to the resistance line, as you can see the first resistance is $7.39, if it manages to break it, the price will have to break the resistance zone from $7.68 to $7.89 and then it will move towards the resistance at the price of 8.17 $.
Looking at the EMA Cross 20 and 50, they indicate the return of the yellow line above the blue, which indicates a change to an uptrend. However, here it is worth paying attention to the RSI indicator, which shows how we are approaching the downward trend line, and in addition, on the STOCH indicator we are at the upper limit, which may translate into a change in direction.

Lingrid | DOTUSDT making NEW highsBINANCE:DOTUSDT chart has been demonstrating a strong uptrend, with each subsequent high surpassing the previous one. This upward momentum was evident in the recent break and close above the psychologically significant round number at 7.0. Given this momentum, it's likely that the market will continue to push upwards, potentially retesting the March highs. However, I also believe that the market may experience a brief consolidation phase before surging higher. Specifically, I expect a retracement to an even number at 7.0, followed by a renewed upward move. Noticeably, the market has recently formed a long-tailed bar by taking liquidity below the support level, which suggests a potential bullish move. My goals is a support level at 7.90.
Traders, if you liked this idea or if you have your own opinion about it, write in the comments. I will be glad 👩💻

Polkadot (DOT): Fakeout Near Resistance / Shorting?Polkadot caught our attention with its price, showing some signs of a fakeout near the resistance zone (which was broken but not secured).
As we are forming a fakeout here, we are also looking for potnetial downward movement here, so eyes open!
Swallow Team

Polkadot - higher time frame setupWe are looking for a higher time frame play on DOT. We believe the recent setback provides a good opportunity to place our first entry. If the price drops further, potentially due to news or other factors, we plan to place a DCA (Dollar-Cost Averaging) bid below the current daily demand zone.
The daily demand zone should hold; otherwise, the bullish count would be invalidated, and we could see lower prices. The target is not specified yet as we are waiting for the market to show us potential levels.
From the chart, we can see the following key points:
- The daily demand zone around $7.17-6.88 is crucial for maintaining the bullish structure.
- The next significant resistance lies in the daily supply zone between $8.58 and $9.11.
Let's see how this plays out as the market evolves. ✅

DOTUSDT - Looks Bearish on Hour timeframeKey levels are defined on the chart.
I am expecting another LL because it has already created one LH.
Their is no sign for trend reversal on short term. Expect for Short entry if it break SL.

DOT - Daily Shortterm Trend & Support/Resistence Trade Signal - DOT - Daily Shortterm Trend & Support/Resistence Trade Signal - 23 May
DOT now completed a correction and are ready to return to gain higher.
The new opportunity at the current price
🟢 Trend: Bullish 🚀
🟢 Support: $ 5.5
🟢 Target: $ 50
------
Current: $ 7.5

DOT formed a Saxaphone patternEverytime a trend forms the shape of a ladel or a saxaphone BINANCE:DOTUSDT , it usually means an imminent sell off. So if price bounces off of the symetrical tirangle, then great, it's just a retest...but if price falls below $7.20 and then again below $6.90 it will be major capitulation down to the lower $5.00 range.

DOT a False Breakout?The symetrical triangle that formed at the end of the recent downtrend was optimistically viewed by many as a potential trend reversal. Then the news of a possilbe approval for an ETH ETF after tweets by the SEC caused a breakout.
A re-test of teh symetrical triangle around $7.20 is a possible scenario, however, if after the retest price does not hold above $6.90, then the recent spike in price will prove to be a false breakout.

DOT READY TO BOOM AFTER A PULLBACK!!
#Polkadot it failing to flip the local resistance into support. We have a monthly POC and the 0.618 fib level below to hold as support. If we can get a bounce there, I would expect PA to push higher to try and flip the blue box into support next!
Calculate Your Risk/Reward so you don't lose more than 1% of your account per trade.
Every day the charts provide new information. You have to adjust or get REKT.
Love it or hate it, hit that thumbs up and share your thoughts below!
This is not financial advice. This is for educational purposes only.

DOT/USDT - Bearish continuation before bull runWaiting for symmetrical triangle (bearish) breakdown to buy DOT at 5$ with long term targets : 20$ - 25$ - 50$

Bullish pennant on DOTWe can clearly see that DOT is forming a bullish pennant, breakout will be happening in a few hours, and price can jump to 8$.
8$ is a very strong resistance, if that resistance will be broke, the next target will be 14$.

DOTUSDT-Bullish FlagThe cryto pair made bullish flag pattern on 1h TF. Entry can be taken at current price with SL and TP mentioned.
