Ksm to the moon ksm is ready to take off
He wants to copy the trend of Dot
Maybe he can bring you wealth
KSMUSD trade ideas

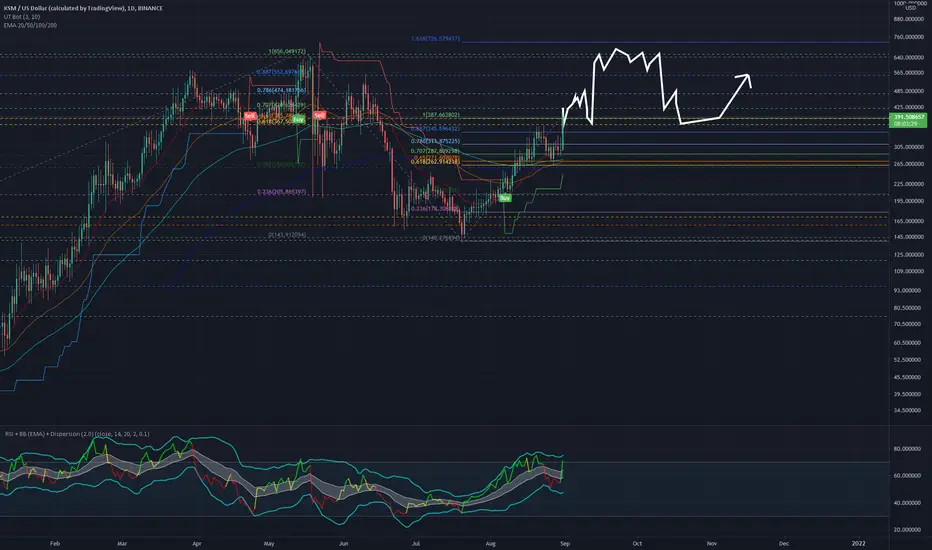
KUSAMA-vol. is heading down so consolidation on top of previous range is probable.
-it is also consolidating on top of of bearish control zone in rsi
=if it breaks down back in range on a pattern failure then than expect support on bottom of range, then if it breaks down from there, expect a move up for the retest and then a resumption down to the measured move of the triagle medium term
- need to wait and see before any further analysis

KSM Coin Pullbacks From The 200-EMAThe daily technical chart and price trend of Kusama coin show a bullish trend. Based on the pivot point, the first support zone is 255.0 USD. Another way to watch it is that if it rushes, the resistance level to look at is 430.0 USD. Therefore, the chart created a shooting star candlestick pattern during the day, and the cost is confident that it will reverse downside with unwavering medium strength.

KSM/USDT - Potential 86% investment setupHello Traders!
KSM is a test network for Polkadot projects. In the coming months, a new parachain auction will be held, which will again draw attention to the asset.
A correction in the market opens up additional financial opportunities.
The first part of the position can be bought in the range of $286 - $328
The second part is in the range of $208 to $241.
Stop loss at $178
Target prices for buying will be
$388
$435
$488
Good luck and watch out for the market
P.S. This is an educational analysis that shall not be considered financial advice

KSM Symmetrical Triangle situationOn a 1 hour chart, KSM appears to have formed a Symmetrical triangle, a series of declining Maxima and increasing Minima. And it's getting quite close to the Apex (pointy end of the triangle).
It might Breakout Up or Down, so far I'm only speculating about the magnitude of either Breakouts, approximately 25%. What's also important, one of the sides of the triangle is Long term Support.
In the mean time, 1H RSI is heading towards OVERBOUGHT territory, and I'm planning to ladder in a SHORT position when RSI Crosses 70. Making sure MACD is flattening, wouldn't want to get caught in the Breakout.
BINANCE:KSMUSDTPERP
FTX:KSMPERP


kusama - now or later or never? 🤔
kusama, Are a bird that can fly when the others fall 😁
according to the price movement and time cycles, the next target is a new high in November 2020.
If you are a risk taker, buy this currency now.
But the safe area to buy is after the break of $630 line.
what do you think?
Buy now or later or never?
_________________
'' See the analysis of others, but trade according to your decision. ''
<>

Kusama Bullish Short-TermKusama,
-Broke out of gaussian channel and back tested the top as support (White circle)
-Broke out of descending resistance (White line)
-RSI broke out of descending resistance and back tested resistance as support (White box)
-Formed a cup and handle pattern on the daily, Target is $695
*Note*
-Potential for a back test of the white resistance line as support before meeting the cup and handle target.

🎎🗾 KUSAMA - 5 Hours Later 🏄 40%+ TodayKusama chart was my 'breakfast opportunity' as I like to call them. Take a look at the charts early every day and look for the one that looks more promising.
Kusama was exacty that and is now 40% higher today.
So, here is our chart and our take profit levels for you all.
Hope it goes well for all.
One Love,
the FXPROFESSOR

KSM FIB price prediction KSM FIB price prediction KSM FIB price prediction KSM FIB price prediction KSM FIB price prediction KSM FIB price prediction
KUSAMA - Updated Chart 👍🏻Price has breeched over Resistance (which is now support).
What you see as a yellow line (level) is the most important linear trend line and it's considered to be as strong as it gets.
This calls for a buy with a stop loss below the yellow level at 330$
Hope it helps,
the FXPROFESSOR

🎎 KUSAMA- Breaking Over Resistance right Now!!! 🗾🗻🍊Over resistance, will check it as support, if that happens I am BUYING again
Kusama has had great news today :
Following the success of its first six parachain auctions, Kusama – Polkadot’s Canary network, goes ahead and announces the dates and details for the next 5 auctions.
Kusama Goes Ahead With 6 More Parachain Auctions
According to materials shared with CryptoPotato, Kusama will schedule the next five parachain auctions on its network.
The dates for them, as per the current recommendations, are as follows:
2021/09/01, 12:00 GMT: Sixth Kusama Parachain Slot auction commences. Bids may be placed.
2021/09/03, 09:00 GMT: Sixth Kusama Parachain Slot auction ending period begins. Only bids made before this point will certainly be considered in the final result. Bids made following this point have a linearly reducing chance of being considered.
2021/09/08, 09:00 GMT: Sixth Kusama Parachain Slot auction bidding ends. No bids may be made on this auction following this point.
2021/09/08, 11:00 GMT: Sixth Kusama Parachain Slot auction winner selected. The auction winner is determined as the highest bidder at some randomly selected point over the past five days.
2021/09/08, 12:00 GMT: Seventh Kusama Parachain Slot auction commences.
– 2021/09/15, 12:00 GMT: Eighth Kusama Parachain Slot auction commences.
– 2021/09/22 12:00 GMT: Ninth Kusama Parachain Slot auction commences.
2021/09/29, 12:00 GMT: Tenth Kusama Parachain Slot auction commences.
The idea of the schedule is to enough members of the Kusama community enough time to: first unstake KSM for their auction bids and second – to participate in the crowd loans.
The auctions will commence back-to-back with a two-day period of the initial bidding, which will be followed by a five-day ending period – this is how the first auctions were done.
One Love,
the FXPROFESSOR

KSM to $2 Is Very Probable.KSM is in quite the range right now and if we don't get back above $246 soon we could be looking forward to alot of pain on this coin in the future.
The bulls most hold the 0.886 as support and if it it fails then the only remaining place to go would be the 1.13 all the way down at $2.07 I lean mostly bearish on this one until it proves itself.

KSM going to $108 supportSurprised this has taken such a hit after the parachain auctions. But $108 looks likely to be tested

KUSAMA- Out of Steam/ I am OutKusama was fun for while it lasted. Probably we could say the same for Polkadot and it's theory of games. I feel both Kusama and Polkadot will underperform versus both Ethereum and Cardano.
Was fun and profitable going in and out but right now I am out alltogether.
One Love,
the FXPROFESSOR

Kusama (KSM) - July 3Hello?
Welcome, traders.
By "following", you can always get new information quickly.
Please also click "Like".
Have a good day.
-------------------------------------
(KSMUSD 1W Chart)
If it moves above the 225.6 point and moves along the uptrend line, I would expect it to turn into an uptrend.
(1D chart)
If the price is maintained in the 199.93884255-292.55684530 range, it is expected to turn into an uptrend.
If it goes down, you should check to see if it finds support at the 153.62984396-199.93884255 zone.
If it falls from the 134.63247414 point, it is likely to enter the mid- to long-term investment zone, so you need to trade cautiously.
-------------------------------------
(KSMBTC 1W chart)
To continue the uptrend, the price must rise above the 0.006193 point to hold the price.
(1D chart)
It must rise above the 0.006898 point to turn into an uptrend.
In particular, it is important to maintain the price above the 0.006193 point.
If it goes down, you should see support at the 0.004715 point.
If it falls from the 0.004715 point, it is likely to enter the mid- to long-term investment zone, so you need to trade cautiously.
------------------------------------------
We recommend that you trade with your average unit price.
This is because, if the price is below your average unit price, whether it is in an uptrend or in a downtrend, there is a high possibility that you will not be able to get a big profit due to the psychological burden.
The center of all trading starts with the average unit price at which you start trading.
If you ignore this, you may be trading in the wrong direction.
Therefore, it is important to find a way to lower the average unit price and adjust the proportion of the investment, ultimately allowing the funds corresponding to the profits to regenerate themselves.
------------------------------------------------------------ -----------------------------------------------------
** All indicators are lagging indicators.
Therefore, it is important to be aware that the indicator moves accordingly with the movement of price and volume.
However, for the sake of convenience, we are talking in reverse for the interpretation of the indicator.
** The wRSI_SR indicator is an indicator created by adding settings and options to the existing Stochastic RSI indicator.
Therefore, the interpretation is the same as the traditional Stochastic RSI indicator. (K, D line -> R, S line)
** The OBV indicator was re-created by applying a formula to the DepthHouse Trading indicator, an indicator disclosed by oh92. (Thanks for this.)
** See support, resistance, and abbreviation points.
** Support or resistance is based on the closing price of the 1D chart.
** All descriptions are for reference only and do not guarantee a profit or loss in investment.
Explanation of abbreviations displayed in the chart
R: A point or section of resistance that requires a response to preserve profits.
S-L: Stop Loss point or section
S: A point or section where you can buy to make a profit as a support point or section.
(Short-term Stop Loss can be said to be a point where profit and loss can be preserved or additional entry through split trading.
GAP refers to the difference in prices that occurred when the stock market, CME, and BAKKT exchanges were closed because they are not traded 24 hours a day.
G1 : Closing price when closed
G2: Opening price
(Example) Gap (G1-G2)

ksm to 400ksm shows a pretty clear wyckoff re distribution pattern that could be on phase c , it created a spring showing a fractal accumulation pattern in the lower timeframes, so this could be one of the best entry points possible on this asset.

Kusama back to $400 mid July 2021Kusama is currently inside a small bull flag under long term support line turned resistance. Upon breakout, price will break resistance all the way up to long term resistance like formed by previous tops

KSM .786 Retracement with Bullish DivergenceKSM has made a .786 retracement with bullish divergence on the daily MACD


KSM: Bullish Descending Wedge + 4H Hidden Bullish Divergence KSM has formed a bullish descending wedge structure that should begin to consolidate sideways and then breakout to the upside considering we are above the 0.5 Fib Retracement line which is where you look for bullish chart patterns for a continuation of previous trend which is up.
The other noteworthy chart pattern a trader should look for is Hidden Bullish Divergence - which we have found on the 4H chart.
Also - something positive to see is that a previous descending wedge with Hidden Bullish Divergence occurred in February which had a consolidation period before breaking up near 70% of the pattern completion which we are at now in the current descending wedge pattern.

KSM: Bullish Descending Wedge PT1 $540KSM is in a bullish descending wedge structure on multiple timeframes and a breakout if it is to occur - which I have high confidence in considering BTC printed a 5D DragonFly Doji candle on June 10th and should last with bullish momentum for the next 3-6 5D candles.
The first target is the top of the wedge structure at $540. From here we will have to revisit our assumptions and re-evaluate BTC.
The Fibonacci Timezone suggests that June 20th is a key date and could be when we see the PT1 hit for KSM.
At current prices this trade offer 46% upside in a matter of days if target is met.
There is also Hidden Bullish Divergence on daily TF still - price made a higher low and RSI made a lower low.

KSM: Hidden Bullish Divergence Daily TFKSM's price is printing a high low on Daily TF while the RSI is showing a lower low. We can now expect a new peak to be formed (yellow box)
The most ideal place where a hidden bullish divergence can occur is at the end of a downtrend which is exactly what has happened since the June 9th downtrend!
As long as BTC holds steady expect this to play out to the upside
