XAU/USD | Gold Holds Strong and Targets Higher Levels!By analyzing the 4 hour chart for TVC:GOLD , we can see that after the bullish move earlier today, price dipped to $4040 but immediately bounced as demand stepped in. Gold is now trading around $4091.
If this momentum continues, I expect a push toward $4100, $4110, and $4130. After that, we’ll moni
About CFDs on Gold (US$ / OZ)
Gold price is widely followed in financial markets around the world. Gold was the basis of economic capitalism for hundreds of years until the repeal of the Gold standard, which led to the expansion of a fiat currency system in which paper money doesn't have an implied backing with any physical form of monetization. AU is the code for Gold on the Periodic table of elements, and the price above is Gold quoted in US Dollars, which is the common yardstick for measuring the value of Gold across the world.

Gold possible move Gold is currently bouncing from a rising trendline support around 4022–4040, indicating buyers are still active in this zone. If price holds above this support, we may see a bullish move toward the first resistance at 4089, followed by 4133. A breakout above these levels can push price toward the up

Lingrid | GOLD Complex Correction Short SetupOANDA:XAUUSD is testing the 4,150 resistance zone, where price might form a potential fake break. The move stalled right at confluence between the red long-term resistance trendline and the ceiling of the range, signaling possible buyer exhaustion. Price is now slipping back beneath the broken brea

Gold 30-Min — Volume Sell Reversal Triggered⚡Base : Hanzo Trading Alpha Algorithm
The algorithm calculates volatility displacement vs liquidity recovery, identifying where probability meets imbalance.
It trades only where precision, volume, and manipulation intersect —only logic.
✈️ Technical Reasons
/ Direction — SHORT / Reversal 4191 Area

Lingrid | GOLD Weekly Analysis: Coiled Spring at Key CrossroadsOANDA:XAUUSD price action has settled into a tense, range-bound struggle, repeatedly testing the ascending trendline that has defined its path since late October. This persistent retest is a double-edged sword: while it demonstrates underlying buying interest, it also signals exhaustion and a growi

GOLD → Neutral price channel... Waiting for news FX:XAUUSD is testing the lower boundary of the 4060 channel and rebounding, maintaining moderate fluctuations in anticipation of key US data. Focus on 4040 - 4100...
The probability of a Fed rate cut in December has risen to 74% following comments by J. Williams
The unusual situation surroundi

XAUUSDHello Traders! 👋
What are your thoughts on GOLD?
Gold continues to trade in a range-bound and choppy structure, showing back-and-forth movement with no clear directional bias in the short term.
In the current zone, price is trapped between channel resistance and key support, and a breakout from ei

Gold Buyers Regain Momentum — Aiming for 4,240 RetestHello traders! Let’s break down the current XAUUSD structure. Gold is trading within a broad ascending structure after forming a strong local bottom around the Support Line, where buyers entered the market and started to push the price higher. This upward movement follows a long corrective phase, du

SMT secret smart money signal - All you need to knowHey whats up guys, in this post I want to show you how I use SMT divergence in my own trading to filter fake breaks and catch precise reversals. This is one of those things most traders never really dig into. Once you see it properly, you will not be able to unsee it.
It was popularized by ICT, but

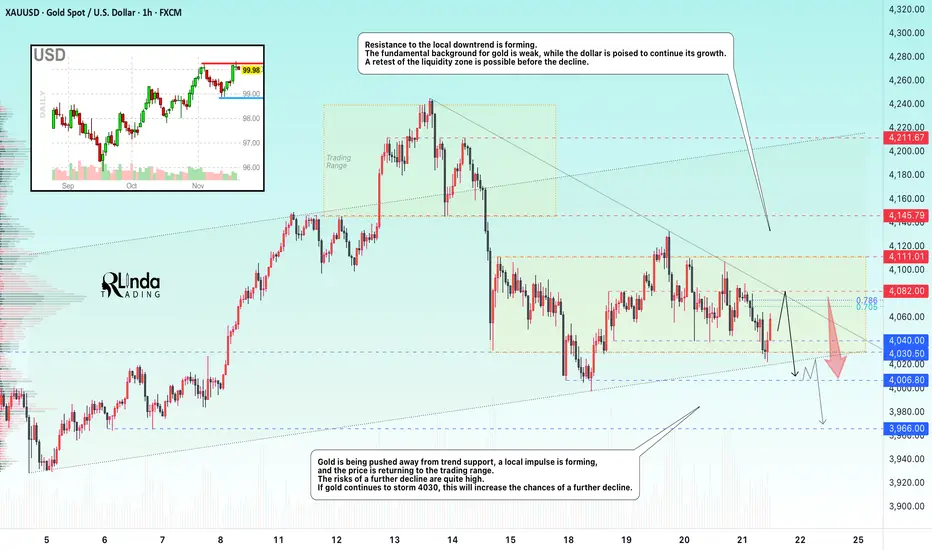
GOLD → Mixed data forms a symmetrical triangle FX:XAUUSD is bouncing off support at 4030, with bulls trying to maintain the current trend. The fundamental backdrop is currently weak for gold, which is why there are bears in the market. The PMI report is coming up...
Mixed US employment data (NFP growth to 119K, but unemployment rose to 4.4
See all ideas
Summarizing what the indicators are suggesting.
Oscillators
Neutral
SellBuy
Strong sellStrong buy
Strong sellSellNeutralBuyStrong buy
Oscillators
Neutral
SellBuy
Strong sellStrong buy
Strong sellSellNeutralBuyStrong buy
Summary
Neutral
SellBuy
Strong sellStrong buy
Strong sellSellNeutralBuyStrong buy
Summary
Neutral
SellBuy
Strong sellStrong buy
Strong sellSellNeutralBuyStrong buy
Summary
Neutral
SellBuy
Strong sellStrong buy
Strong sellSellNeutralBuyStrong buy
Moving Averages
Neutral
SellBuy
Strong sellStrong buy
Strong sellSellNeutralBuyStrong buy
Moving Averages
Neutral
SellBuy
Strong sellStrong buy
Strong sellSellNeutralBuyStrong buy
Displays a symbol's price movements over previous years to identify recurring trends.