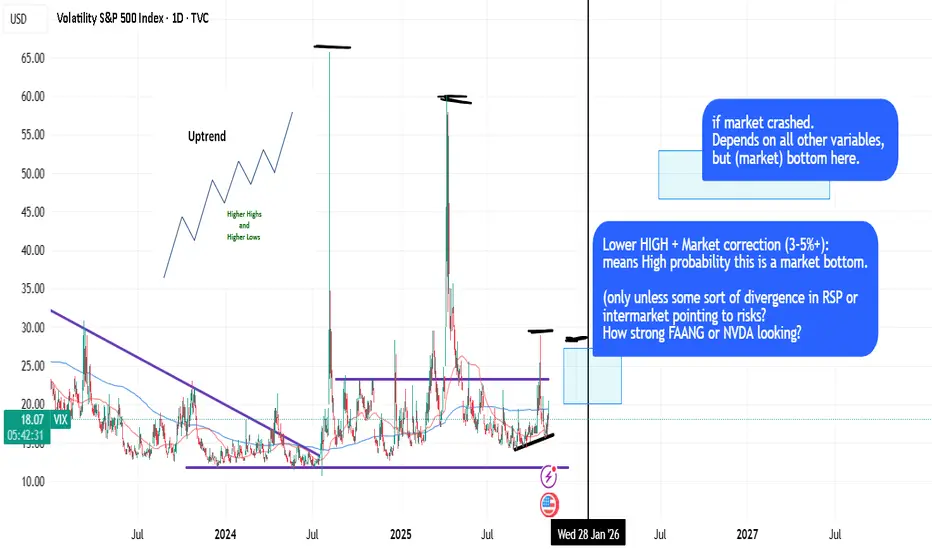
Using HLOW/LHIGH (Dow) + LOGIC to pinpoint probabilities.DOW Theory is the king of the stock market (Higher Lows, Lower Highs, uptrending, etc.) and it's quite basic concept to apply with logic.
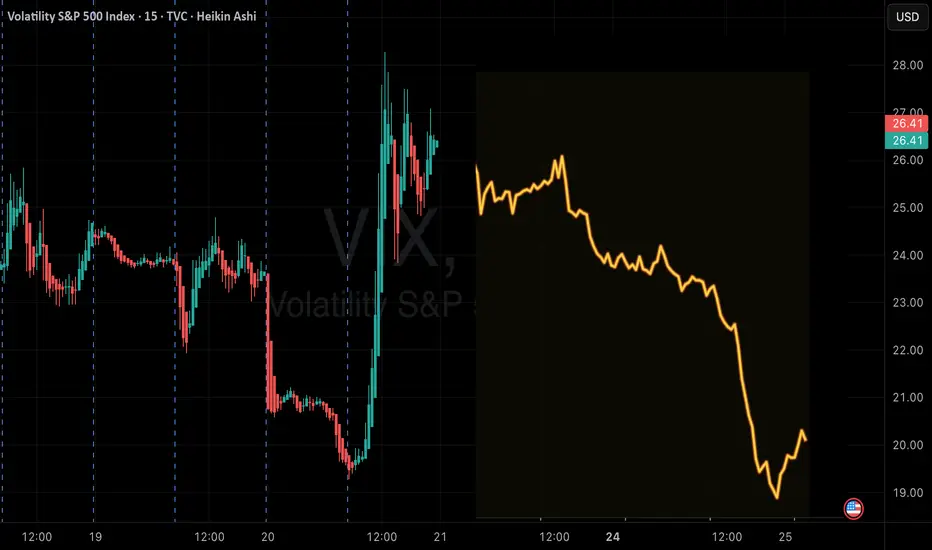
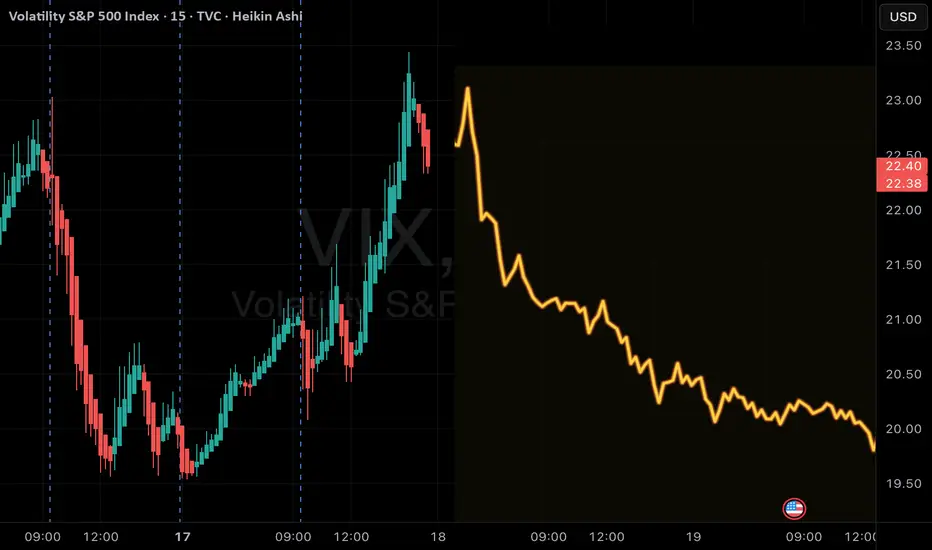
Sometimes you can time the market (based on 50dma/200dma crosses, price extensions) and LHIGH dynamics and logic -> to pinpoint probabilities. Like, look at VIX
About Volatility S&P 500 Index
VIX is the trademarked ticker symbol for the CBOE Volatility Index, a popular measure of the implied market volatility of S&P 500 index options. The VIX index has been calculated by the Chicago Board Options Exchange (CBOE) since 1993.
It is often referred to as the fear index or the fear gauge. The VIX projects a range of the expected stock market volatility over the next 30-day period. It is used by traders, institutional investors, and hedge fund managers to diversify portfolios and correlate returns.
It is often referred to as the fear index or the fear gauge. The VIX projects a range of the expected stock market volatility over the next 30-day period. It is used by traders, institutional investors, and hedge fund managers to diversify portfolios and correlate returns.
Related indices
QuantSignals Predicts Volatility CrushTicker: VIX
Current Price: 20.00
Trend: Bearish
Confidence: 75%
Volatility: 167.8%
Katy AI forecasts a significant volatility compression, projecting the VIX to drop toward 15.90, a -20.48% expected move.
📈 AI Price Predictions
30-Min Target: 20.06 (+0.30%)
Final Prediction: 15.90 (-20.48%)
The
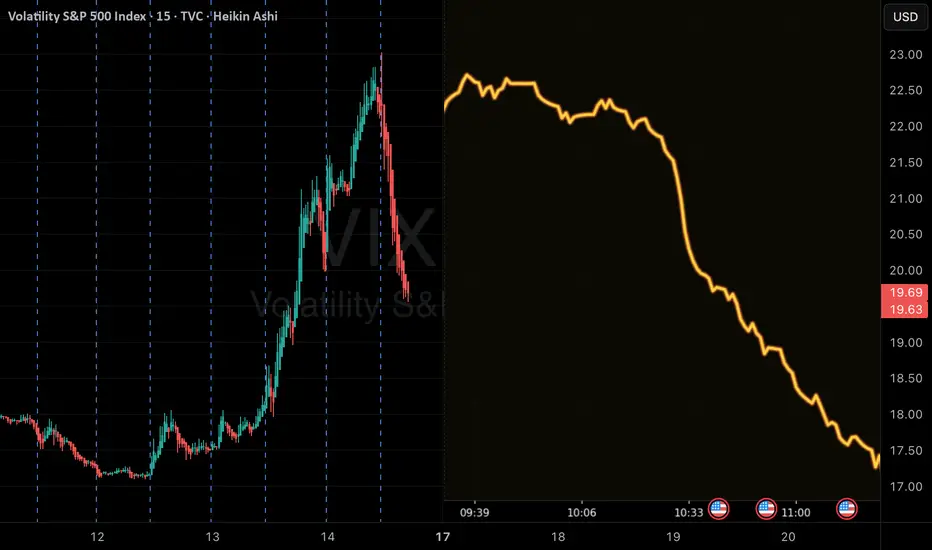
VIX upVolatility is coming back significantly. VIX (Volatility) making higher lows and frequency of spikes upwards increases, something is coming, be warned! A major sell-off in stocks would be healthy and normal after 13 years of bull market. BUY Gold instead now, or UVIX or VXX and thank me later :)

USE THE VIX TO TRADE BETTERSince the market has been a bit crazy lately, it's a good time to teach everyone about the VIX (Fear/Volatility Index) and how to use it to make your trading better.
In this video, I show you how I organize the VIX and use it every day to make my day trading and swing trading more adaptable to an e

Vix to 28Not a big fan of price patterns on vix but this looks like a confirmed cup with handle. Nice bear divergences as RSI passes through the solid red line price should accelerate to the 28.00 target
. Hourly chart

QuantSignals V3: VIX Poised for Potential Pullback – Handle WithVIX Weekly | QuantSignals V3 | 2025-11-20
Direction: PUT (Bearish)
Confidence: 58%
Expiry: 2025-11-28 (8 days)
Strike Focus: $23.00
Weekly Momentum: BEARISH (-1.17%)
Flow Intel: Neutral
Entry Price: Market (illiquid options)
Target 1: Price-dependent
Target 2: Price-dependent
Stop Loss: $2
QuantSignals V3 | High-Probability VIX OptionsVIX Weekly Signal | 2025-11-17
Direction: BUY PUTS
Strike: $20.00
Entry: $0.00 (requires live price discovery)
Target 1 / 2: $0.10 / $0.20
Stop Loss: $0.00 / $20.13
Expiry: 2025-11-21
Confidence: 60% | Medium
Weekly Momentum: BEARISH (-4.02%)
Technical Notes: Slight bearish bias; support $18.97, re
VIX Bullish - What does this mean for our NQ (NAS100) Short?Elite Analysis
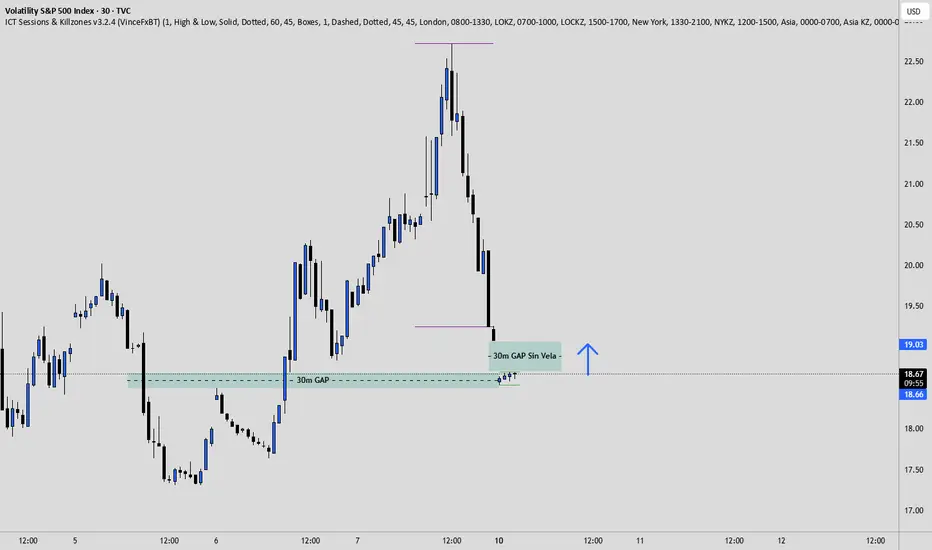
Chart Context: VIX 30m
Price just tapped into a 30-minute gap (FVG) and reacted cleanly.
That gap (marked in green) is acting as a demand zone for volatility.
Each time the VIX bounces from a demand/FVG zone like this → volatility increases → equities (SPX, NASDAQ, US30) tend to d
$VIX: IT IS BASING While it's debatable if we can consider an IHS, it certainly appears to be consolidating for an upswing.

QuantSignals V3: High-Confidence VIX DowntrendVIX QuantSignals Katy 1M Prediction (2025-11-19)
Current Price: $22.40
Trend: Bearish
Confidence: 75%
Volatility: 94.1%
Final Prediction: $20.98 (-6.34%)
30-Min Target: $21.10 (-5.81%)
Trade Signal:
Direction: PUT
Entry: $22.40
Target: $21.26
Stop Loss: $22.74
Expected Move: -6.34%
Summ
See all ideas
Summarizing what the indicators are suggesting.
Oscillators
Neutral
SellBuy
Strong sellStrong buy
Strong sellSellNeutralBuyStrong buy
Oscillators
Neutral
SellBuy
Strong sellStrong buy
Strong sellSellNeutralBuyStrong buy
Summary
Neutral
SellBuy
Strong sellStrong buy
Strong sellSellNeutralBuyStrong buy
Summary
Neutral
SellBuy
Strong sellStrong buy
Strong sellSellNeutralBuyStrong buy
Summary
Neutral
SellBuy
Strong sellStrong buy
Strong sellSellNeutralBuyStrong buy
Moving Averages
Neutral
SellBuy
Strong sellStrong buy
Strong sellSellNeutralBuyStrong buy
Moving Averages
Neutral
SellBuy
Strong sellStrong buy
Strong sellSellNeutralBuyStrong buy
Displays a symbol's price movements over previous years to identify recurring trends.
Frequently Asked Questions
The current value of Volatility S&P 500 Index is 26.41 USD — it has fallen by −4.17% in the past 24 hours. Track the index more closely on the Volatility S&P 500 Index chart.
Volatility S&P 500 Index reached its highest quote on Oct 23, 2008 — 96.40 USD. See more data on the Volatility S&P 500 Index chart.
The lowest ever quote of Volatility S&P 500 Index is 8.56 USD. It was reached on Nov 24, 2017. See more data on the Volatility S&P 500 Index chart.
Volatility S&P 500 Index value has increased by 37.42% in the past week, since last month it has shown a 15.20% increase, and over the year it's increased by 63.13%. Keep track of all changes on the Volatility S&P 500 Index chart.
Volatility S&P 500 Index is just a number that lets you track performance of the instruments comprising the index, so you can't invest in it directly. But you can buy Volatility S&P 500 Index futures or funds or invest in its components.