Binhuseyn
EssentialASAN NYSE:ASAN has formed a classic Cup & Handle pattern and has broken above the neckline, turning previous resistance into new support. However, the price is still trading below both the 50 and 200 SMAs, which calls for cautious confirmation. 📌 Entry: Wait for a confirmed retest of the breakout level (new support) with healthy volume. 🔒 Stop Loss...
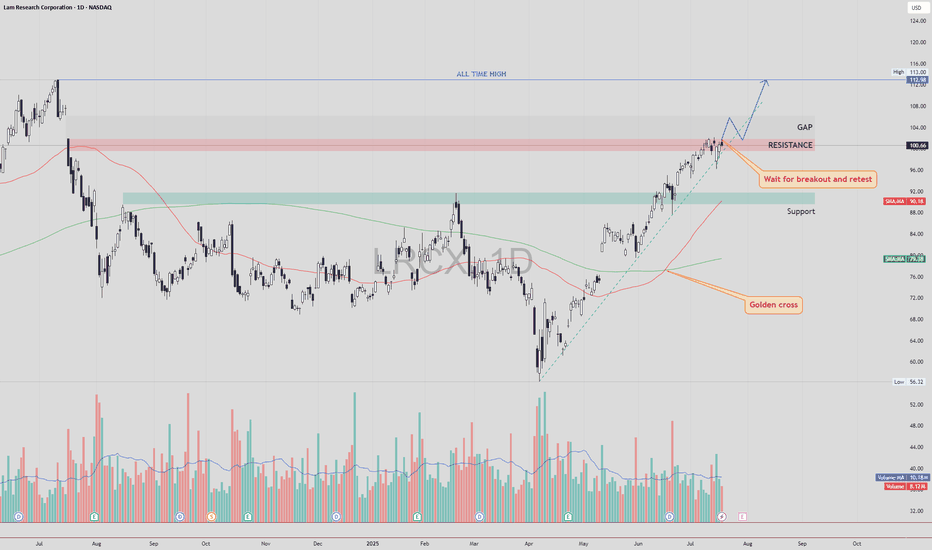
LRCX NASDAQ:LRCX is currently trading just below a key resistance zone, supported by strong bullish momentum and a confirmed Golden Cross formation. 🔍 Technical Scenario There is a high probability that price may fill the gap above without retesting the current resistance. After the gap is filled, we could see a pullback to retest the previously untouched...
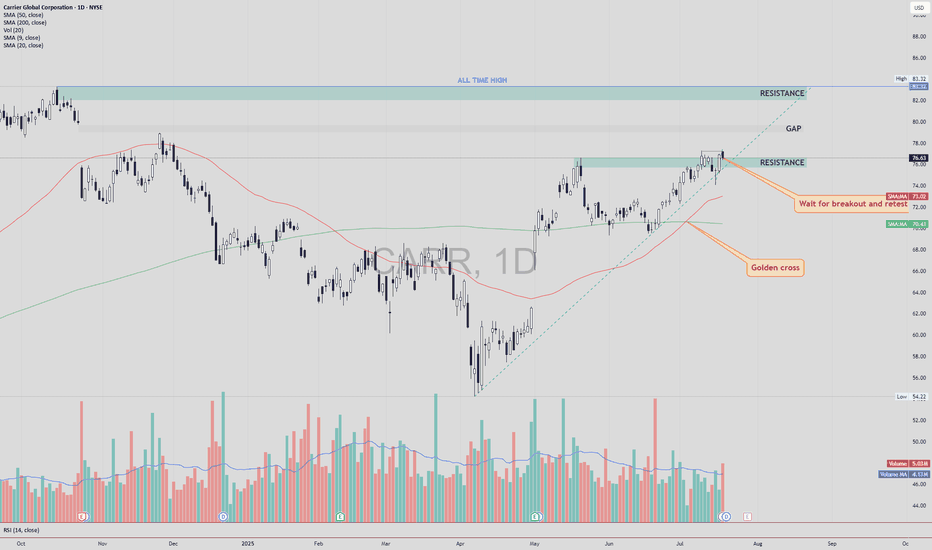
Carrier Global NYSE:CARR has closed above a key resistance zone near $76.50–$77.00 , indicating a possible breakout setup in progress. This move comes after a Golden Cross , where the 50 SMA crossed above the 200 SMA — a long-term bullish signal. 🔍 Technical Highlights: ✅ Golden Cross: Bullish momentum building. ✅ Breakout level: Price broke above...
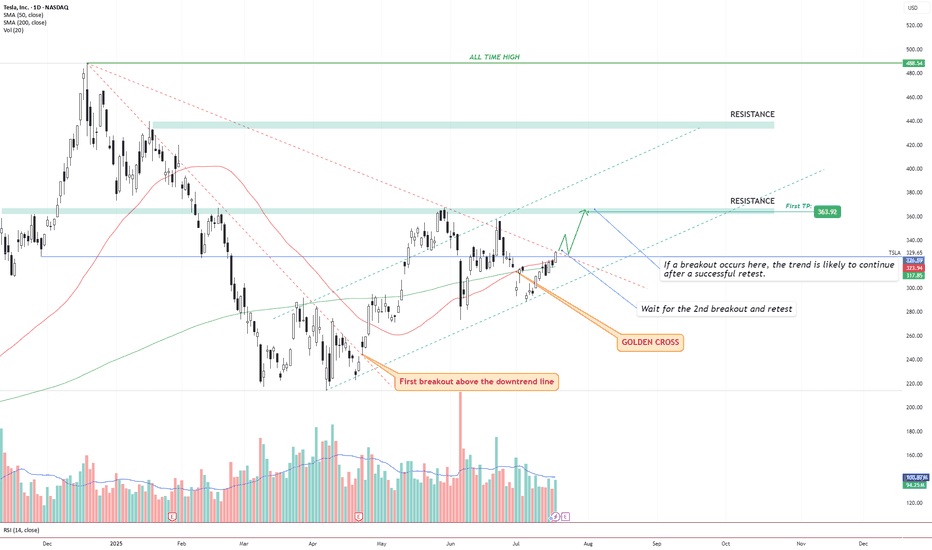
Idea Text: Tesla NASDAQ:TSLA has recently printed a powerful Golden Cross , where the 50 SMA has crossed above the 200 SMA — signaling a potential long-term bullish shift in trend. But price action shows more: We’re observing a dual-breakout structure, where the first breakout above the long-term downtrend line has already occurred (see orange label), and...
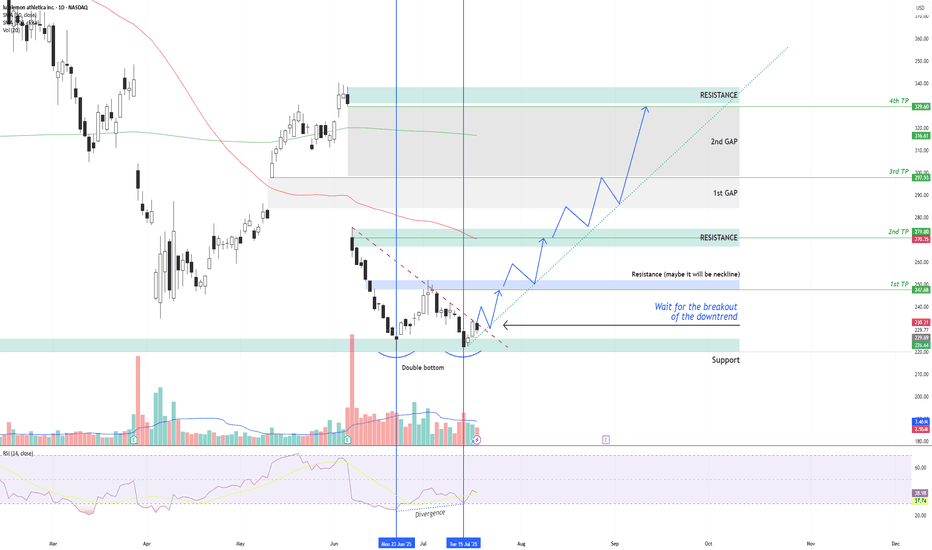
LULU NASDAQ:LULU is showing signs of a potential bullish reversal after forming a double bottom structure around the $220 support zone , along with a bullish divergence on the RSI indicator. Two vertical lines highlight the divergence: while price made a lower low, RSI formed a higher low – indicating a possible momentum shift in favor of...
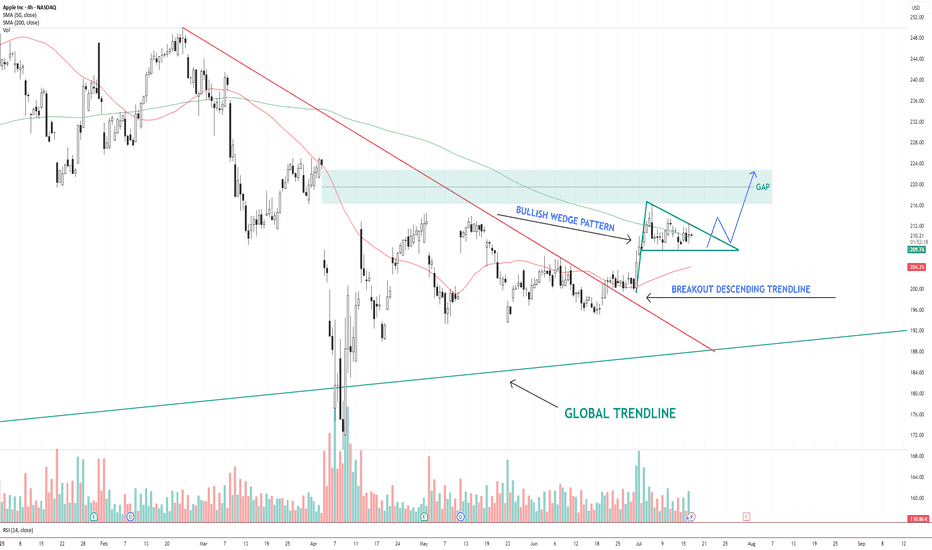
AAPL NASDAQ:AAPL has broken out of a descending trendline and is now consolidating inside a bullish wedge pattern . Price is holding above the 200 SMA and hovering near the 50 SMA. The structure suggests a potential breakout above the wedge, with a clear gap area between $216–$224 acting as the next upside target. Key levels: Support: $206 (wedge...
Intel NASDAQ:INTC has broken above previous resistance and a descending trendline, confirming a bullish reversal. Price is currently respecting an ascending channel and forming higher highs and higher lows. The breakout retest around $22.50 has held as new support. If the current structure remains intact, price could continue toward the $26.00–$26.50 ...
SMCI formed a strong bullish impulse followed by a bull flag pattern. A breakout above the flag structure may signal continuation if confirmed with strong price action. Trade Plan: • Entry: On breakout or retest • Stop Loss: Below flag support • TP1: Recent high • TP2: Measured flagpole extension This setup is worth monitoring for potential bullish...


