Forex_ViP_Signalss
PremiumThis analysis shows Gold (XAUUSD) retesting its support trendline and forming a new support zone around 3530. As long as this level holds, the chart suggests a potential bullish move targeting 3578 and a new high zone near 3611.
XAUUSD is holding above support and pushing higher, targeting the new high zone around 3530 if momentum sustains.
GBP/USD Daily Chart – Price is facing resistance at 1.3685 and showing bearish pressure. If rejection continues, it may head towards Support 1 at 1.3348, and further down to Support 2 at 1.3130.
Gold (XAUUSD) 1H chart shows a bearish setup with price facing resistance near 3345. A potential short entry is highlighted, targeting the 3323 support zone while keeping stops above 3351.
Gold (XAUUSD) is trading around 3349, showing signs of bearish momentum after multiple rejections from the upper resistance zone. Price may retest 3312 before extending lower toward the key target zone near 3270. Resistance remains strong at 3377, while a breakdown below 3312 could accelerate the downside move.
Gold is testing its support trend line near 3,376, with potential for a rebound toward resistance at 3,401. A breakout above this level could open the path to the target zone around 3,425.
EUR/USD on the 1H chart is forming a descending wedge pattern near support. A breakout above resistance could push the price toward the 1.17500 target.
Gold (XAUUSD) forms support near 3,262 with a potential bullish move expected on NFP news. Targeting 3,443 resistance zone for a quick buy opportunity.
AUD/USD faces strong resistance at 0.6620 and is showing bearish momentum. Price is expected to drop below 0.6450 with targets near 0.6178 and 0.5913, following a possible consolidation.
Bitcoin (BTC/USD) Daily Chart Analysis: Price is currently at $117,758.70, showing a slight decline. Key support levels are marked at $114,785.88 and $107,576.12, while targets are projected near $129,584.15 and $129,692.48. Chart suggests a possible upward channel, with both bullish and bearish scenarios mapped.
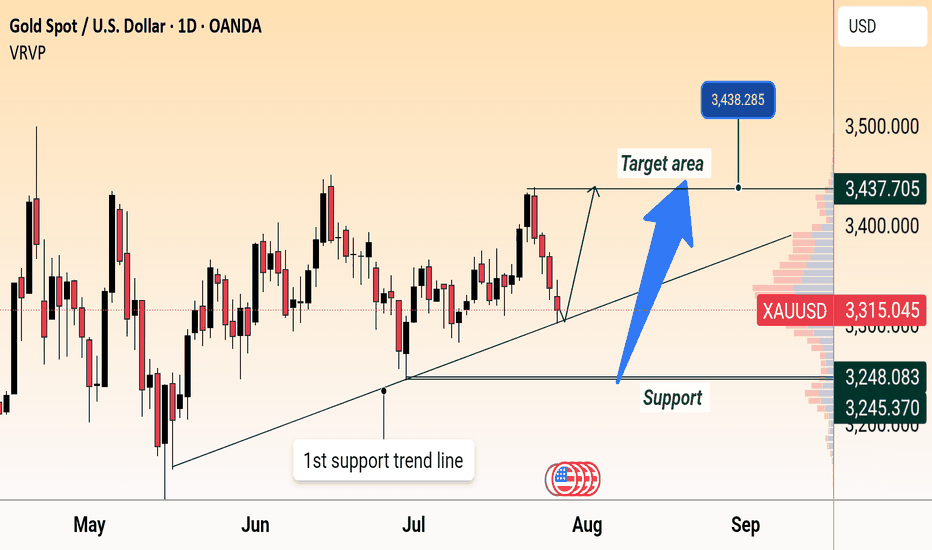
Gold (XAU/USD) is trading near $3,314, approaching support along the rising trend line. A potential bounce could target the $3,438 resistance area, as marked in the chart.
USD/JPY Bearish Breakdown Setup (Daily Chart) USD/JPY breaks below rising wedge support near 144, signaling potential downside. Price targets are marked at 138.051 (first target) and 132.480 (second target), indicating possible continued weakness if the bearish momentum holds.
XAU/USD (Gold) is forming a bearish setup on the 30-minute chart. Price is testing a resistance near 3288, with a potential reversal towards the 3236 level. Entry is marked around current price, with a stop loss at 3311 and take profit near 3237, supported by a descending channel.
AUD/USD Bearish Setup: Price is showing rejection near resistance around 0.65600 and has broken below the rising channel. A retest of the broken trendline may lead to a drop towards the support zone at 0.65307, and potentially further to the demand zone around 0.65057–0.65000.
EUR/USD is showing bearish momentum, breaking below key support with lower highs forming. Selling pressure is increasing amid a stronger USD outlook, favoring a short position.
Here's a bullish analysis on AUD/USD (generic and adaptable to most timeframes; if you want it based on a specific chart or timeframe, let me know): --- 📈 AUD/USD Bullish Analysis 1. Support Zone Holding Strong: AUD/USD has established a firm support level around where price has bounced multiple times. Recent price action shows a double bottom or rounded...
XAU/USD Technical Analysis (30-Minute Chart) This chart shows a bullish breakout setup for Gold (XAU/USD) based on recent price action and technical indicators: --- 🔻 Support Zone & Trend Line: A descending support trend line has been drawn from earlier lows, showing a falling wedge structure. The key support zone between 3,367.825 and 3,388.370 has held...
Here is a more detailed explanation of the chart analysis for XAU/USD (Gold Spot vs. U.S. Dollar) on the 30-minute timeframe: 📊 Chart Summary: Instrument: XAU/USD (Gold Spot vs. U.S. Dollar) Timeframe: 30-minute Current Price: Around 3,359.945 USD Trend: Short-term bearish correction, within a potential bullish setup 📌 Key Technical Levels: 1. Support Zone...


