It is likely that this is a mere minor pullback and the price to resume the bearish trend, following the earlier bearish breakout.. I am looking for a target at 105.25 then 104.60. Best Technician
I am looking for a bounce here as the EURUSD formed a bullish hammer candle yesterday at the bottom of the channel and the 1.271 extension. Minimum target at the channel upper trend line. Best Technician
The price hit the 50 percent retracement level for the overall bearish trend, and was rejected. We have a bearish setup confirmed if the price breaks back below the 200 days simple moving average and 1.6800 possible horizontal support. I will be shorting following the breakout. Best Techniain
Usually, falling wedge patterns are broken to the upside and signal bullish trend reversals. However, this time the GBPUSD has broken its falling edge to the downside, and that's usually followed by acceleration of the move. However, if you haven't shorted at the breakout you shouldn't chase the market, as the price is approaching a cluster of long term support...
Hello mates, I see a possible short term long trade as the EURUSD might trade sideways in the near term and possibly heading to retesting the channel resistance and the high of the long legged doji candle at 1.1187. If we break below 1.1100 I would exit any long. Best Technician
The price has broke the neckline for a double top pattern earlier. Before pulling back higher. But again price is under pressure, breaking its log scale rising trend line. I think a break below 9050 would be a trigger for a major reversal targeting 4000 areas. Best Technician
Hello friend, looks like the GBPJPY is heading to resume the downtrend. First target at the prior swing low, then the 1.271 extension and the 1.618. Best Technician
I shorted a bit early in my prior trade idea. I think we are likely to retest the lows near 50.60-51.00 area. A close today below 56.00 support should confirm it. Best Technician
NZDCAD Falling wedge reversal pattern completed earlier. Meanwhile, RSI has broken its resistance. First target is around the 200-days simple moving average near 0.8900-0.8920 area. Best Technician
NZDCHF has broken the neckline for the head and shoulders bottom pattern. And therefore the pattern is complete now. I see a first target at 0.6720 area, then 0.6810. Best Technician
CADJPY may have completed a bearish breakout below key short term support at 82.65. Looking to short target 82.05. If the price breaks back(4-hour close) above 82.70, I would consider closing short. Best Technician
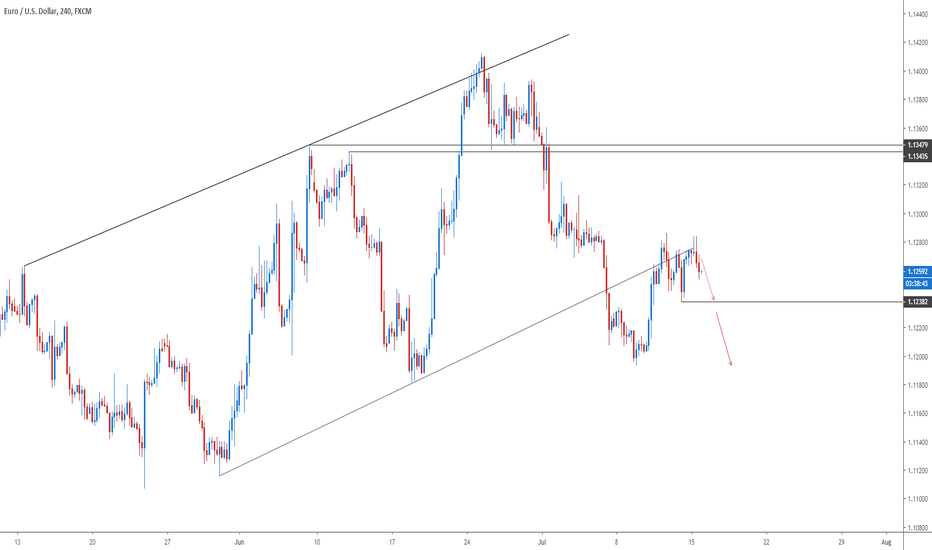
A quick short term update for the EURUSD. The price has retested the broken rising trend line where it found resistance. And double top pattern could be in the making. In my view, the price is likely to test 1.1240 support level. And a break below it will confirm 1.1200. A four-hour closing above 1.1290 will negate this scenario. Best Technician
Looks like the price has completed a pullback as it formed a shooting star candle at the broken support-turned-resistance at 1.4755. The latest swing low is the first target at 1.4640. Ultimately we could see 1.4480-1.4450 next major support area. Best Technician
I am looking for a move lower within the main bearish trend as the price may have formed a bearish flag. Targets start at latest low at 1.7855, then the 1.618 extension for the flag pullback at 1.7740. And finally 1.7615.
AUDUSD has completed a double top after breaking its neckline at 0.6955 area. Patter target at 0.8655. Best Technician
I see oil heading towards the lows again as we test juncture of 200 and 50 moving averages confluence. I see targets at 54.50 support then 51.00. This my personal view. Do your own due diligence :). Best Tech
Looks like the USD is reversing direction at least in the short term(days). A trading setup present it self and Head and shoulders bottom about to complete. If we close above the neckline at 108.50 today, target of pattern point to 110.30. Trade with care Tech
The price has completed a head and shoulders bottom on the daily chart. We just had retest to the gap which may form a near term support. Bough CADJPY at 82.54 TP1 82.91 TP2 83.59 S.L 82.19 Average Risk/Reward : 2.0 Risk of capital for trade : 1.5%


