I am thinking about a triangle pattern and strong move down , need to confirm by breaking down 2.797
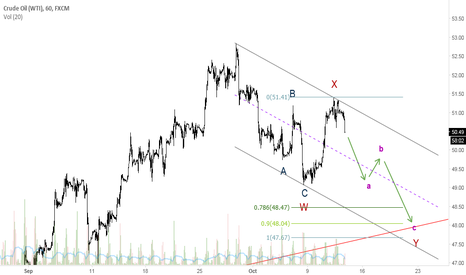
I think we are in a double ZZ wave ,now we exactly in wave 4 of c wave of the final Y wave . in this wave the price expected to touch the 38% Fibo and go up again for wave 5 . after this wave 5 end a strong move down is expected and a bearish set up can be made . keep an eye on it .
We can see the weekly chart of GOLD and compare it with the USD and JPYUSD SINCE 2014 till now : the prices of gold moving together with the JPYUSD and it move against the USD . If any one of you want to add any other factor that can affect the gold he can kindly add his comment .
kepp an eye of wheat if break above 443 . price is dancing with all Moving Averages 20,50,100,200 . the target is the upper trend .
1st target =111.64 2nd target =107.34 stop loss =114.737
On daily chart: We are trading in oversold area of RSI with a possoible positive cross on MACD below zero line in next few days . I am expecting a move up to wave B in yellow area after this falling down . Still bearish and waiting for any positive signals . I need the price to go out the down channel 1st .
9The last move is not a clear impulsive wave that I can consider it as wave 5 . I am expecting that we still in 4th wave and in an extended triangle . In this pattern we must trade below C wave , below 91.92$ then we will go in a strong move up .
I was looking to the EURUSD correction as Tringle but when applyingthe rules I found it cant be . as I am having a combination of a doublezz . I made this alternaiv count as an EXTENDED FLAT and we might go up for C waveand we might go up for C wave Price action will confirm or invalidate


