Watch me make $125 liveafter a brutal night in the markets looking to recoup from the losses I took and regain my momentum before we close the trading week tomorrow.

The best trades require research, then commitment.
Get started for free$0 forever, no credit card needed

Scott "Kidd" PoteetThe unlikely astronaut

Where the world does markets
Join 100 million traders and investors taking the future into their own hands.

BTC POTENTIAL BULLS TRAP IN DEVELOPMENTI am inspecting the 4 hour candle in comparison to the daily chart on BTC and it seem we have all the characteristics of a bulls trap on the chart. If the next 4 hours candle does not close bullish, it will confirm a bulls trap and price will likely pullback into the triangle. So be cautious trading

Gold setup: ascending triangle and Trump’s debt bombGold just formed an ascending triangle, and a breakout could send it $300 higher. In this video, we analyse the new pattern, the key breakout level, and why Trump’s new tax bill and Powell’s potential replacement could spark a major move. Will fundamentals match the technicals? Watch to find out.

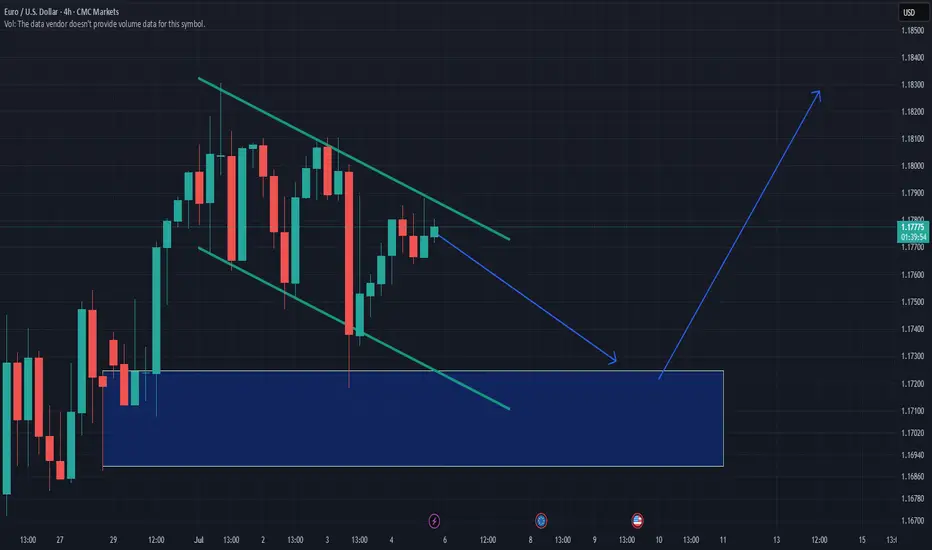
EURUSD Sell analysis/ideaThis analysis is based on the 4-hour timeframe and executed using reversal trading and trend formation. complete explanation in the video!

End of Week analysis (USDJPY)Sorry for the late video but we are looking good for another continuation day. we have some strong bullish momentum now to tap into that untapped daily wick. from there we will see some strong resistance.
Happy trading everyone hope everyone had a great week.

July 4 GOLD FIREWORKS!!!Gold bout to POP!!!! and it could be seriously huge! Im just patiently waiting for a area of entry. I have never traded a July 4th Holiday with this much clarity on what I see so this could get interesting.

Valero Breaks the DowntrendValero Energy spent more than a year in a downtrend, but some traders may think conditions have changed.
The first pattern on today’s chart is the series of lower highs between April 2024 and May 2025. VLO pushed above that falling trendline last month and has remained there since. That may suggest

EURJPY is rising to 173 for a bearish and larger pattern.EURJPY is rising to 173 for a bearish and larger pattern.
Since the beginning of March 2025, EURJPY started an uptrend and is still rising in a clear way with no signs of reversal.
As long as the BOJ has no plans to change its monetary policy statement or make any significant interventions in For

Bitcoin Fractal, increase to $116k Hi Everyone☕👋
BINANCE:BTCUSDT
Been such a long time since I posted. Today I'm looking at BTCUSDT, and I'm looking at the previous all time high cycle and what we were seeing (the pattern aka fractal).
Here's why we're likely going a little higher.
First correction of -32%
Followed by f

The market bias stays up, MJ stocks may be a buy here. The market continues to be biased up, and the target is likely the weekly B. MJ stocks are showing technical signs that a reversal may come. There may be other sectors similar as I think the summer bottom gamblers will start appearing now that everything else is at the highs. Gold looks like it will

See all editors' picks ideas
True Close – Institutional Trading Sessions (Zeiierman)█ Overview
True Close – Institutional Trading Sessions (Zeiierman) is a professional-grade session mapping tool designed to help traders align with how institutions perceive the market’s true close. Unlike the textbook “daily close” used by retail traders, institutional desks often anchor their

Open Interest Footprint IQ [TradingIQ]Hello Traders!
Th e Open Interest Footprint IQ indicator is an advanced visualization tool designed for cryptocurrency markets. It provides a granular, real-time breakdown of open interest changes across different price levels, allowing traders to see how aggressive market participation is distribu

Zigzag CandlesCan't deny that I am obsessed with zigzags. Been doing some crazy experiments with it and have many more in pipeline. I believe zigzag can be used to derive better trend following methods. Here is an attempt to visualize zigzag as candlesticks. Next steps probably to derive moving average, atr (alth

MathStatisticsKernelFunctionsLibrary "MathStatisticsKernelFunctions"
TODO: add library description here
uniform(distance, bandwidth) Uniform kernel.
Parameters:
distance : float, distance to kernel origin.
bandwidth : float, default=1.0, bandwidth limiter to weight the kernel.
Returns: float.
triangular(distance

MathConstantsLibrary "MathConstants"
Mathematical Constants
E() The number e
Log2E() The number log (e)
Log10E() The number log (e)
Ln2() The number log (2)
Ln10() The number log (10)
LnPi() The number log (pi)
Ln2PiOver2() The number log (2*pi)/2
InvE() The number 1/e
SqrtE() The n

taLibrary "ta"
█ OVERVIEW
This library holds technical analysis functions calculating values for which no Pine built-in exists.
Look first. Then leap.
█ FUNCTIONS
cagr(entryTime, entryPrice, exitTime, exitPrice)
It calculates the "Compound Annual Growth Rate" between two points i

Tape [LucF]█ OVERVIEW
This script prints an ersatz of a trading console's "tape" section to the right of your chart. It displays the time, price and volume of each update of the chart's feed. It also calculates volume delta for the bar. As it calculates from realtime information, it will not display info

Dominance Pie ChartA different type of charting, the pie chart,
here for showing the available dominance on one chart,
together with the total % dominance per ticker and between brackets
the % rise/fall.
Can be used in every timeframe
(It is normal it takes some time to be loaded)
Cheers!

Circular Candlestick ChartAn original (but impractical) way to represent a candlestick chart using circles arc.
The most recent candles are further away from the circle origin. Note that OHLC values follow a clockwise direction. A higher arc length would indicate candles with a higher body or wick range.
The Length setti

Color█ OVERVIEW
This library is a Pine Script® programming tool for advanced color processing. It provides a comprehensive set of functions for specifying and analyzing colors in various color spaces, mixing and manipulating colors, calculating custom gradients and schemes, detecting contrast, and con

See all indicators and strategies
Community trends
Tesla, Below 200 Next - The Crash Can Reach 140, 150 & 160Tesla has been bearish since December 2024 and producing lower highs since. A strong lower high happened late May with a shooting start candlestick pattern. A month later another lower high and bullish rejection with an inverted hammer.
This looks like an ABC correction with the low in March/April

Big Bounce or Breakdown? Tesla at the edgeTesla is at crossroads right now, where the next move will define its near-term trajectory.
After an extended correction phase, TSLA is reaching a key zone around the $300 level, one that held price well during recent pullbacks.
Although recent tax news caused a decline in the price, belief in Tesl

WC: 23.59 Target: 1800-2400 MOASS: 47k-100K: PROFITI am a trader...I have one goal at the end of the day: MAKE A PROFIT
This will be my final post on Gamestop as I am now dedicating ALL of my time to Macro Market Coverage...
I FIRMLY believe that there is a high potential for markets to turn SIGNIFICANTLY LOWER over the next year and plan to show

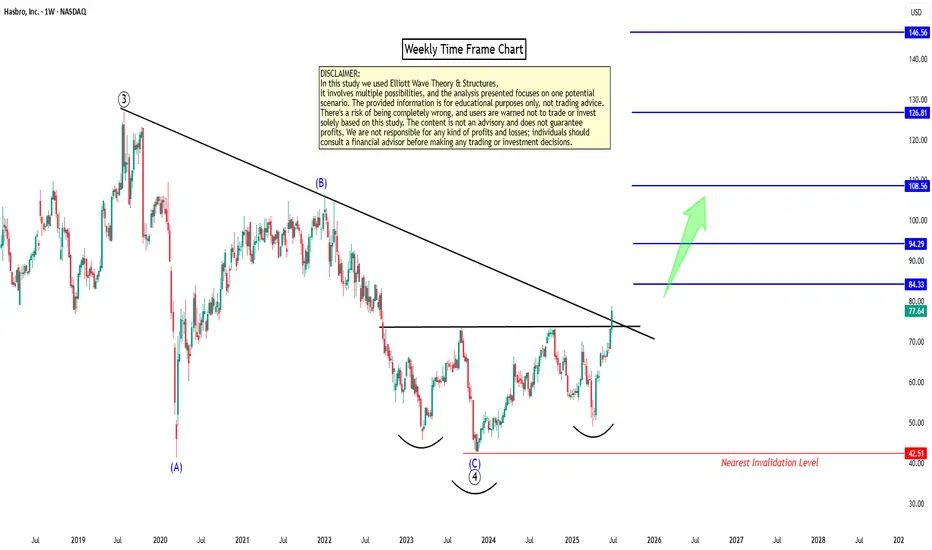
Riding the Wave: Breakout Trading with Elliott Wave AnalysisHello Friends,
Welcome to RK_Chaarts,
Today we're going Analyze the chart of " HASBRO. " to identify a trend change opportunity.(Educational Post).
Let's get started!
Today, we analyzed the weekly chart of "HASBRO" using Elliott Waves theory and chart patterns. We clearly observed that the July 20
LAES - Another Quantum Stock - What to expectHello Everyone,
Hope you all have a good Weekend. This analyze was asked by @Lukylexx and i tried to make some drawing on it.
Before the technical details , here is some basic Info about SEALSQ
Company Overview:
What they do: SEALSQ is a Swiss‐based semiconductor and security solutions compan

APPLE: 1st 1D Golden Cross in 2 years just formed.Apple is bullish on its 1D technical outlook (RSI = 67.490, MACD = 1.760, ADX = 17.850) and yesterday it started forming the first 1D Golden Cross in more than 2 years. This signals the extension of the 2nd major bullish wave of the 3 year Channel Up. The previous one made an incredible extensino to

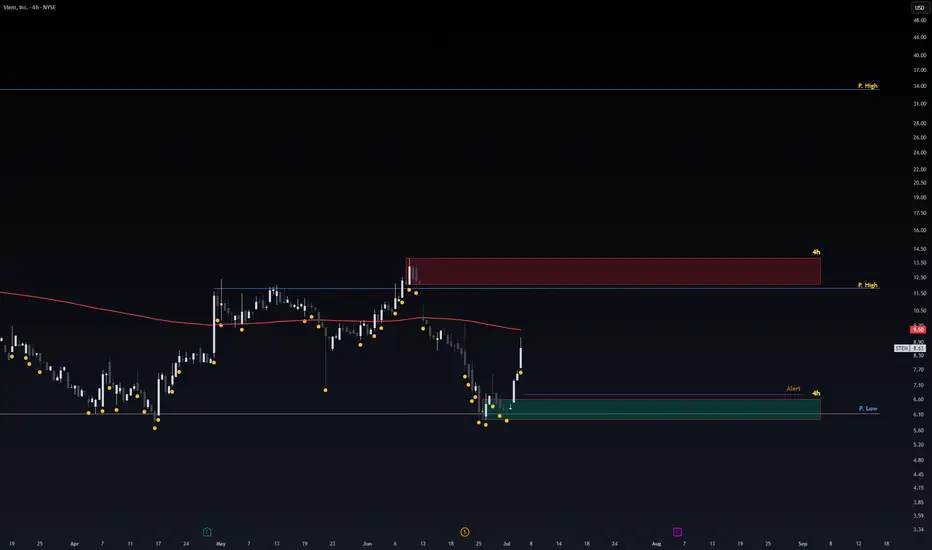
Safe Entry STEMPrice movement consolidating.
Safe Entry Green Zone.
Red Zone is Sell Zone. better watch out for any selling pressure.
P.high Lines Are Good Resitances.
Final Target 33.45$ price level.
better to wait stock and not follow.
Note: 1- Potentional of Strong Buying Zone:
We have two scenarios must
WMT : Potential Diamond Top BreakoutDiamond top pattern identified with potential breakout above $98.90 and downside support at the 9 & 20 ema of 97.47 and 97.09. Anticipated rate cuts and seasonal rotation may drive this above the breakout threshold.

Key Level and QuestionsWe have strong momentum RSI 68.81 at a key level 18.55 . Will the bulls push through the key level at 18.55 and march to next key level at 23.30 price area or will bears take price down to the 16.00 down price level?

Microsoft (MSFT) 4H Buy Signal – Rocket Booster Strategy🚀 Microsoft (MSFT) 4H Buy Signal – Rocket Booster Strategy Activates on Gap-Up, Volume Spike, and Stoch RSI Reversal 📈
-
Microsoft (MSFT) has just triggered a compelling buy signal on the 4-hour chart, with multiple layers of confluence aligning to
-
support a bullish continuation. This setup fits

See all stocks ideas
Tomorrow
BNEDBarnes & Noble Education, Inc
Actual
—
Estimate
−0.81
USD
Tomorrow
KALVKalVista Pharmaceuticals, Inc.
Actual
—
Estimate
−0.84
USD
Tomorrow
FNGRFingerMotion, Inc.
Actual
—
Estimate
—
Tomorrow
PKEPark Aerospace Corp.
Actual
—
Estimate
—
Jul 8
KRUSKura Sushi USA, Inc.
Actual
—
Estimate
−0.01
USD
Jul 8
P
PENGPenguin Solutions, Inc.
Actual
—
Estimate
0.32
USD
Jul 8
AEHRAehr Test Systems
Actual
—
Estimate
−0.02
USD
Jul 9
ANGOAngioDynamics, Inc.
Actual
—
Estimate
−0.12
USD
See more events
Community trends
BTC - Bullflag Pattern points to new ATHMarket Context
Bitcoin has been trading within a well-defined descending channel for several weeks now, respecting both upper and lower boundaries with precision (3 touches on the top, 2 on the bottom). This structure suggests an orderly pullback after a strong impulsive leg to the upside in Q2. As

Ethereum $5,791 followed by $8,500 Late 2025Ethereum is due a major, major bullish wave. No new highs since March 2024. Double-top December 2024.
The bear market ended June 2022. April 2025 marks a long-term higher low.
So the peak remains flat, March 2024 vs December 2024. While the bottom is rising, June 2022 vs April 2025.
You could say

Bitcoin - Trust the higher timeframe!⚔️Bitcoin ( CRYPTO:BTCUSD ) is still 100% bullish:
🔎Analysis summary:
For the past couple of months we have been seeing an overall consolidation on Bitcoin. But looking at the higher timeframe, Bitcoin remains in an underlying strong bullrun. Consolidations are always expected and no reason t

July Altcoin Watchlist Reversal Signals Are Heating UpHi Everyone,
The crypto market is heating up as we step into July, and the tone is shifting. After months of uncertainty, several altcoins are beginning to show early signs of structural reversal, positioning July to potentially emerge as one of the strongest bullish setups we've seen this cycle.

HelenP. I Bitcoin may correct to support level and continue growHi folks today I'm prepared for you Bitcoin analytics. If we look at the chart, the price has formed a clean upward channel after bouncing from the strong support zone at 103500 - 103000 points. This movement marked the beginning of a new bullish phase. Price continued to rise step by step, confirmi

Cardano Forming Potential Reversal Structure Inside TriangleHello guys!
Cardano’s been stuck inside this big descending triangle for months. We had a fake breakout a while back that totally failed.
Now, price is back at support and showing bullish divergence. That’s usually a sign sellers are getting tired.
If buyers step in here, I’m expecting a move bac

doggusdt (buy position)in tokan moqeiat kharid khobi dard baraye mamaleh geran espat . mantegheh khareed cpeharo moshkhs kardam veba do senario ehtamali robro npastim. cpehmeh chi vi chart moshkhs est niaz bah tozihat ezafeh nemibinam. mofegh bashid pozishen
189 / 5,000
This token is a good buying opportunity for spot tra

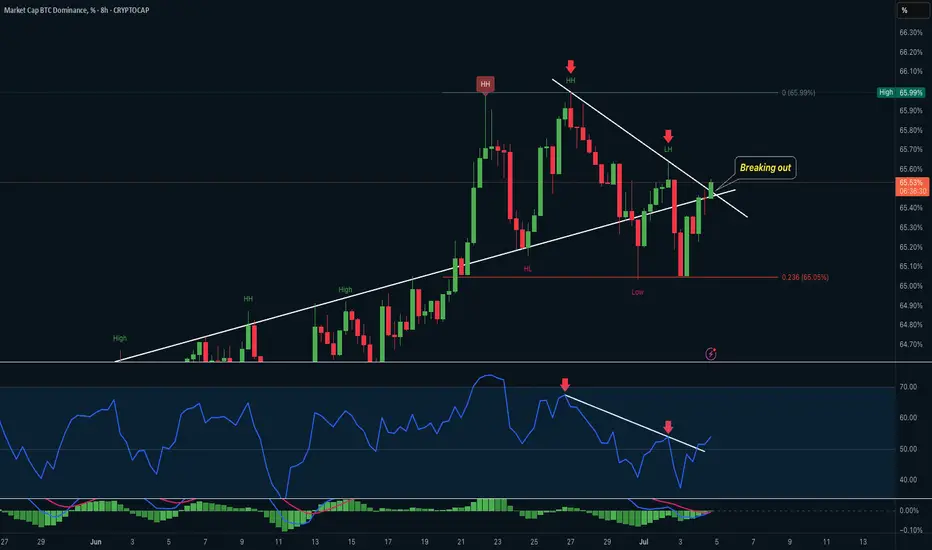
BTC Dominance & RSI – Bullish Breakout with Momentum Divergence RSI Breakout from Downtrend Line (8H)
• RSI broke out from a descending trendline after bouncing from a long-term rising support.
• This indicates a possible momentum reversal, confirming bullish divergence strength.
• The breakout is accompanied by a sharp recovery in RSI value from the
Bitcoin Elliott WaveI am currently short Bitcoin and I think the top is in
With this post, I am expressing my thoughts on where Elliott Wave stands per my perspective
In addition, I am also tracking Pitchfork of proposed wave 1 and 2. Getting out of that default pitchfork (if we drop this hard) will likely indicate t

TradeCityPro | AVAX Holds Key Support in Sideways Structure👋 Welcome to TradeCity Pro!
In this analysis, I want to review the AVAX coin for you. It’s another Layer1 and RWA project whose coin has a market cap of 7.48 billion dollars and ranks 16th on CoinMarketCap.
📅 Daily Timeframe
On the 1-day timeframe, as you can see, the price is sitting on a very imp

See all crypto ideas
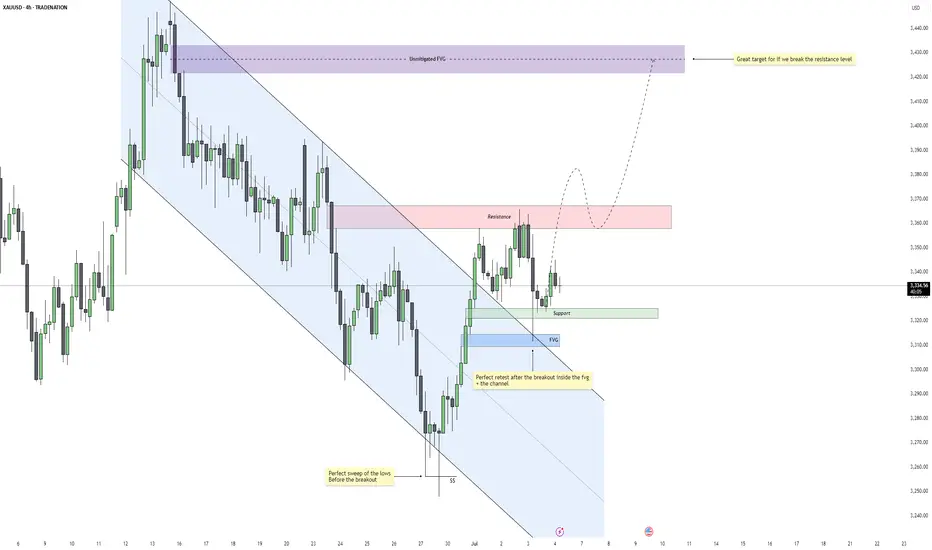
Gold – Is $3430 the Next Target After This Breakout?Gold recently completed a clean sweep of the 4H swing lows, taking out downside liquidity just before breaking out of a well-defined descending channel. This move marked a shift in momentum and structure, suggesting that the bearish leg may have concluded and the market is now transitioning into a m
GOLD → Consolidation after a trend break...FX:XAUUSD , after breaking out of a downtrend, is consolidating, which may continue for some time due to Thursday's news and low liquidity on Friday.
Gold stabilized after a correction, but volatility risks remain. After falling from a weekly high of $3,366, gold prices found demand again in A

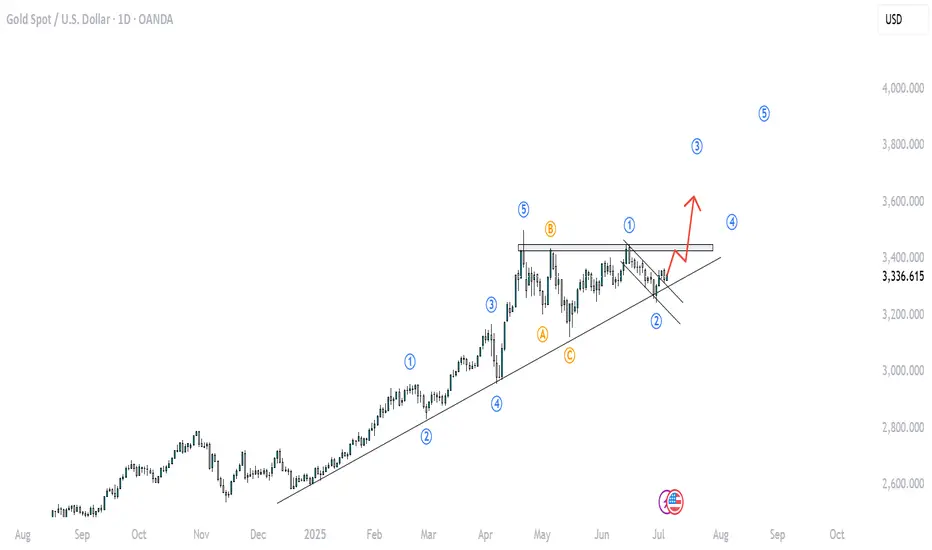
Gold will exit from pennant and then rise to resistance levelHello traders, I want share with you my opinion about Gold. Recently, the price formed a pennant pattern after a sharp bullish impulse from the buyer zone (3275–3285 points). That upward movement started after the price bounced off the strong support level (3285) and broke out from the wedge structu

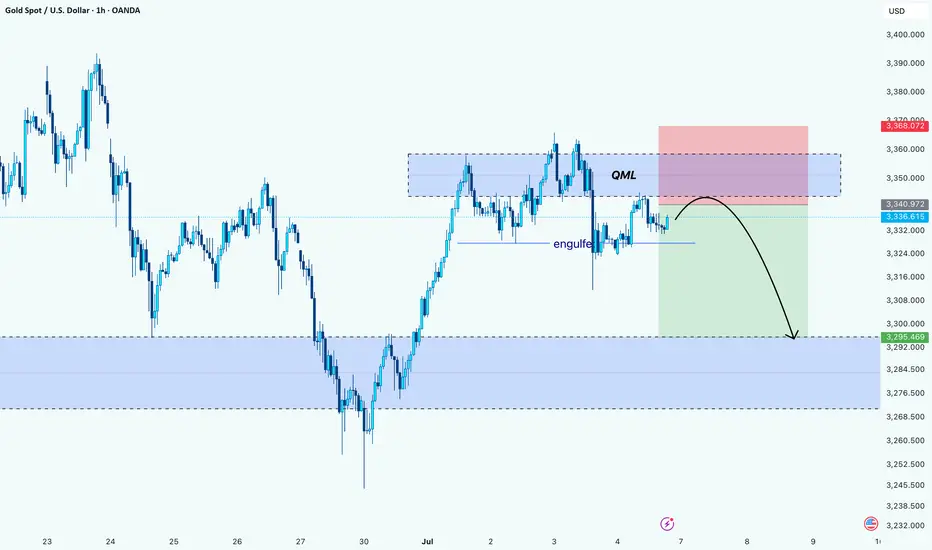
Gold’s Trap Above QML: Bearish Play UnfoldingHello Guys!
Gold appears to be forming a textbook Quasimodo reversal setup after printing a lower high into a key supply zone. Price aggressively tapped into the QML area (around 3,350–3,360), where sellers previously stepped in, and we’re now seeing signs of rejection.
The engulf zone marked earl
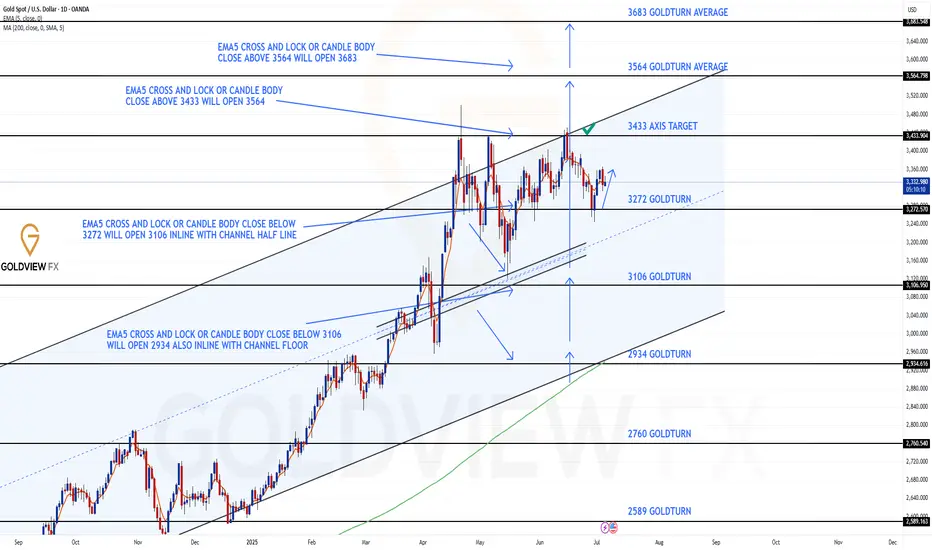
GOLD ROUTE MAP UPDATEHey Everyone,
Great finish to the week!!
We will now finish off with the Daily chart update, after following the 1h and 4h chart throughout the week. This will now remind everyone, how we broke down the overall structure into play.
The bounce scenario off 3272 has now officially played out, just
Lingrid | GOLD Pre-NFP Price Action AnalysisThe price perfectly fulfilled my last idea . OANDA:XAUUSD rebounded strongly from the 3244 support area, breaking above the downward trendline and pushing into the mid-resistance band. The price is currently testing 3353 and could pull back slightly before retesting the 3388 key resistance level

Gold on the Move – Major Resistance Levels to Watch AheadThe current price action looks strong, and if the bullish momentum continues, we have three main target levels in mind.
The first target is $3,380. This is an important level we expect gold to reach soon if the trend continues upward.
If the price breaks above $3,380, the next target is $3,433. Th

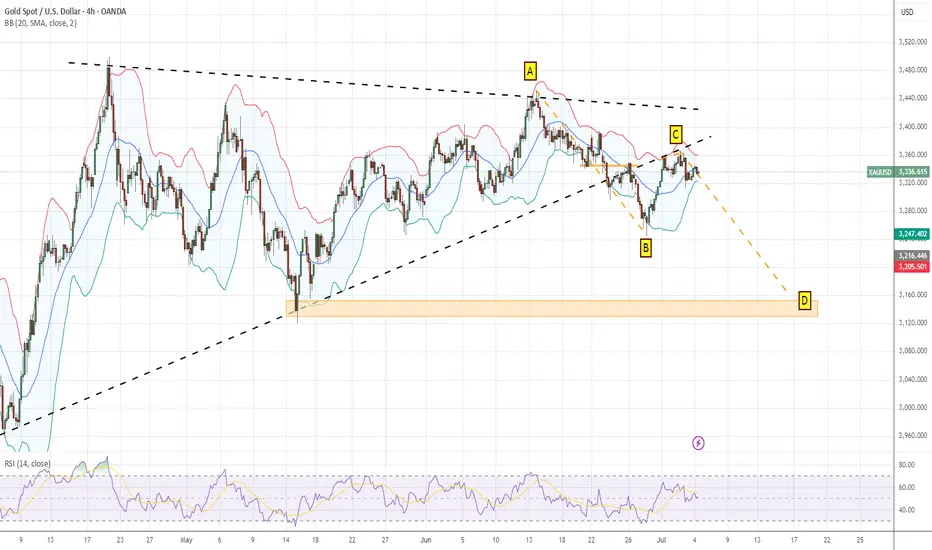
XAUUSD observationGold's current state
How should we view this?
Personal opinion:Retracement after the Triangle Convergence Breakout
Bearish expectations
The first Target is to complete AB=CD.
GOLD LIQUIDITY MASTERCLASS: The Smart Money Playbook Revealed🧠 INSTITUTIONAL MINDSET
At $3,365: "Perfect! Time to sell into retail buying"
At $3,337: "Let's see how this plays out"
At $3,318: "Preparing for the hunt"
At $3,270: "Starting to accumulate"
At $3,245: "Loading the truck! This is what we've been waiting for"
🔍 LIQUIDITY ZONES DECODED: The Hidden

XAUUSD REVERSAL OR CONTINUATION?The analysis on GOLD in D1 shows us a bullish structure for several months. But could this be the end of this trend with the current configuration? NO!!!! today in July 2025 we can see that the price is facing strong resistance which has already been tested 3 times? certainly this resistance is soli
See all futures ideas
#EURNZD:Price accumulated now time for distribution! Price completed accumulated and now we expecting a strong bullish price distribution. Next week we can see price going and crossing our target with strong bullish volume kicking in the market. Price may go beyond 2.20 region; let's see how it goes.
Good luck and trade safe!
Team Setupsfx_

EURUSD ObservationCurrent status of EURUSD:
From the daily chart, it has diverged twice
It is no longer suitable to continue buying
Switch to a smaller period, like 4 hours, or 1 hour.
In fact, the hour head structure has appeared.
If it meets your entry criteria, you can try shorting
MarketBreakdown | USDJPY, USDCAD, BITCOIN, SILVER
Here are the updates & outlook for multiple instruments in my watch list.
1️⃣ #USDJPY daily time frame 🇺🇸🇯🇵
The market nicely respected a rising trend line
and bounced from that, forming a high momentum bullish candle.
I think that the pair will continue rising and reach 145.8 level soon.

EURUSDEUR/USD Exchange Rate
EUR/USD: 1.17735
The euro has strengthened against the US dollar, trading near its highest level since early 2024, supported by a softer DXY and stable Eurozone outlook.
10-Year Government Bond Yields
Region 10-Year Yield Date
Eurozone 2.560% July 5, 2025
United States 4.348% J

GBP/JPY Rising Within Ascending Channel – Target in SightGBP/JPY is currently moving within an ascending channel, where price action is forming higher highs and higher lows. This pattern indicates a steady uptrend.
At the moment, the pair is approaching the upper boundary (resistance line) of the channel. Based on the current momentum and structure, we e

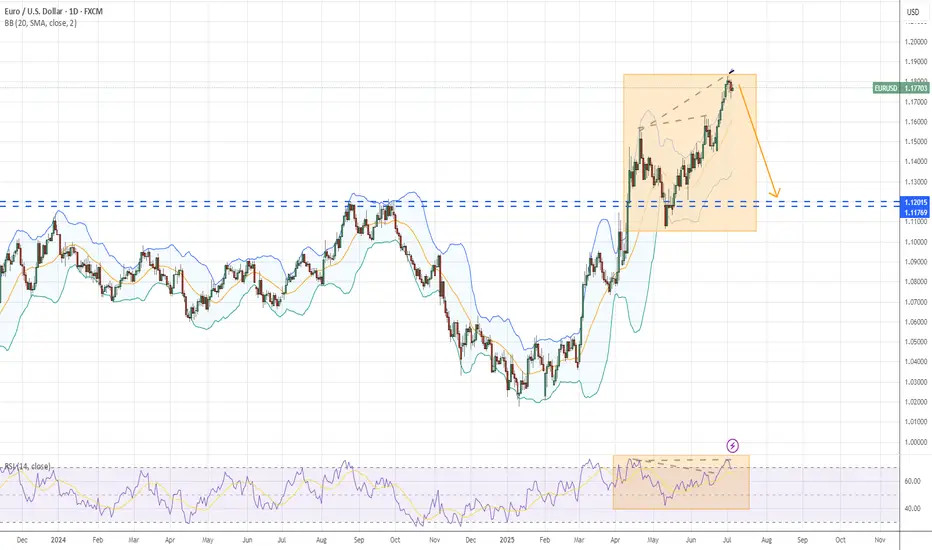
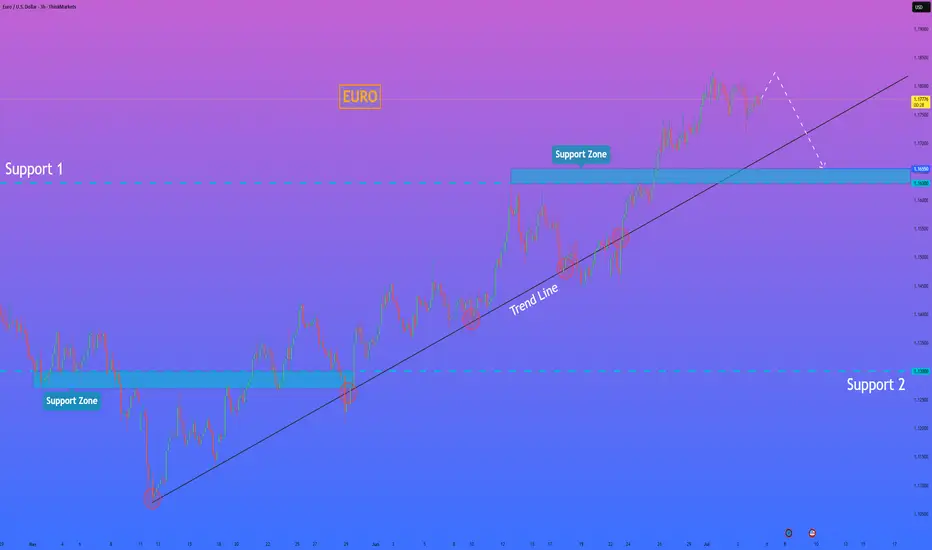
HelenP. I Euro may soon reverse and test support near $1.1655Hi folks today I'm prepared for you Euro analytics. If we look at the chart, EURUSD has been climbing steadily within an uptrend, bouncing multiple times from the trend line and making higher highs. However, despite the recent bullish structure, the pair is now showing signs of slowing momentum. The
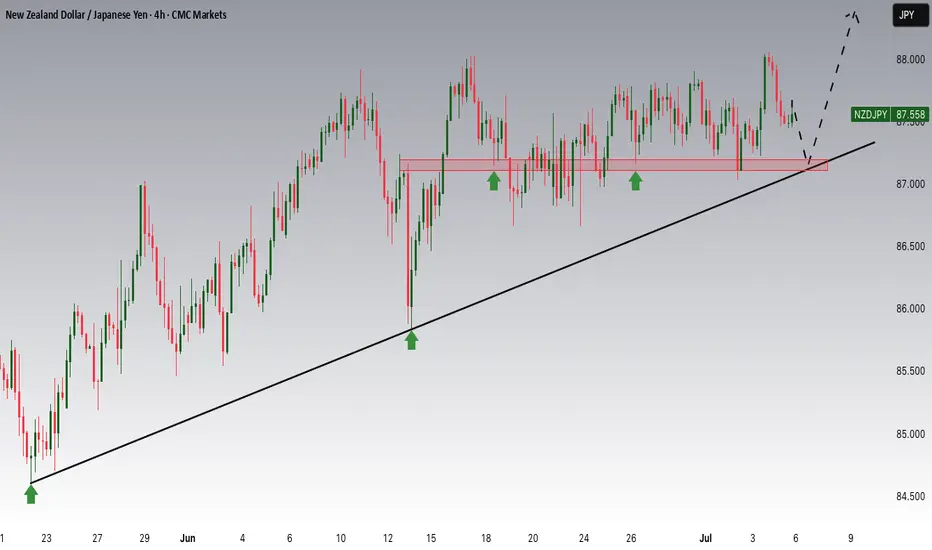
NZDJPY Potential UpsidesHey Traders, in the coming week we are monitoring NZDJPY for a buying opportunity around 87.200 zone, NZDJPY is trading in an uptrend and currently is in a correction phase in which it is approaching the trend at 87.200 support and resistance area.
Trade safe, Joe.
EURUSD Return to Order Block, AscendWould not be surprised to see early next week a small return to this order block before next rally.
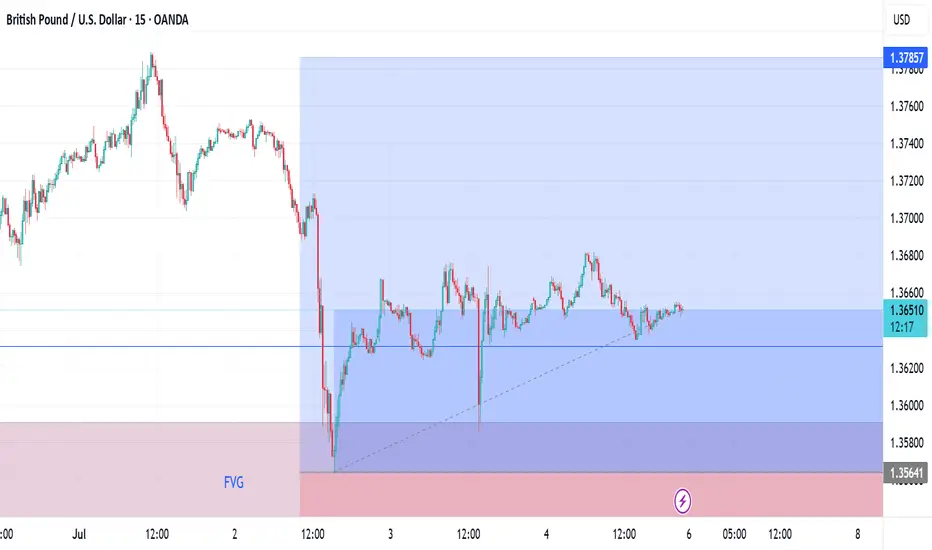
Longs on GBPUSDPrice tapped into the midpoint of the FVG which initial move cleared liquidity, gave an OB and pushed higher, we're expecting price to push to the next DOL
EURGBP – Trading the Price Where It Is, Not Where You Want It toWhen trading price movements, traders always strive to determine where the price will go.
This compulsion leads most of them to close losing positions!
The strong urge that comes from this — that price must do what the trader predicted — is what ruins the position.
Price must always be handled as

See all forex ideas
| - | - | - | - | - | - | - | ||
| - | - | - | - | - | - | - | ||
| - | - | - | - | - | - | - | ||
| - | - | - | - | - | - | - | ||
| - | - | - | - | - | - | - | ||
| - | - | - | - | - | - | - | ||
| - | - | - | - | - | - | - | ||
| - | - | - | - | - | - | - |
Trade directly on the supercharts through our supported, fully-verified and user-reviewed brokers.


