US100 - Liquidity sweep likely before bullish continuationFollowing a significant upward move last week, the US100 (Nasdaq 100 index) has entered a period of consolidation, currently exhibiting a ranging structure characterized by lower highs and relatively equal lows. This pattern typically suggests a tightening market where bullish momentum is cooling bu
Key data points
No news here
Looks like there's nothing to report right now

NASDAQ 100 on dayly This NASDAQ 100 chart shows an inverted Head and Shoulders pattern. The "head" is near 18,800, with the "left shoulder" and "right shoulder" around 19,200-19,400. The neckline is at approximately 19,800, and the price has broken above it, indicating a bullish reversal. The measured target is around


NASDAQ READY TO CONTINUE THE LONG-TERM WEEKLY BULLISH RUN
FX:NAS100
I just entered this buy trade on Nasdaq on the daily time frame.
The trade setup is a Swing trade following the monthly and weekly orderflow.
The Monthly is bullish, the weekly is also bullish, so I entered on the daily time frame retracement.
My overall take profit is a risk rewa

NAS100USD: Discount Reversal & Bullish Continuation NarrativeGreetings Traders,
In today’s analysis on NAS100USD, we observe the market operating within a bullish institutional order flow—a clear signal for us to align with the prevailing momentum and look for high-probability buying opportunities.
Market Context:
The market has established a well-defined

USNAS100 SHORT SETUPThe USNAS100 4-hour chart shows a bearish setup following a clear rejection at resistance. A rising wedge pattern has broken to the downside, indicating a shift in momentum. Technical indicators support the bearish bias, with price falling below trendline support and moving toward key support zones.

Nasdaq US100 Wave 3 Expansion Toward 31,606 in PlayNasdaq US100 has completed a significant wave cycle with a confirmed wave 1 in the broader Elliott Wave structure. Following this, price underwent a corrective wave 2 that extended from the $22,237 supply zone down to $16,334, marking the conclusion of the previous cycle’s correction. This structure

NAS100USD: Bearish Confluence Builds as Market WeakensGreetings Traders,
Despite the broader bullish context on NAS100USD, current confluences suggest a potential short-term move to the downside. As we enter the New York session—with a key news release on the horizon—we anticipate heightened volatility. The critical question now becomes: where is price
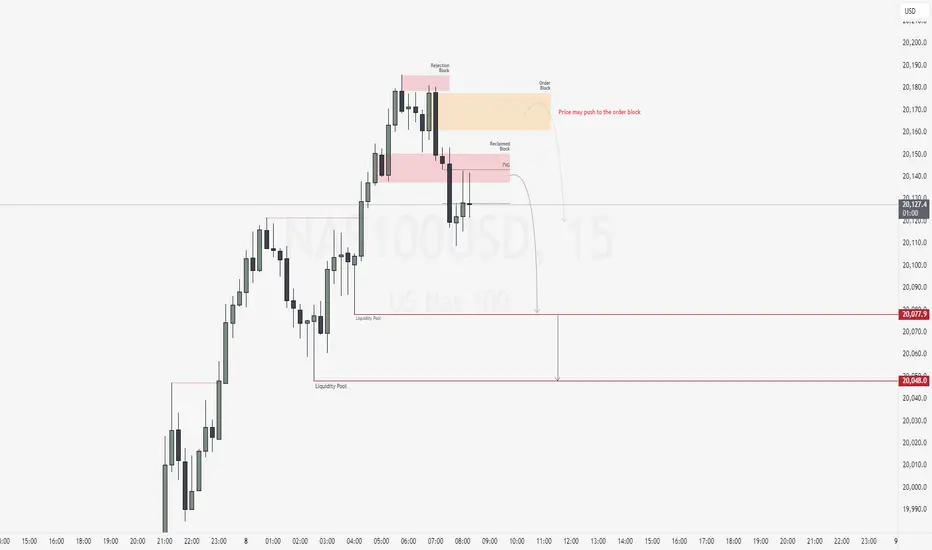
US100 - Correction Required Before Next Major Rally PhaseThe US Tech 100 index is showing signs of exhaustion after a strong recovery rally from April lows, with price action now facing resistance at the upper blue box around 20,200. The index appears to be forming a short-term top as momentum wanes, evidenced by recent candle patterns displaying indecisi


See all ideas
Displays a symbol's price movements over previous years to identify recurring trends.