Weekly trading plan for Solana BINANCE:SOLUSDT The chart clearly shows a triangular correction pattern. Price has now broken the trendline and is rallying, suggesting we may see:
Retest of the local high at $160
Achievement of our first monthly target
More details in the video itself - enjoy watching
Trade safe and stay adaptive
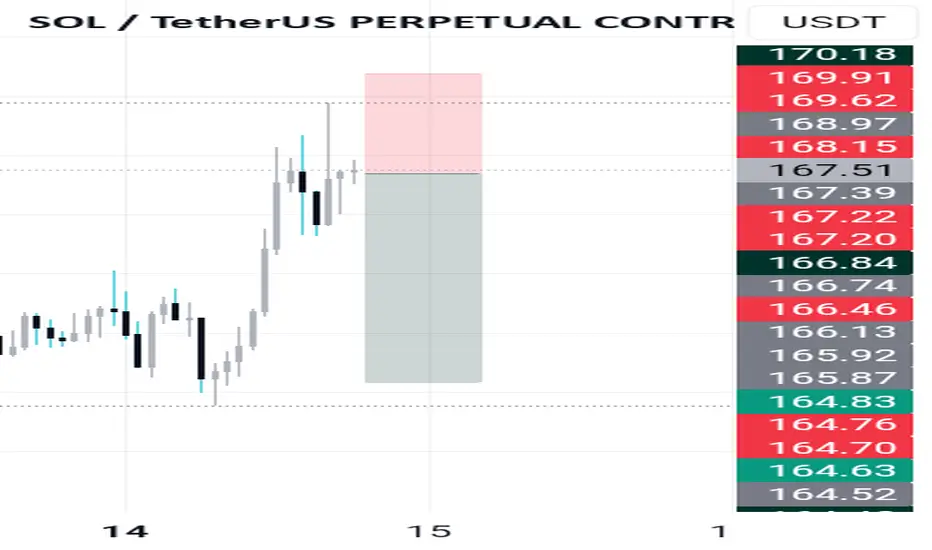
SOL / TetherUS PERPETUAL CONTRACT
178.10USDTR
+1.17+0.66%
As of today at 03:58 GMT
USDT
No trades
SOLUSDT.P trade ideas

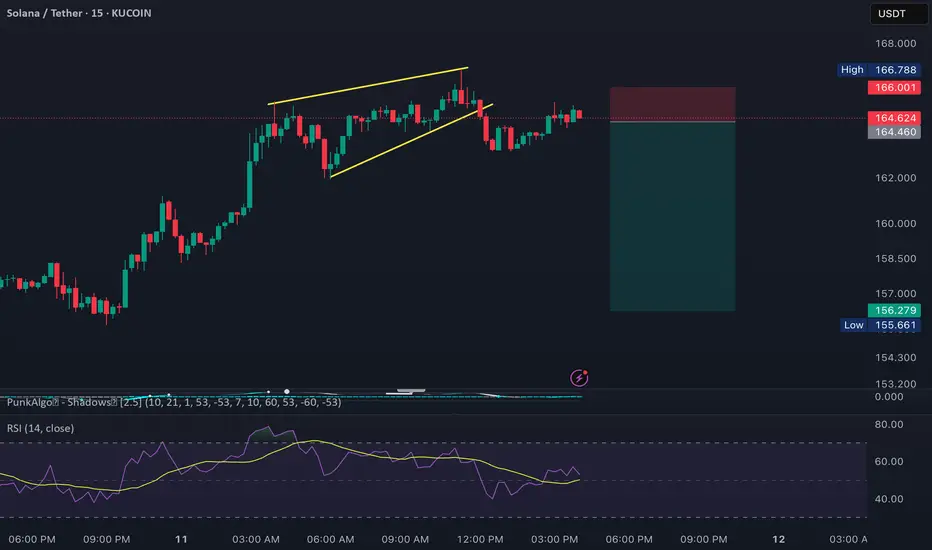
SOL Breakdown: Short Opportunity Before the Next Bull RunSOL is approaching resistance and has broken the rising wedge on the 15-minute timeframe. A significant dip is likely before the actual bull run begins.
Short entry: Around $164.50
Stop-loss: $166 – $166.50
Take-profit targets: $160 and $156
This setup offers a good scalping opportunity in the short term.
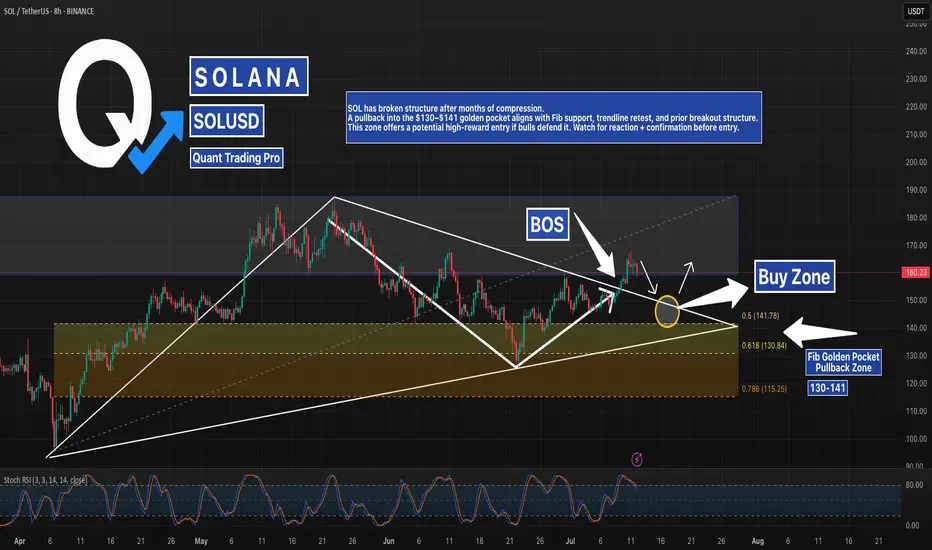
SOL Breakout Confirmed – Golden Pocket Pullback Next?Solana just posted a clean Break of Structure (BOS) from a long-term descending wedge and is now hovering above a major breakout zone. A deeper pullback into the Fib Golden Pocket (130–141) could present a high-conviction buy opportunity.
The confluence of:
0.5–0.618 Fib retracements
Rising wedge support
Previous breakout structure
…makes this area a prime “Buy Zone” to watch. A higher low here could fuel the next macro leg toward $190+.
📍 Key Levels:
Buy Zone: $130–$141
Resistance: $193.80
Support Trendline: Still intact
👀 Monitoring RSI oversold + reclaim signals for optimal entry.
#Solana #SOLUSD #GoldenPocket #Breakout #CryptoSetup #Fibonacci #QuantTradingPro #TradingView


SOLUSDT longhi Traders,
We can see that price is currently trading below a well-defined downsloping trendline.
The trendline (blue) has been tested multiple times, confirming its validity as resistance.
Price action is showing higher lows, indicating building pressure, usually a bullish sign often seen before breakouts.
The breakout seems to be happening right now, so entering the long position is justified.
Target: 184
Invalidation: daily close below the downsloping resistance trendline

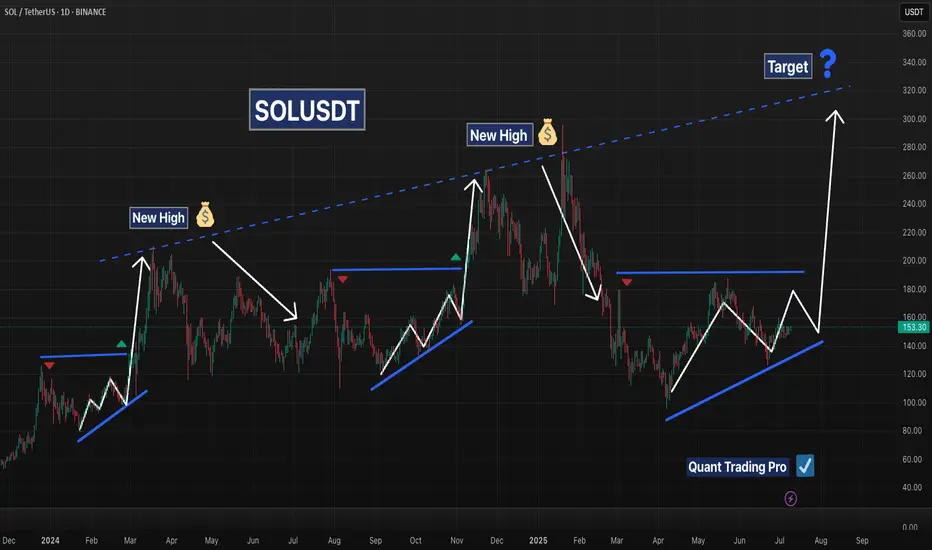
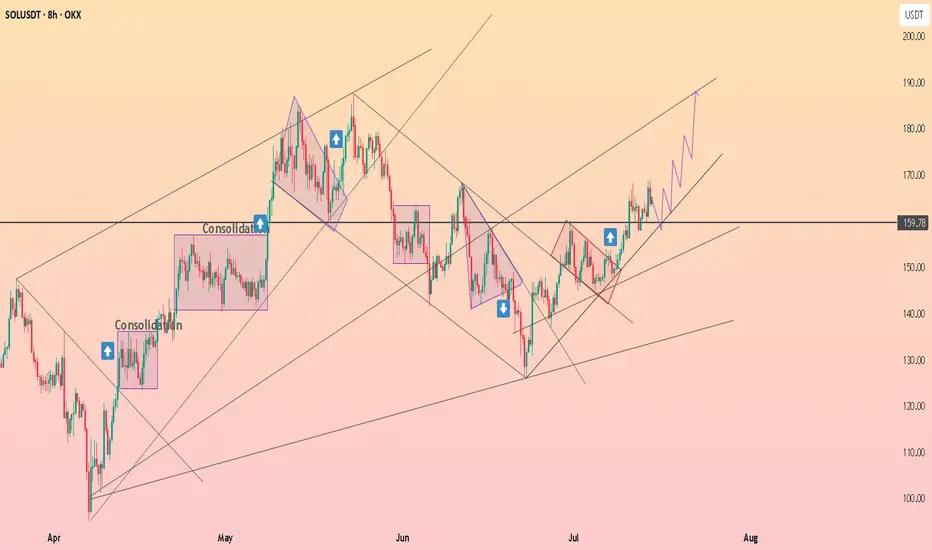
SOLANA – Repeating Structure Points to Major Upside PotentialSolana’s chart reveals a recurring bullish pattern that has played out multiple times over the past year. In each instance, SOL formed a rising base or ascending triangle followed by a strong breakout and a new high. These breakouts typically occurred after:
A series of higher lows forming an ascending structure
Compression beneath horizontal resistance
A clean breakout followed by a rapid price expansion
The current price action appears to be forming the same structure once again:
A clear ascending support trendline is intact
Price is approaching the horizontal resistance zone near $180
The 50 EMA is turning upward and price is pressing above the 200 EMA
If SOL breaks above the $180 level with volume, it could mirror previous rallies and target the long-term diagonal resistance trendline, currently pointing toward the $300–$340 range. Until then, a pullback to retest support near $140–$150 would remain within the bullish structure.
Key Technical Features:
Consistent ascending accumulation patterns
Breakout levels followed by new highs
Current setup showing a third rising base near major resistance
Clear long-term diagonal trendline acting as a historical ceiling
This is a textbook example of price memory and structural repetition. Traders should monitor for a confirmed breakout above horizontal resistance with strong volume before positioning for continuation.

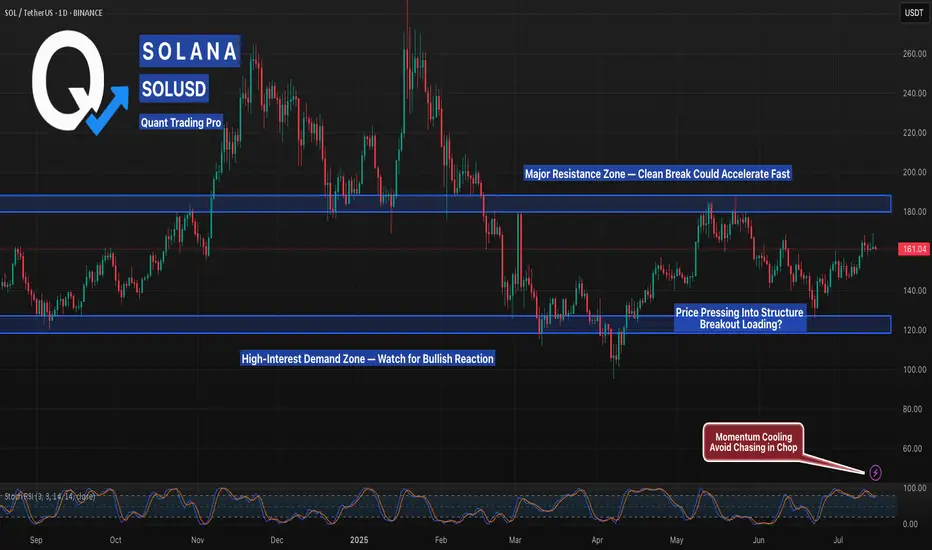
$SOL Price Will Hit $228 Q3, Inverse Head and Shoulder Pattern✨ CRYPTOCAP:SOL Price Will Hit $228 in Q3 of 2025 | Solana Chart Showing Inverse Head and Shoulder Pattern. It's a Bullish Reversal Pattern.
‣ Solana price is hovering below key resistance; a breakout above $159 and it's going to $228.
ETF Buzz Grows, but Price Action Still Caught in Limbo Here is why this could be the catalyst that sends price to all time highs Do THIS before that happens.
‣ Solana ETF Buzz Grows, but Price Action Still Caught in Limbo
🔸BlockNews The SEC has asked SOL ETF applicants to revise and refile submissions by end of July, fueling speculation of an ETF approval before October. Solana’s daily active addresses just hit a record 15.39 million, pointing to rising demand and user engagement on the network.
#Write2Earn #NFPWatch #BinanceSquareFamily #TrumpTariffs #SUBROOFFICIAL
Disclaimer: This article is for informational purposes only and does not constitute financial advice. Always conduct your own research before making any investment decisions. Digital asset prices are subject to high market risk and price volatility.


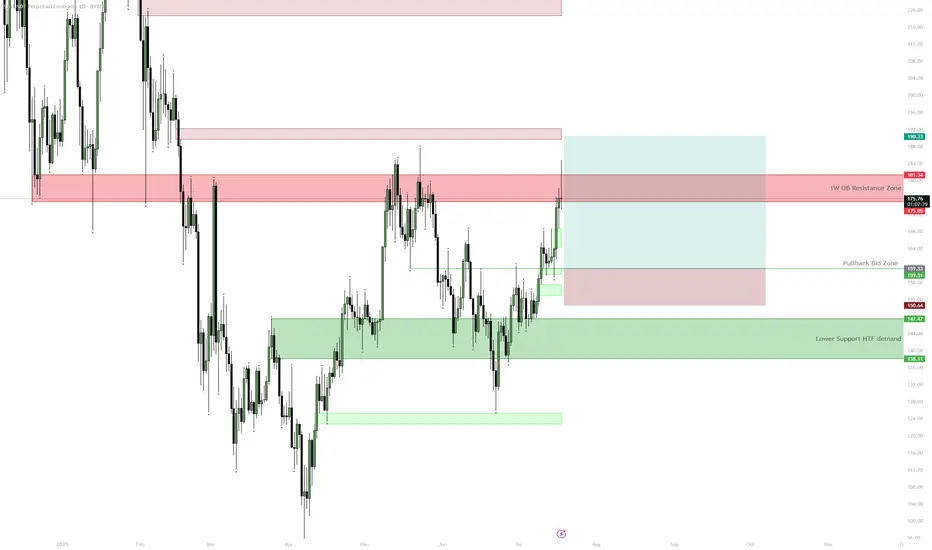
SOL — $180 HTF Resistance | Consolidation ExpectedSOL is approaching a key HTF resistance zone at $175–$181 with 1D RSI close to overbought. Unless price cleanly breaks above this area, a pullback to $160 or even the $138–$147 demand zone is likely before further upside. The setup provides a better risk/reward for longs on pullbacks after consolidation rather than chasing at resistance.
Solana Testing the June Breakdown Level — Decision TimeAfter weeks of slow grind, SOL is now pressing into a level that triggered a major selloff in June. A clean breakout here could flip momentum hard — but if buyers stall again, a short-term double top could catch late longs off guard. Watching $185 closely.

SOLUSDT – Healthy Pullback Before ContinuationSolana has shown strong bullish momentum recently, breaking out of a consolidation range and trending upward within a clear ascending channel.
However, in the short term, I expect a minor correction as price is likely to revisit the Fair Value Gap (FVG) zone marked around the $160–$165 area. This would be a healthy retracement within the trend and could provide a solid base for continuation toward higher targets.
If price respects the FVG and the lower trendline, SOL could resume its bullish move, potentially aiming for the $200 level and higher within the channel.
Key levels to watch:
FVG support zone: $160–$165
Resistance target: $200 – $220
Waiting for a pullback to enter on strength. Trend remains intact as long as the channel holds.


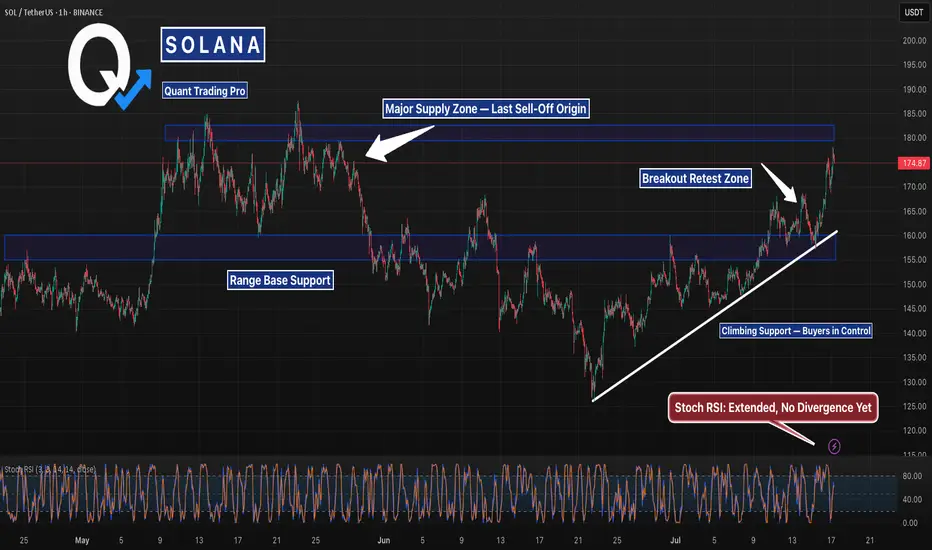
SOL Back at the Same Level It Dumped From — But with BackupSOL is right back where the last major dump started — but the structure this time is way cleaner. Higher lows, trendline support, and strong momentum behind the push.
If it clears this zone, we could see fireworks. But don’t fade resistance this thick without confirmation.
#Solana #SOLUSD #CryptoCharts #BreakoutWatch #ChartAnalysis #TrendlineSupport #CryptoTraders #QuantTradingPro #TradingView
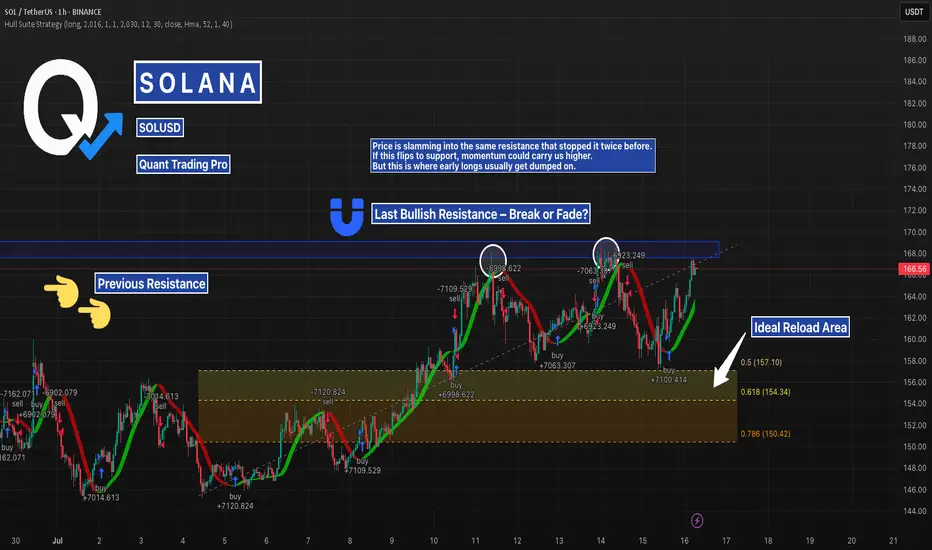
SOLUSD – Big Test at Local Resistance | Fib Reload if RejectedSolana just tapped into prior resistance from July 13–14, a level that previously rejected price.
With fib confluence between $157–$150 below, this is a textbook setup: breakout or rejection → smart money looks for the reload.
Watching closely for structure shift before taking position.
#SOLUSD #Solana #Crypto #Breakout #SupportResistance #QuantTradingPro #TradingView

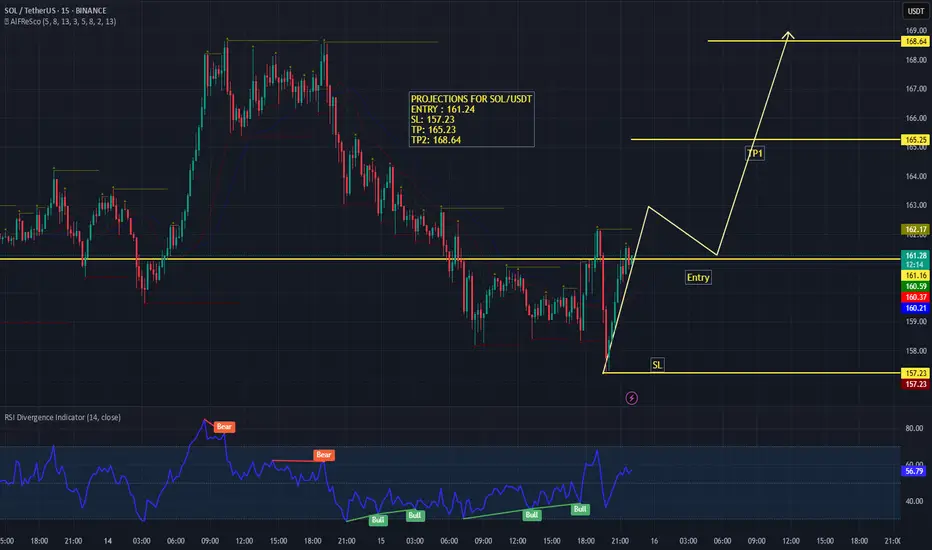
SOL/USDT – 15M Technical AnalysisSolana (SOL) is showing signs of a potential bullish reversal on the 15-minute timeframe after a sharp downtrend. Price has reclaimed key support levels and is preparing for a possible breakout.
📈 Projections & Trade Plan:
Entry: 161.24 (above immediate resistance)
Stop Loss (SL): 157.23 (below recent swing low)
Take Profit (TP):
TP1: 165.23 (near previous resistance cluster)
TP2: 168.64 (targeting the upper resistance zone)
Technical Insights:
The price has broken the descending structure and is showing bullish momentum with a clean impulse leg upwards.
A minor pullback to the entry zone would provide an optimal long opportunity before continuation towards TP levels.
Momentum Indicators:
RSI is trending upwards at 55.56, indicating strengthening buying pressure. Multiple bullish divergences can be observed, which align with the reversal thesis.
⚡ Bias: Bullish
If price holds above 161.24 and confirms breakout strength, we can expect a move toward 165.23 and potentially extend to 168.64. However, failure to hold above 161.00 may invalidate the setup.
Solana Coiling Beneath Resistance — A Breakout Could Get ViolentSolana is pressing against the upper bounds of its multi-month range, with price tightening just beneath key resistance near $180. This level has historically triggered strong sell-offs, but the rising structure from June suggests bullish pressure is building.
Momentum is elevated, but not overheated — a clean breakout above the range high could trigger a rapid move toward $200+. If rejected, eyes shift back to the $140–$120 demand zone. This is a high-stakes zone — breakout traders should be ready.
sol sell midterm"🌟 Welcome to Golden Candle! 🌟
We're a team of 📈 passionate traders 📉 who love sharing our 🔍 technical analysis insights 🔎 with the TradingView community. 🌎
Our goal is to provide 💡 valuable perspectives 💡 on market trends and patterns, but 🚫 please note that our analyses are not intended as buy or sell recommendations. 🚫
Instead, they reflect our own 💭 personal attitudes and thoughts. 💭
Follow along and 📚 learn 📚 from our analyses! 📊💡"

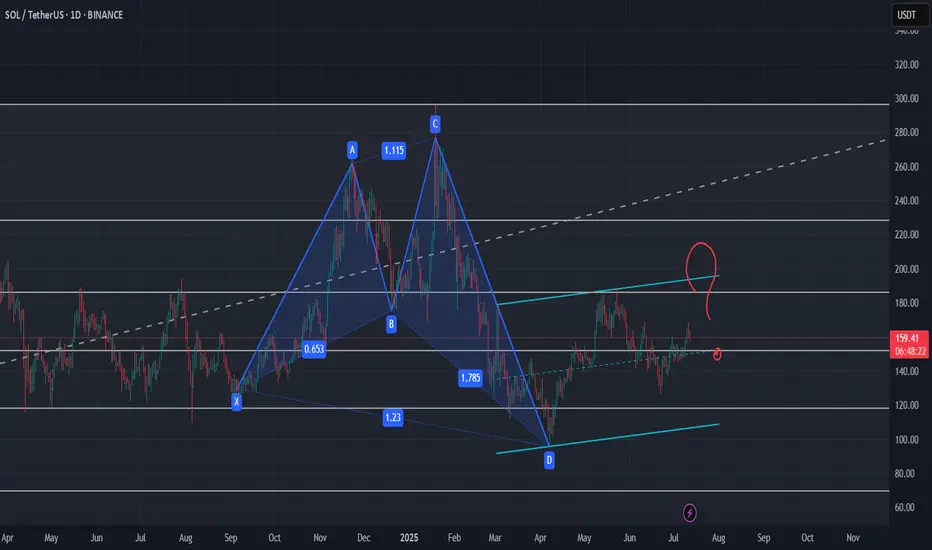
HARMONIC PATTERN on Daily for SOL ?I wonder if this pattern is the one which is highlighted by our friend and chart analyst @The_Alchemist_Trader_
Let's see if it need to test one last time the support of this channel or if it will break out for the long waited rally.
Level to keep an eye :
0.5 Fib support need to hold and clean breakout of the 0.382 Fib
Indicators : RSI, volume and volatility (liquidations)