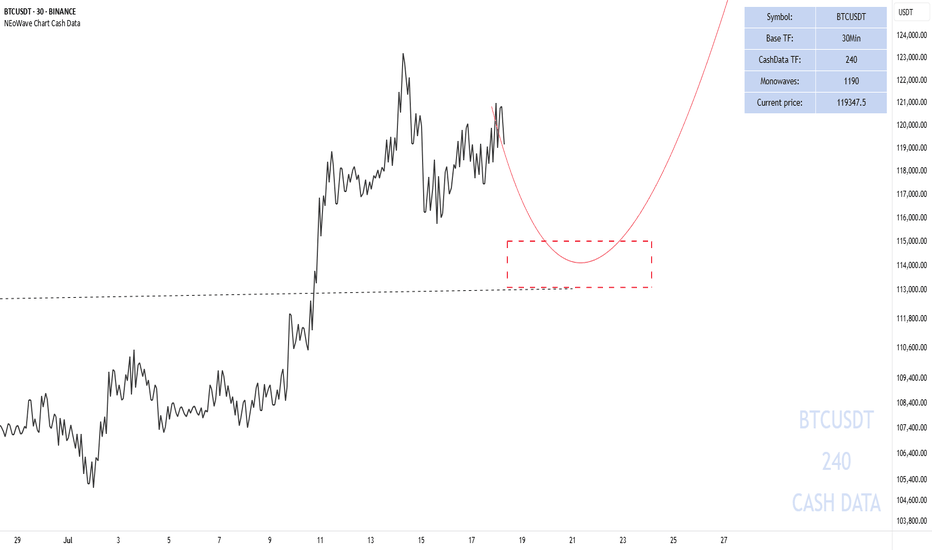
Shor-term In my opinion, Bitcoin could make a move towards $113,000-115,000 and then start moving upwards. In any case, according to previous analysis and apart from short-term fluctuations, it could touch the target of $140,000-150,000. Good luck NEoWave Chart
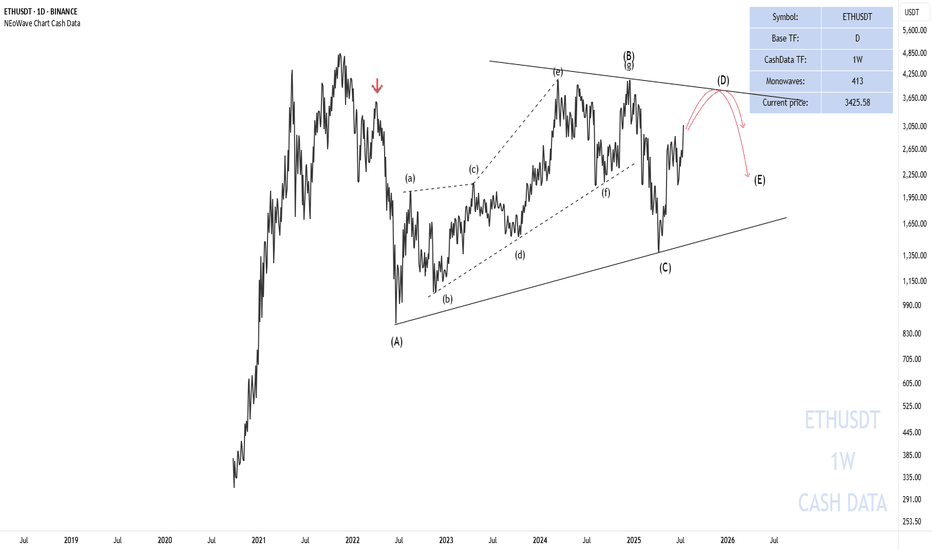
Cash data chart shows that Ethereum is in a corrective phase and the wave structure from (A) to (C) has been completed. Initially, we expected a flat pattern to form; however, the wave structure-(C) was not an impulse and the flat was not confirmed. As a result, given that the wave structure (A)-(B)-(C) is corrective and the waves differ in time, it seems that a...
Total 3 seems to be forming a neutral triangle (marked with a red circle) and will soon move towards the red box to complete wave-(d) of the higher degree triangle. The price path is marked for you on the chart. Good luck NEoWave Chart
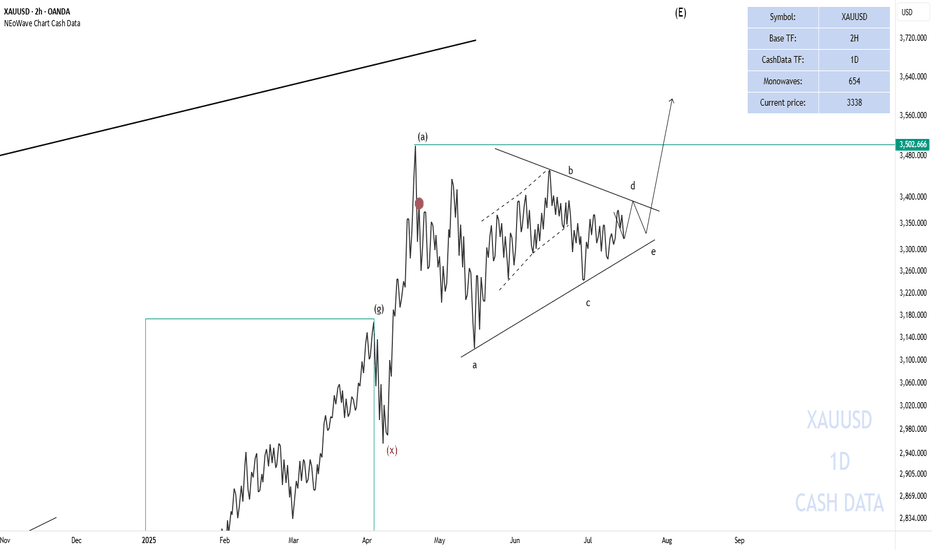
Gold has been resting too long and the neutral triangle is no longer valid in terms of time and a contracting triangle seems to be forming. In any case, there is at least one more bullish wave left for gold. Good luck NEoWave Chart
Our first downside target was touched, but then it failed to reach the second target and the g-wave ended at 0.54. Based on past price movement, we can expect the price to reach $1.5-$2. Good luck NEoWave Chart
The X-wave has formed in the form of a neutral triangle pattern, and eventually Bitcoin could once again touch $106,000 and move towards $140,000-150,000 with the completion of wave-e. Good luck NEoWave Chart
My first scenario is still valid and I think it is more likely to happen. It seems that Wave-g has ended from the second pattern and I think NIFTY50 will decline at least to the price range of the X-wave and there we need to check the waves again to see what pattern is forming. To confirm this scenario, a break below the key level of 25000 is very important. I...
The previous scenario is still valid, except that the price correction is taking time and is turning into a diametric. We are currently in wave-(f) of the diametric Good luck NEoWave Chart
We are currently in wave-g of the Diamond Diametric and it could continue to 0.43. After the completion of the Diametric, if the Double Combination pattern does not form, we expect an uptrend to form. (The post-pattern movement will show us whether the Diametric has completed or not). Good luck NEoWave Chart
The monthly Cash Data chart is forming a diametric pattern. Waves (a) through (f) have completed and we are currently in the middle of wave (g) of the diametric pattern. This wave is moving towards 59,000
Silver is completing a bow-tie diametric pattern, currently in wave-f. After the diametric completes, there is a potential for an upward trend to form. Good luck NEoWave Chart
The bearish scenario for the BIST 100 index remains valid. It seems that the next downward wave will begin after the formation of the contracting triangle. Good luck NEoWave Chart
The upward movement that Bitcoin started at $74,550 has many similarities between its waves. Considering the similarity in price and the large time between waves A-C-E-G and waves B-D-F, it is clear that a diametric or symmetrical is forming. Considering that the post-pattern movement after the g-wave has not passed, there are two scenarios: 1- Formation of an...
Weekly Cash Data shows a sharp downtrend that stopped at 2.05 and then formed a sideways trend. Given the size of wave-(c) and the time of the waves, it seems that a reverse contracting triangle pattern is forming. Currently, wave-(d) has ended and wave-(e) has begun. Under normal circumstances, we expect this wave to decrease to the point indicated by the red...
The diametric pattern was completed and the post-pattern movement also confirmed the diametric✅ A new wave is forming. Good luck NEoWave Chart
EURUSD has started a price and time correction since July 28, 2008 in the form of a diametric pattern. Wave-(f) currently appears to be forming. We see two price ranges for the end of wave-(f) in terms of price: a - range 1.15758-1.17173 b - range 1.21357-1.23505 After the completion of wave-(f) we expect wave-(g) to continue to the specified range. Good...
Cash Data 1W By analyzing the weekly Cash Data chart of TOTAL3, we observe that after a rapid and significant rise, a correction in TOTAL3 has begun, which appears to be forming a Neutral Triangle pattern. Wave Analysis: Wave-(c) is a double pattern with a small X-wave, making it the most complex wave. However, there is a possibility that wave-(d) could become...
The recent corrective wave that started at $3500 is turning into a larger corrective pattern. We are currently in wave-(c) of this correction which is completing a diametric. This diametric pattern could end in the $3200 or $3150 price range. Good luck NEoWave Chart


