CRYPTO CRUNCH TIME! BTC + ETH + LTC + all the rest
Total Market Cap of all Cryptos is at a key point. This could be a great opportunity to buy or go short, depending on which way the breakout goes.
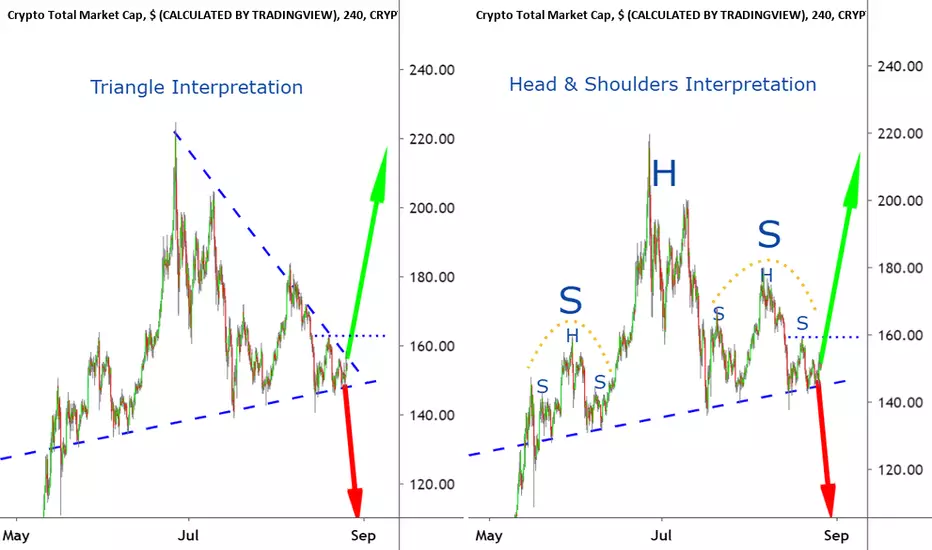
The chart can be interpreted as a triangle squeezing the price to a pinch point, which is usually followed by a strong breakout. Or it can be viewed as a big head & shoulders pattern, which comprises two smaller heads & shoulders.
It doesn't particularly matter which interpretation you prefer. Either way, the result is the same - a breakout is expected and if it goes upwards then the breakout will be confirmed when the price rises above the small dotted blue line, which was the previous mini-high of the triangle (or final mini-shoulder).
Note
The price is still coiling tighter and tighter. Trading volume is also getting smaller and smaller, which is what we would usually expect before a big price move.Note
And there's the move. Still a bit too early to declare it a decisive downward move (it could of course rebound above the line) but it was nicely short-able at the breakout point.THE CRYPTO TRADER: How anyone can make money trading Bitcoin and other cryptocurrencies
Published by Harriman House.
This link should take you to your local Amazon site.
getbook.at/TheCryptoTrader
Published by Harriman House.
This link should take you to your local Amazon site.
getbook.at/TheCryptoTrader
Disclaimer
The information and publications are not meant to be, and do not constitute, financial, investment, trading, or other types of advice or recommendations supplied or endorsed by TradingView. Read more in the Terms of Use.
THE CRYPTO TRADER: How anyone can make money trading Bitcoin and other cryptocurrencies
Published by Harriman House.
This link should take you to your local Amazon site.
getbook.at/TheCryptoTrader
Published by Harriman House.
This link should take you to your local Amazon site.
getbook.at/TheCryptoTrader
Disclaimer
The information and publications are not meant to be, and do not constitute, financial, investment, trading, or other types of advice or recommendations supplied or endorsed by TradingView. Read more in the Terms of Use.