Idea #100 - In this market, it BETTER be a good one: LONG WMTIt's been a while since I posted an idea and to those who follow me I am sorry/not sorry. I didn't post for a few reasons:
1) I know that there are people who trade my ideas despite my warnings/disclaimers and I didn't like how the market was acting for the last couple of weeks (rightly, as it tur
Explore the community

The only tech stock I’d consider buying right nowThis analysis is provided by Eden Bradfeld at BlackBull Research.
We’ve seen the S&P, NASDAQ and every other American index get slammed in the last couple of days. Some people are panicking. A lot of people are panicking. If you go on Twitter (sorry — X dot com) you will find a lot of people who

TSLA Breakout Retest: What Could Signal Bullish Surge NASDAQ:TSLA Breakout Retest: What Could Signal Bullish Surge – Is Tesla poised for a major move? In this video, I break down the breakout retest pattern on TSLA’s weekly chart, focusing on the critical near term levels. A validated breakout could hint at a higher time frame bullish scenario! I’ll

Gold is on a relentless hunt for the $2,720 levelGold is on a relentless hunt for the $2,720 level, navigating through a well-defined ascending channel where the upper boundary has acted as long-term resistance and the lower boundary as dynamic support. The price has respected this structure, with multiple touches reinforcing its integrity. Howeve


Bitcoin - Will history repeat itself?In this analysis, we are observing the potential repetition of market history by comparing the current Bitcoin price action to the previous bullrun cycle. By utilizing Fibonacci retracement levels, historical patterns, and the current macroeconomic landscape, we can formulate a hypothesis that the m

Is Trump’s Golden Age a Recession in the Making? Let’s Find Out“This tariff low key slaps,” says no trader ever as markets get jerked and jolted day in and day out because no one can really figure out what’s happening. On some days, US President Donald Trump wakes up and chooses to slap a tariff or two on America’s closest and biggest allies. On other days, he

QQQ relief bounce on the cardsNASDAQ:QQQ is at a critical level which will lend itself to a relief bounce in the coming weeks.
Note: This is not a trade recommendation do your own due diligence.

S&P, NASDAQ, DOW JONES Weekly Market Forecast: Mar 10-14 In this video, we will analyze the S&P 500, NASDAQ, AND DOW JONES Futures. We'll determine the bias for the upcoming week, and look for the best potential setups.
Markets have been bearish due to mixed numbers employment, Fed statements, and uncertainty in US trade policies. Are the markets poised

Powell’s Speech & Bitcoin’s Decline: Is More Downside Ahead? Today, Fed Chair Jerome Powell is set to speak, and traders should brace for potential market volatility! Given the recent economic data , his tone is likely to be balanced but leaning hawkish .
Why a More Hawkish Powell?
1- Strong Job Market :
Unemployment Rate : 4.1% (Still low)
Non

See all editors' picks ideas
Trading Psychology or Technical Analysis—When Mind Meets MatterThere’s an age-old battle in trading that makes the bull vs. bear debate look like a game of pickleball (no offense, finance bros). It’s the clash between the traders who swear by their charts and the ones who insist it’s all about mindset.
The technicals versus the psychologicals. Fibonacci retr
Understanding Volume In TradingVolume is one of the most crucial yet often overlooked aspects of trading. It represents the total number of shares, contracts, or lots traded in a given period and provides insight into the strength of price movements. By analyzing volume effectively, traders can identify trends, confirm breakouts,
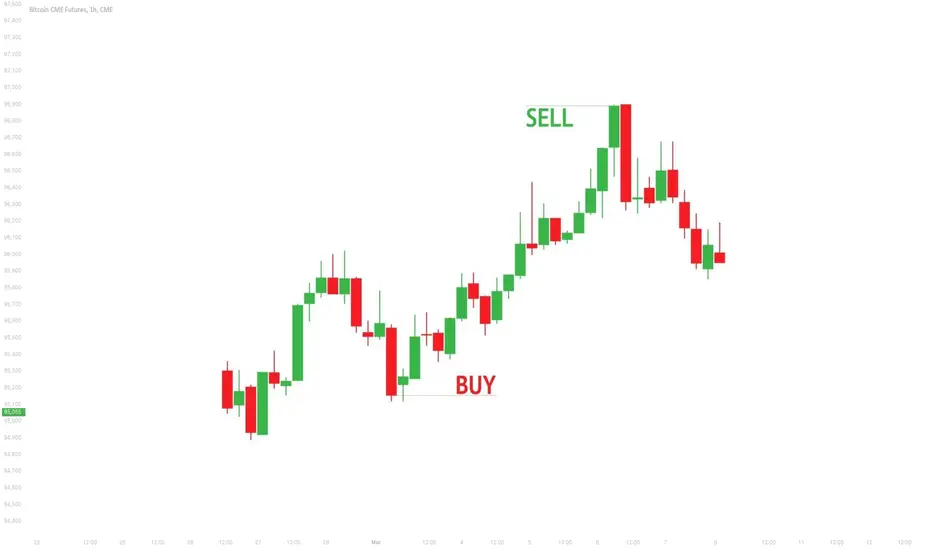
How to Spot a Reversal Before It Happens (Before Your SL Hits)You know the feeling. You’re confidently riding a winning trend, high on the euphoria of green candles, when—BAM—the market flips faster than a politician in an election year. Your once-perfect trade is now a humiliating red mess, and your stop loss is the only thing standing between you and financi

How to pick a benchmark for you portfolio and beat the market What is a benchmark?
A benchmark is an index or a basket of assets used to evaluate the performance of an investment portfolio In the context of portfolio analysis the benchmark serves as a point of comparison to determine whether a fund a strategy or an investment is performing better worse or in

The Power of a Trading Journal: Key to Consistent SuccessHave you ever pondered what distinguishes successful traders from those who struggle for consistent profits? One key tool, often underestimated, is the trading journal. Both research and practical experience demonstrate that traders who diligently track their performance and critically assess their

Bollinger Bands: Basics and Breakout Strategy🔵 What are Bollinger Bands?
Bollinger Bands are a popular technical analysis tool developed by John Bollinger in the early 1980s. They help traders analyze price volatility and potential price levels for buying or selling. The indicator consists of three lines plotted over a price chart:
Mid

How to Set Multiple TPs...for BeginnersHey Rich Friends,
I wanted to share how I find multiple TPs for my Forex trades using free tools and only 1 technical indicator. This strategy is perfect for beginners because it is easy to follow and has clear confirmations for entering and exiting a trade in profit, even if it hits your Stop Los

The Two Minds of a Trader: Analysis vs. ExecutionTrading is a game of probabilities, discipline, and emotional control. Yet, most traders unknowingly sabotage themselves by letting their analytical mind interfere with their execution. Understanding the distinction between the Analytical Mind (The Analyst) and the Execution Mind (The Trader) ca

Leap Ahead with a Dynamic Setup: Trading with Andrew’s PitchforkThe Leap Trading Competition: A Chance to Trade Micro Euro Futures
TradingView’s "The Leap" Trading Competition provides an opportunity for traders to apply their futures trading strategies in a competitive environment. Participants can trade select CME Group futures contracts, including Micro Eur

2 Ways to Potentially Gauge a Dip in PriceTrading markets should be simple right? Establish the direction of a price trend, take a position in the direction of that trend and enjoy the ride!
Of course, in practice, we all know trading is never that easy. All traders go through similar anxieties regarding whether the current level is the c

See all editors' picks ideas
TSLA Breakout Retest: What Could Signal Bullish Surge NASDAQ:TSLA Breakout Retest: What Could Signal Bullish Surge – Is Tesla poised for a major move? In this video, I break down the breakout retest pattern on TSLA’s weekly chart, focusing on the critical near term levels. A validated breakout could hint at a higher time frame bullish scenario! I’ll
QQQ relief bounce on the cardsNASDAQ:QQQ is at a critical level which will lend itself to a relief bounce in the coming weeks.
Note: This is not a trade recommendation do your own due diligence.
S&P, NASDAQ, DOW JONES Weekly Market Forecast: Mar 10-14 In this video, we will analyze the S&P 500, NASDAQ, AND DOW JONES Futures. We'll determine the bias for the upcoming week, and look for the best potential setups.
Markets have been bearish due to mixed numbers employment, Fed statements, and uncertainty in US trade policies. Are the markets poised
COCOA; Heikin Ashi Trade ideaPEPPERSTONE:COCOA
In this video, I’ll be sharing my analysis of COCOA, using my unique Heikin Ashi strategy. I’ll walk you through the reasoning behind my trade setup and highlight key areas where I’m anticipating potential opportunities. My goal is to help you enhance your trading skills and ins

Breakout to the downside on BA?🔉Sound on!🔉
📣Make sure to watch fullscreen!📣
Thank you as always for watching my videos. I hope that you learned something very educational! Please feel free to like, share, and comment on this post. Remember only risk what you are willing to lose. Trading is very risky but it can change your life!

SPY Another -10% Fall Incoming?Here in this video, I would like to help you guys understand my perspective for SPY for these next upcoming months. I believe its very possible that we could see another -10% fall from today's close.
My overall target would be the low of august sell off, and as I mentioned in the video, I truly

Bitcoin Breaks 90k with upward bounce on Daily FVG and 200MABitcoin Breaks 90k with bounce on Daily FVG and 200MA.
The FMG "Fair Value Gap" is a big deal, especially this one on the daily.
The 4h and 2h and 45min charts are looking like this could continue.
It's a powerful moment, and maybe 80k will never been seen again?
This is more bullish than I h

SPX: thesis of a 10-15% correction still in playI start from a naked chart and show you why I think we are going lower on the SPX.

Gold back to it's normal bullish programAs we always say, after a bullish daily close, we will remain bullish until a bearish daily close. With that being said, there was def a short opportunity today after reaching our buyside goal.
We will continue to track the development here and keep you on point with expectations.
Subscribe & Sh

See all editors' picks ideas
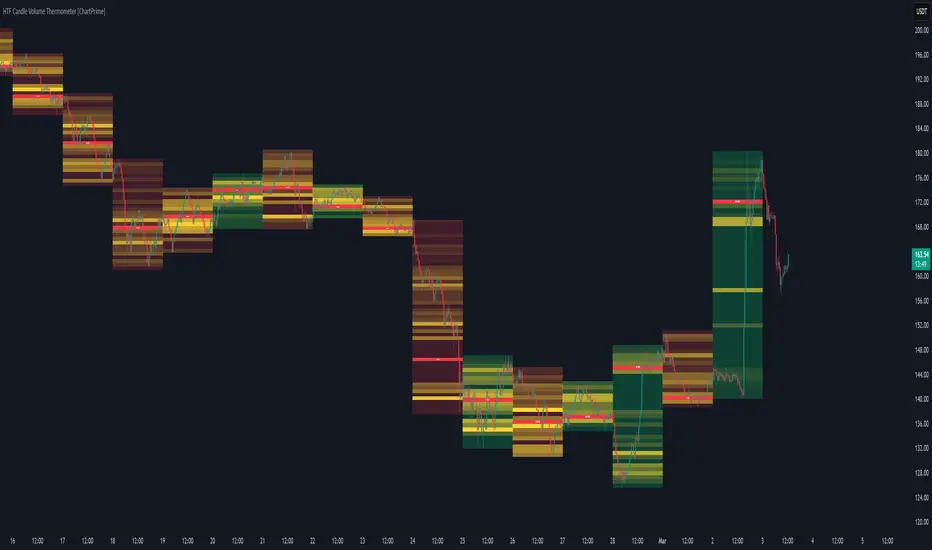
HTF Candle Volume Thermometer [ChartPrime]The HTF Candle Volume Thermometer is a powerful volume heatmap tool that visualizes higher timeframe candle volume distributions directly on the chart. It helps traders identify key price levels where liquidity is concentrated, allowing for more informed trading decisions.
⯁ KEY FEATURES
Multi Asset Similarity MatrixProvides a unique and visually stunning way to analyze the similarity between various stock market indices. This script uses a range of mathematical measures to calculate the correlation between different assets, such as indices, forex, crypto, etc..
Key Features:
Similarity Measures: The scr

Geo. Geo.
This library provides a comprehensive set of geometric functions based on 2 simple types for point and line manipulation, point array calculations, some vector operations (Borrowed from @ricardosantos ), angle calculations, and basic polygon analysis. It offers tools for creating, transformin
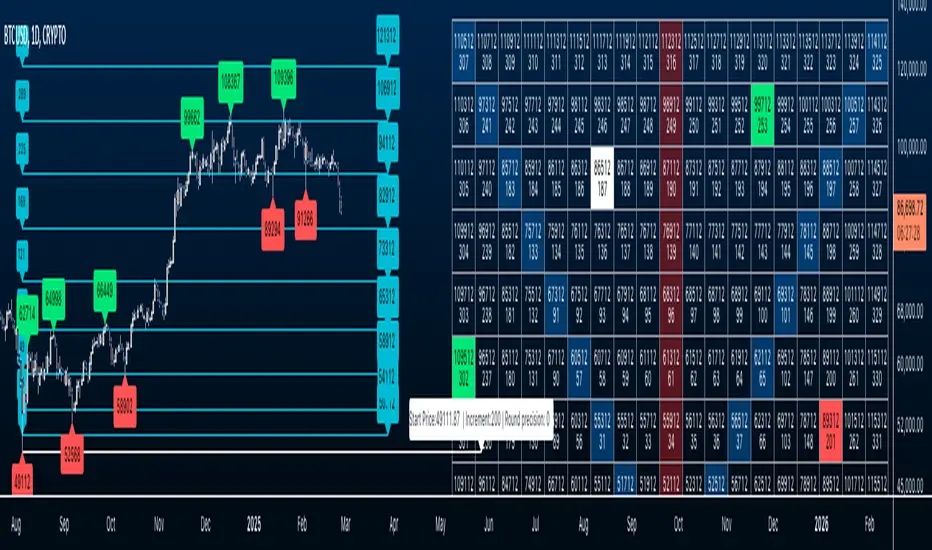
Doubled Numbered Square of Nine Progression | RegressionThe Doubled Number Square of Nine Progression | Regression Indicator enables forecasting of support and resistance levels using the SQ9 progression or regression from a user-selected pivot price. The indicator also plots adjustable pivots on both the chart and the Square of Nine.
How to use to for
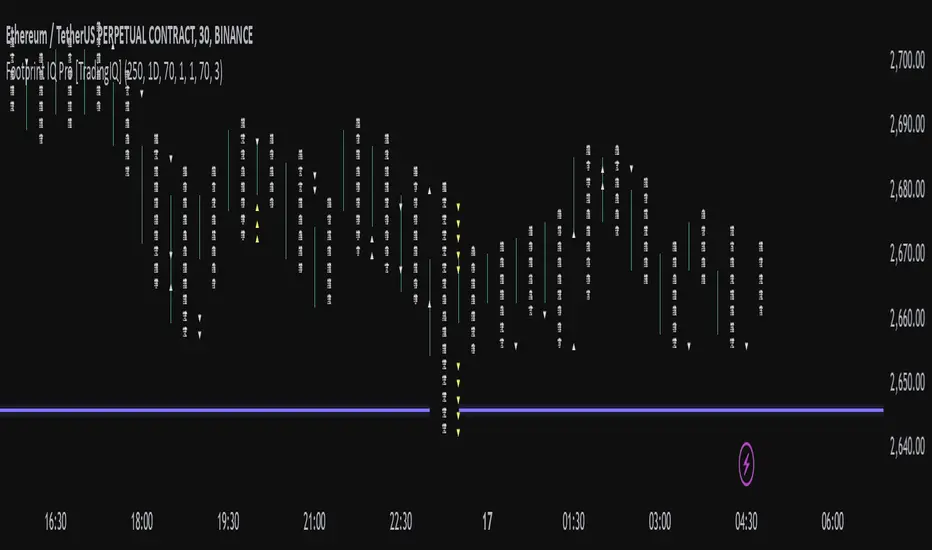
Footprint IQ Pro [TradingIQ]Hello Traders!
Introducing "Footprint IQ Pro"!
Footprint IQ Pro is an all-in-one Footprint indicator with several unique features.
Features
Calculated delta at tick level
Calculated delta ratio at tick level
Calculated buy volume at tick level
Calculated sell volume at tick level
Imbala
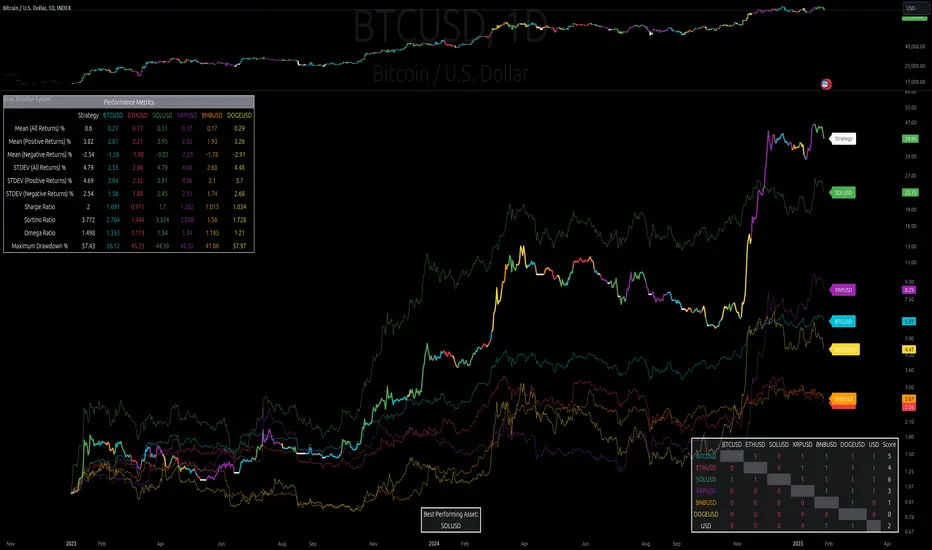
Asset Rotation System [InvestorUnknown]Overview
This system creates a comprehensive trend "matrix" by analyzing the performance of six assets against both the US Dollar and each other. The objective is to identify and hold the asset that is currently outperforming all others, thereby focusing on maintaining an investment in the most "op
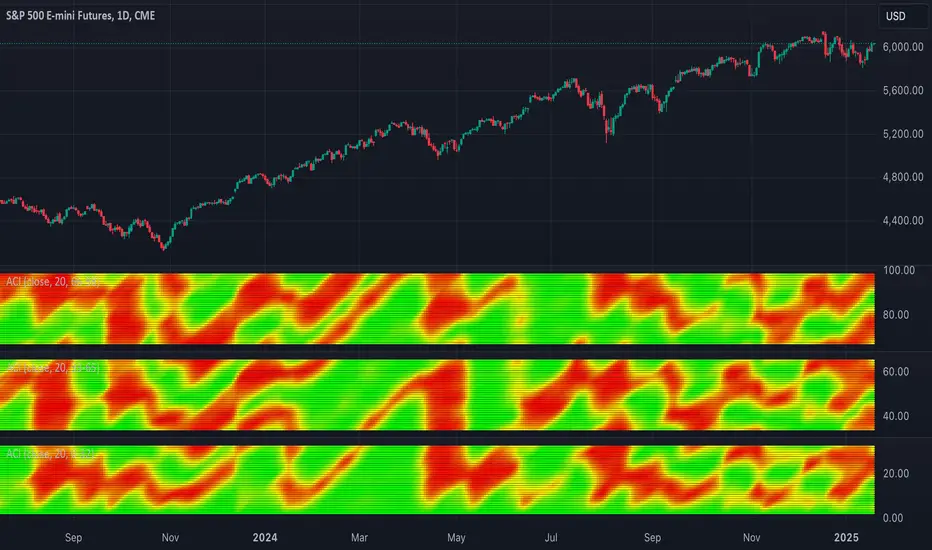
TASC 2025.02 Autocorrelation Indicator█ OVERVIEW
This script implements the Autocorrelation Indicator introduced by John Ehlers in the "Drunkard's Walk: Theory And Measurement By Autocorrelation" article from the February 2025 edition of TASC's Traders' Tips . The indicator calculates the autocorrelation of a price series across se
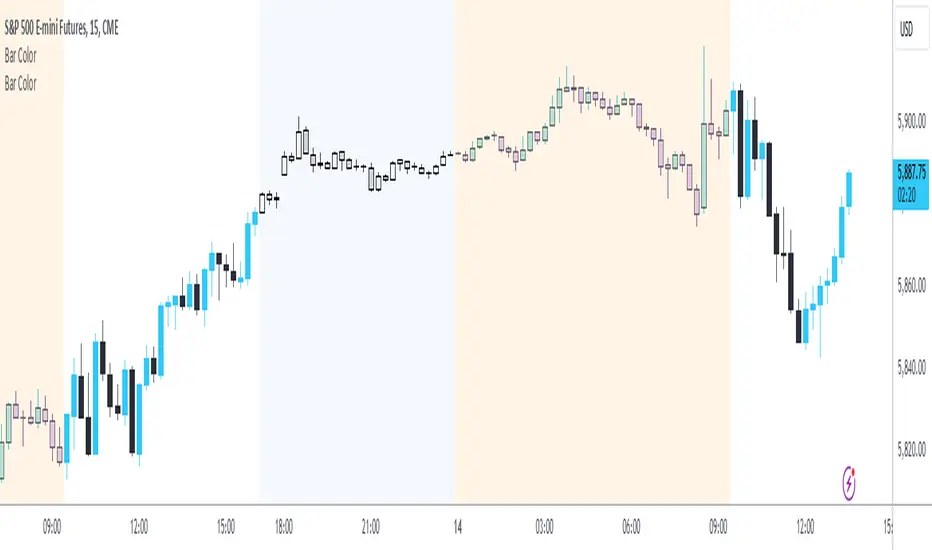
Session Bar/Candle ColoringChange the color of candles within a user-defined trading session. Borders and wicks can be changed as well, not just the body color.
PREFACE
This script can be used an educational resource for those who are interested in learning Pine Script. Therefore, the script is published open source and
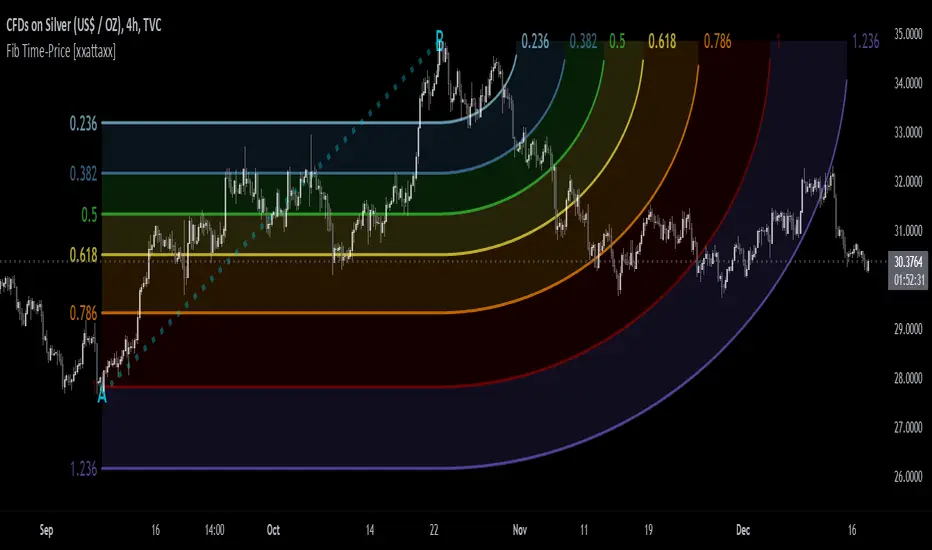
Fibonacci Time-Price Zones🟩 Fibonacci Time-Price Zones is a chart visualization tool that combines Fibonacci ratios with time-based and price-based geometry to analyze market behavior. Unlike typical Fibonacci indicators that focus solely on horizontal price levels, this indicator incorporates time into the analysis, provi
TASC 2025.01 Linear Predictive Filters█ OVERVIEW
This script implements a suite of tools for identifying and utilizing dominant cycles in time series data, as introduced by John Ehlers in the "Linear Predictive Filters And Instantaneous Frequency" article featured in the January 2025 edition of TASC's Traders' Tips . Dominant cycle

See all editors' picks scripts