February trading rule The idea is to grow a small 1200 account strictly trading my setup and see where we get to at the end of February.
This is a transparent journal and I will be sharing my thoughts as i trade.
Explore the community

Tariffs and Their Influence on GoldWe observed how gold has pivoted upward so precisely each time tariffs were applied since the start of the trade war in 2018.
Before the trade war, gold remained stagnant within this range. However, with the onset of the trade war, everything changed for gold.
We will conduct a case study since 20

GBPUSD Not Clear AT the MomentFrom a daily perspective Swing structure remains bullish and we still maintain the bias that price made a deeper pullback retesting the demand zone created on Nov 1, 2023.
Immediately we tapped into that demand zone, price shot up.
However, The daily internal structure remains bearish and until p

Gold Sector Outlook 2025: Is the Golden Era Just Beginning? Gold Sector Outlook 2025: Is the Golden Era Just Beginning? ✨🏆
Introduction
The gold sector is shining brighter than ever in 2025. With prices climbing rapidly amidst global economic uncertainty and rising geopolitical risks, the precious metal is once again a top choice for investors. But what’

WHAT'S FLOWING: TRUMP | METALS | INDEX | BTC
Key Observations from the Charts
1. USD/MXN (US Dollar to Mexican Peso) – Bullish
• The pair is trending upwards, with price breaking above recent resistance.
• Green Heikin Ashi candles confirm bullish momentum.
2. USD/CNH (US Dollar to Chinese Yuan) – Bullish
• Price is pushing higher, break

Tariffs, tariffs and more tariffs... What's next for the Dow?It seems like we are stepping into Tariff Wars 2.0, with the announcement of the tariffs on Canada, Mexico and China. But is the outlook really that bad? Let's take a look at the MARKETSCOM:US30 scenario.
TVC:DJI
74.2% of retail investor accounts lose money when trading CFDs with this provid

Time to add some Cybersecurity stocks to your Portfolio?In the video I take a look at FTNT, CRWD and FFIV and I bring the case for some cybersecurity investing.

From almost Blowing Funded account to being back in ProfitsThis was a perfect illustration of how our emotions can affect us and our trading decisions.
However through my 5 years of trading, I've been working on mastering my emotions as best as I can and as you guys can see-- I still had several times where I showed plenty of emotions. This leads me to co

The Quantum Capitalist $MU & $NEE Analysis 1/21/2025Simple strategy using top-down analysis to find entries, profit targets, and options contracts on Micron and Nextera Energy

XLM - Taking Over EUROPEAN BANKS MartyBoots here , I have been trading for 17 years and sharing my thoughts on xlm here.
xlm is looking beautiful , very strong chart for more upside
Very similar to XRP which mooned and will go higher
Do not miss out on xlm as this is a great opportunity
Watch video for more details

See all editors' picks ideas
Leap Ahead with a Regression Breakout on Crude OilThe Leap Trading Competition: Your Chance to Shine
TradingView’s “The Leap” Trading Competition presents a unique opportunity for traders to put their futures trading skills to the test. This competition allows participants to trade select CME Group futures contracts, including Crude Oil (CL) and

BTCUSDT soon below 100K$ and heavy fall will leadThis post is also educational and now as we can see the pump and breakout was fake and the fall started:https://www.tradingview.com/chart/BTCUSDT/sbV6gZGS-Bitcoin-major-sign-of-Stop-loss-hunting-and-dump-seen/
so the question is this that why we are looking for below 100K$ or 90K$?
1. first reason

8-Minute Guide to Trading Support & Resistance Feeling like you're guessing instead of trading? I've got you covered with this 8-minute crash course on finding support and resistance on TradingView. We'll look at where prices love to bounce back or break through, how to use that for your trades, and a quick trick to spot a real breakout.
Kris/

AMP Futures - Lock chart position when switching intervals.In this idea, we will demonstrate how to lock your chart position when viewing history anytime you switch from one-time interval to another.

Is Dogecoin at risk of being replaced by Musk-themed coins?Hello and greetings to all the crypto enthusiasts, ✌
Reading this educational material will require approximately 10 minutes of your time . For your convenience, I have summarized the key points in 10 concise lines at the end . I trust this information will prove to be insightful and valuable in

Earnings Season Playbook: What Traders Should Know to Stay Ahead🏈 It’s Earnings Season — Game On
Earnings season is the market’s quarterly equivalent of the Super Bowl (with just as much action) or the Oscars (minus the red carpet but with just as much drama). Every three months or so (every quarter), companies parade their financial performances, guiding tra

How To Navigate: Breakouts with Tools, Indicators & StrategyHaving a Clear and Precise understanding of whether you're dealing with a Breakout or False Breakout can help you:
1) Find potentially profitable opportunities
&
2) Avoid making risky investment moves!
Also knowing how to Confirm Trend Change can:
1) Rise probability of profitable trades
&
2) Limi

An Educational Journey into Technical Analysis with Dogecoin/USDIn this tutorial, we'll dive deep into the art of technical analysis using the Dogecoin USD chart as our canvas. You'll discover how to blend Fibonacci tools, Elliott Wave Theory, and the Wyckoff Method to forecast potential market movements. Whether you're new to trading or looking to refine your a

Using Volume to Validate Market MovesVolume is one of those metrics that often sits quietly at the bottom of your chart, unnoticed by many traders. Yet, it plays a critical role in understanding the market’s behaviour. Think of volume as the fuel behind price movements—without it, even the most promising breakout can fizzle out. But, j

Bitcoin: Don't be blind to the world (Trump inauguration)Regular readers will know that we avoid fundamental analysis In these reports - we stick to the price.
But that doesn’t mean being blind to the world around us.
On Monday January 20, Donald Trump will be inaugurated as US President.
I’m sure many of you have your political views about Trump - b

See all editors' picks ideas
February trading rule The idea is to grow a small 1200 account strictly trading my setup and see where we get to at the end of February.
This is a transparent journal and I will be sharing my thoughts as i trade.
Tariffs and Their Influence on GoldWe observed how gold has pivoted upward so precisely each time tariffs were applied since the start of the trade war in 2018.
Before the trade war, gold remained stagnant within this range. However, with the onset of the trade war, everything changed for gold.
We will conduct a case study since 20
GBPUSD Not Clear AT the MomentFrom a daily perspective Swing structure remains bullish and we still maintain the bias that price made a deeper pullback retesting the demand zone created on Nov 1, 2023.
Immediately we tapped into that demand zone, price shot up.
However, The daily internal structure remains bearish and until p
WHAT'S FLOWING: TRUMP | METALS | INDEX | BTC
Key Observations from the Charts
1. USD/MXN (US Dollar to Mexican Peso) – Bullish
• The pair is trending upwards, with price breaking above recent resistance.
• Green Heikin Ashi candles confirm bullish momentum.
2. USD/CNH (US Dollar to Chinese Yuan) – Bullish
• Price is pushing higher, break
Tariffs, tariffs and more tariffs... What's next for the Dow?It seems like we are stepping into Tariff Wars 2.0, with the announcement of the tariffs on Canada, Mexico and China. But is the outlook really that bad? Let's take a look at the MARKETSCOM:US30 scenario.
TVC:DJI
74.2% of retail investor accounts lose money when trading CFDs with this provid
Time to add some Cybersecurity stocks to your Portfolio?In the video I take a look at FTNT, CRWD and FFIV and I bring the case for some cybersecurity investing.
From almost Blowing Funded account to being back in ProfitsThis was a perfect illustration of how our emotions can affect us and our trading decisions.
However through my 5 years of trading, I've been working on mastering my emotions as best as I can and as you guys can see-- I still had several times where I showed plenty of emotions. This leads me to co
The Quantum Capitalist $MU & $NEE Analysis 1/21/2025Simple strategy using top-down analysis to find entries, profit targets, and options contracts on Micron and Nextera Energy
XLM - Taking Over EUROPEAN BANKS MartyBoots here , I have been trading for 17 years and sharing my thoughts on xlm here.
xlm is looking beautiful , very strong chart for more upside
Very similar to XRP which mooned and will go higher
Do not miss out on xlm as this is a great opportunity
Watch video for more details
EURCHF gaining the MOMENTUMHere we see prices were unable to form a lows. We can see bullish engulfing candle , and a proper break of structure that forms an order block which is now activated. Although it is an aggressive entry but can be a great opportunity if aligns with the momentum of pre London opening.

See all editors' picks ideas
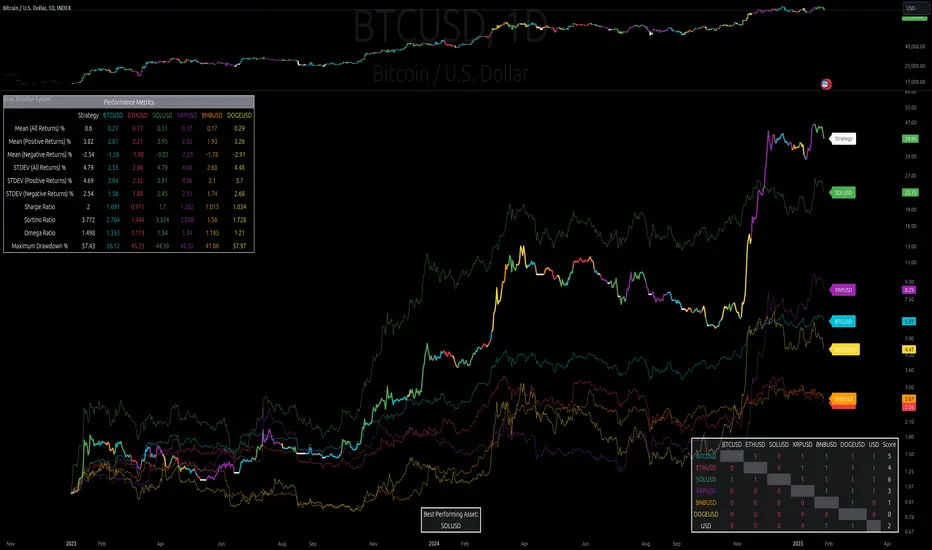
Asset Rotation System [InvestorUnknown]Overview
This system creates a comprehensive trend "matrix" by analyzing the performance of six assets against both the US Dollar and each other. The objective is to identify and hold the asset that is currently outperforming all others, thereby focusing on maintaining an investment in the most "op
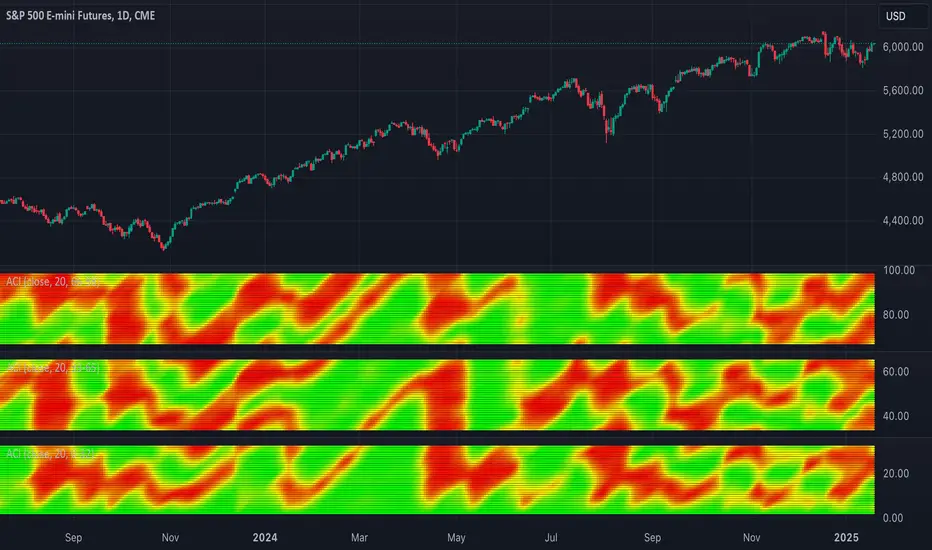
TASC 2025.02 Autocorrelation Indicator█ OVERVIEW
This script implements the Autocorrelation Indicator introduced by John Ehlers in the "Drunkard's Walk: Theory And Measurement By Autocorrelation" article from the February 2025 edition of TASC's Traders' Tips . The indicator calculates the autocorrelation of a price series across se
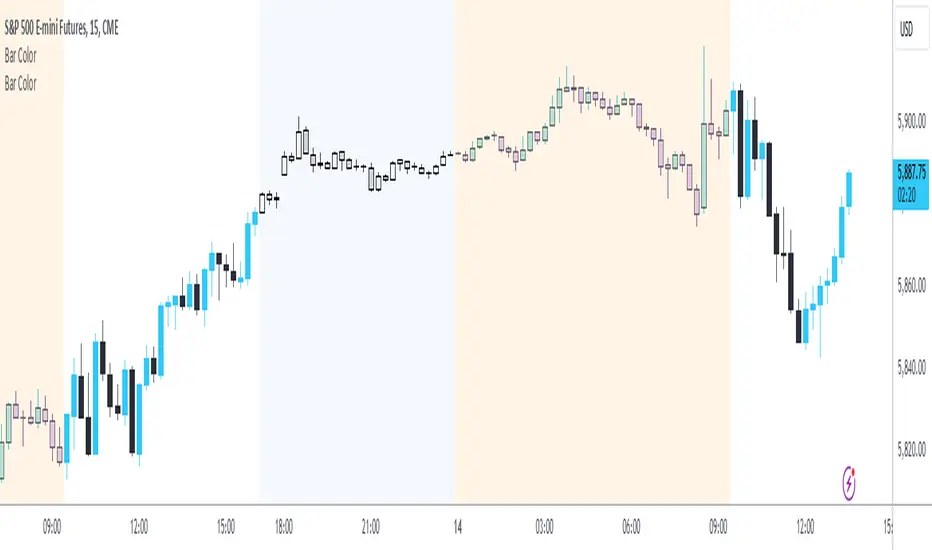
Session Bar/Candle ColoringChange the color of candles within a user-defined trading session. Borders and wicks can be changed as well, not just the body color.
PREFACE
This script can be used an educational resource for those who are interested in learning Pine Script. Therefore, the script is published open source and
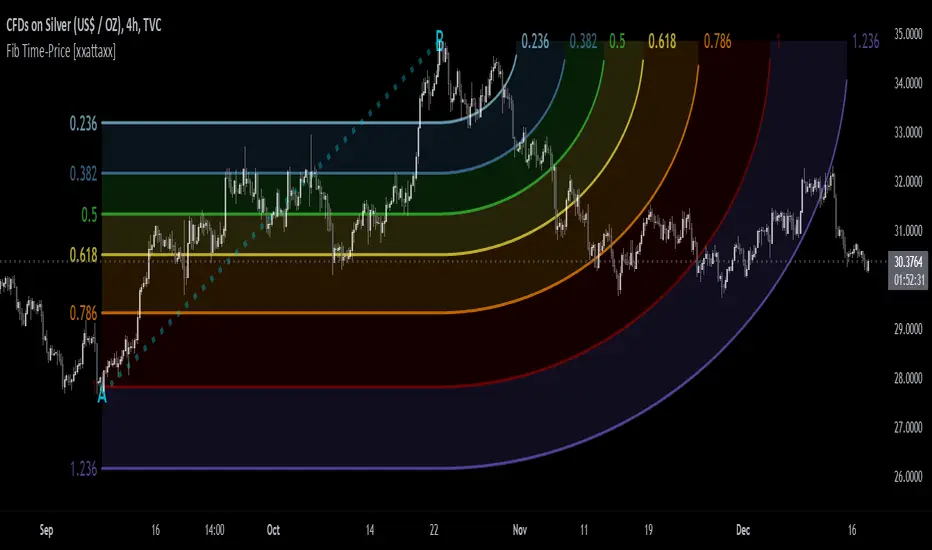
Fibonacci Time-Price Zones🟩 Fibonacci Time-Price Zones is a chart visualization tool that combines Fibonacci ratios with time-based and price-based geometry to analyze market behavior. Unlike typical Fibonacci indicators that focus solely on horizontal price levels, this indicator incorporates time into the analysis, provi
TASC 2025.01 Linear Predictive Filters█ OVERVIEW
This script implements a suite of tools for identifying and utilizing dominant cycles in time series data, as introduced by John Ehlers in the "Linear Predictive Filters And Instantaneous Frequency" article featured in the January 2025 edition of TASC's Traders' Tips . Dominant cycle

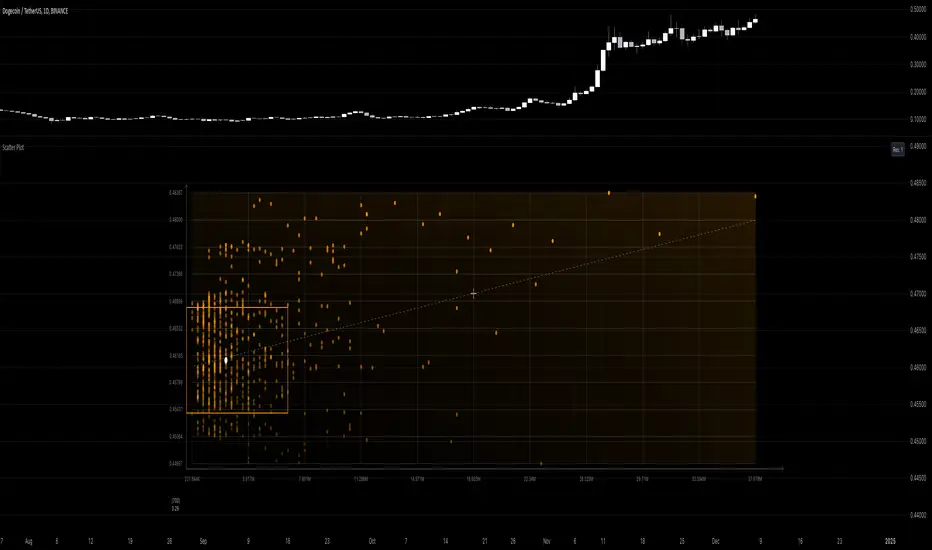
Scatter PlotThe Price Volume Scatter Plot publication aims to provide intrabar detail as a Scatter Plot .
🔶 USAGE
A dot is drawn at every intrabar close price and its corresponding volume , as can seen in the following example:
Price is placed against the white y-axis, where volume is represented o
Market Stats Panel [Daveatt]█ Introduction
I've created a script that brings TradingView's watchlist stats panel functionality directly to your charts. This isn't just another performance indicator - it's a pixel-perfect (kidding) recreation of TradingView's native stats panel.
Important Notes
You might need to adjust m

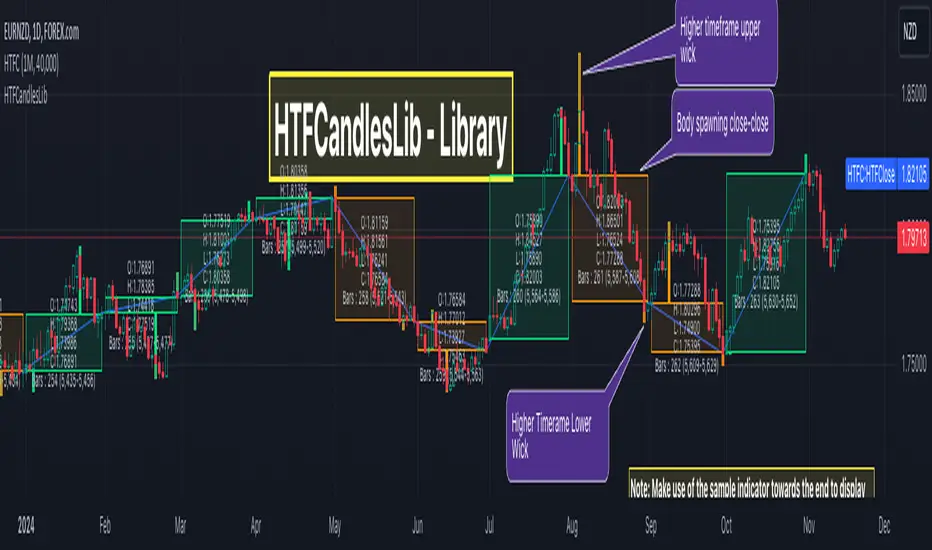
HTFCandlesLibLibrary "HTFCandlesLib"
Library to get detailed higher timeframe candle information
method tostring(this, delimeter)
Returns OHLC values, BarIndex of higher and lower timeframe candles in string format
Namespace types: Candle
Parameters:
this (Candle) : Current Candle object
de
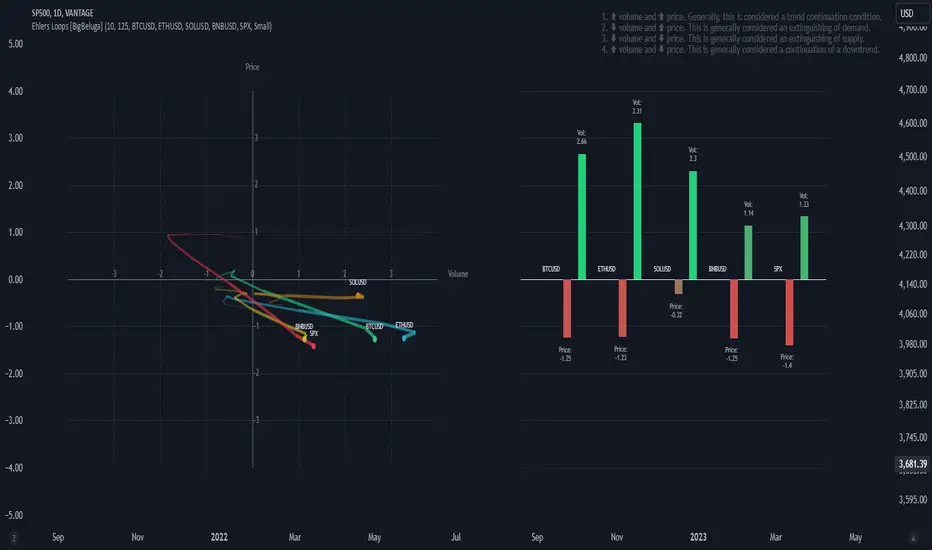
Ehlers Loops [BigBeluga]The Ehlers Loops indicator is based on the concepts developed by John F. Ehlers, which provide a visual representation of the relationship between price and volume dynamics. This tool helps traders predict future market movements by observing how price and volume data interact within four distinct
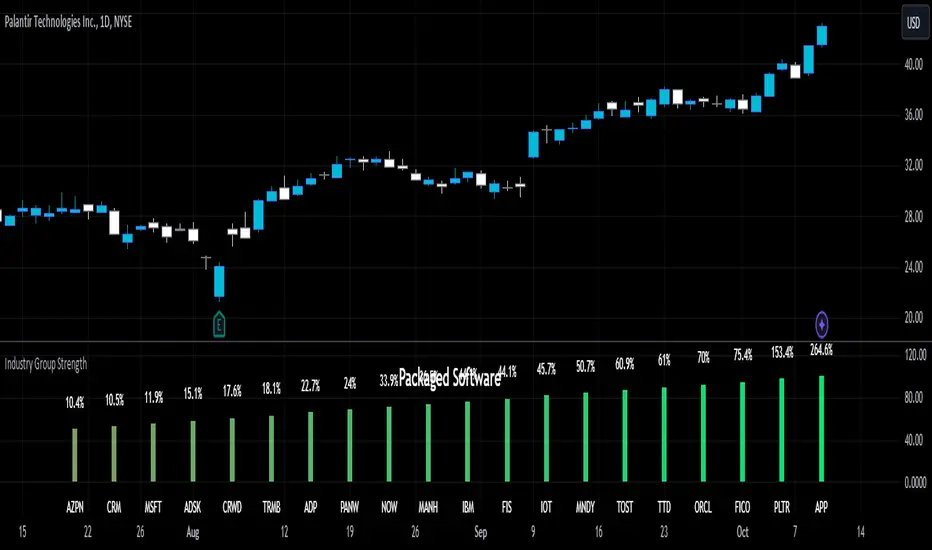
Industry Group StrengthThe Industry Group Strength indicator is designed to help traders identify the best-performing stocks within specific industry groups. The movement of individual stocks is often closely tied to the overall performance of their industry. By focusing on industry groups, this indicator allows you to
See all editors' picks scripts