Risk Management Is Not Protection... It’s Your Edge!!!Most traders treat risk management like a seatbelt.
Something you use just in case.
🧳Professionals treat risk management as their main edge.
Because in trading, you don’t get paid for being right...
you get paid for staying in the game long enough for probabilities to work.
1️⃣ Risk Is Defined Before the Trade Exists
Before you think about entries or targets, one question must already be answered:
Where am I wrong?
If you don’t know where your idea fails,
you’re not managing risk... you’re hoping.
Professionals define risk first.
The trade only exists after invalidation is clear.
2️⃣ Small Risk Creates Big Freedom
When risk is small and predefined:
- hesitation disappears
- emotions calm down
- execution improves
Why?
Because no single trade matters anymore.
You stop needing trades to work, and that’s when trading becomes objective.
3️⃣ Risk Management Turns Losses Into Data
Losses are unavoidable.
Damage is optional.
A controlled loss is not a failure; it’s information.
Every loss tells you:
- the market condition wasn’t right
- the timing was early
- or the structure changed
When risk is managed, losses educate instead of punish.
4️⃣ Consistency Is Built on Risk, Not Wins
Winning streaks feel good.
They don’t build careers.
Surviving losing streaks does.
Proper risk management ensures:
- drawdowns stay shallow
- confidence stays intact
- discipline stays repeatable
That’s how traders last long enough to improve.
💡The Real Truth
You don’t need a better strategy.
You need better control over downside.
Risk management is what allows:
- imperfect strategies to work
- average win rates to grow accounts
- traders to evolve instead of quit
⚠️ Disclaimer: This is not financial advice. Always do your own research and manage risk properly.
📚 Stick to your trading plan regarding entries, risk, and management.
Good luck! 🍀
All Strategies Are Good; If Managed Properly!
~Richard Nasr
Wave Analysis

Global Soft Commodity Trading: Dynamics and StrategiesUnderstanding the Global Soft Commodity Market
Soft commodity markets operate on a global scale, with production concentrated in specific regions and consumption spread worldwide. For example, coffee production is dominated by Brazil, Vietnam, and Colombia, while cocoa largely comes from West African nations such as Ivory Coast and Ghana. Sugar production is led by Brazil and India, whereas wheat and corn are heavily produced in the United States, Russia, and parts of Europe.
This geographical imbalance between producers and consumers makes international trade essential. Prices are generally discovered on major commodity exchanges such as the Chicago Board of Trade (CBOT), Intercontinental Exchange (ICE), and Euronext. These exchanges provide standardized futures and options contracts that allow producers, consumers, traders, and investors to hedge risk or speculate on price movements.
Key Drivers of Soft Commodity Prices
Soft commodity prices are influenced by a wide range of interconnected factors:
Weather and Climate Conditions
Weather is the single most important factor affecting soft commodities. Droughts, floods, cyclones, frost, and changing rainfall patterns can significantly impact crop yields. Climate phenomena such as El Niño and La Niña often cause global supply disruptions, leading to sharp price volatility.
Supply and Demand Dynamics
Changes in population, income levels, dietary habits, and industrial usage directly affect demand. For instance, rising coffee consumption in Asia or increased ethanol production boosting corn demand can alter global price trends.
Government Policies and Trade Regulations
Export bans, import duties, subsidies, and minimum support prices play a crucial role, especially in emerging economies. Policies in major producing countries like India, Brazil, or the United States can influence global supply availability and price stability.
Currency Movements
Since most soft commodities are priced in U.S. dollars, fluctuations in currency exchange rates impact international trade. A weaker dollar generally supports higher commodity prices, while a stronger dollar can suppress demand.
Logistics and Geopolitical Factors
Transportation costs, port congestion, trade routes, and geopolitical tensions can disrupt supply chains. Conflicts, sanctions, or shipping bottlenecks often translate into sudden price spikes.
Market Participants in Soft Commodity Trading
The global soft commodity market includes diverse participants, each with different objectives:
Producers and Farmers use futures contracts to hedge against adverse price movements and protect their income.
Processors and End Users such as food manufacturers and textile companies hedge to stabilize input costs.
Traders and Merchants act as intermediaries, managing storage, transportation, and arbitrage opportunities.
Speculators and Investors, including hedge funds and institutional investors, aim to profit from price movements and market trends.
Retail Traders increasingly participate through online platforms offering commodity derivatives and ETFs.
Trading Instruments and Strategies
Soft commodities can be traded through several financial instruments:
Futures Contracts are the most common, providing standardized exposure to commodity prices.
Options allow traders to manage risk with limited downside.
ETFs and ETNs offer indirect exposure for investors who do not wish to trade futures directly.
Spot and Physical Trading is mainly used by large commercial participants.
Successful soft commodity trading often relies on a blend of strategies:
Fundamental Analysis, focusing on crop reports, weather forecasts, acreage data, and inventory levels.
Technical Analysis, using price charts, trends, support-resistance levels, and momentum indicators.
Seasonal Trading, which takes advantage of recurring patterns related to planting and harvesting cycles.
Spread Trading, involving the price difference between related commodities or different contract months.
Risks and Volatility in Soft Commodity Markets
Soft commodities are known for high volatility due to their dependence on uncontrollable natural factors. Sudden weather changes or policy announcements can cause rapid price movements. Additionally, leverage in futures trading can amplify both profits and losses. Effective risk management through position sizing, stop-loss strategies, and diversification is essential for long-term success.
Another key risk is market uncertainty due to climate change, which has increased the frequency of extreme weather events. This has made price forecasting more challenging, increasing both risk and opportunity for traders.
Role of Emerging Markets and Sustainability
Emerging markets play a growing role in global soft commodity trading, both as producers and consumers. Rising incomes in Asia and Africa are driving demand for food commodities, while technological advancements are improving agricultural productivity.
Sustainability and ESG (Environmental, Social, and Governance) considerations are also reshaping the market. Ethical sourcing, carbon footprints, and sustainable farming practices increasingly influence investment decisions and trade flows. Certifications such as Fair Trade and organic labeling are becoming important price differentiators in global markets.
Future Outlook of Global Soft Commodity Trading
The future of global soft commodity trading is expected to be shaped by several long-term trends: climate variability, population growth, technological innovation in agriculture, and digitalization of trading platforms. Data analytics, satellite imagery, and AI-driven weather models are enhancing market transparency and decision-making.
At the same time, increased financial participation is likely to keep volatility elevated, offering both risks and opportunities. Traders who can combine strong fundamental understanding with disciplined technical execution will be better positioned to navigate these evolving markets.
Conclusion
Global soft commodity trading is a dynamic and multifaceted market that reflects the intersection of nature, economics, and finance. From coffee and cocoa to grains and sugar, these commodities are essential to everyday life and global trade. While the market carries significant risks due to volatility and uncertainty, it also offers substantial opportunities for informed and disciplined traders. A deep understanding of global supply chains, weather patterns, policy impacts, and market behavior is essential for success in the ever-evolving world of soft commodity trading.
A Strategic Approach to Profiting from Market InformationNews Trading Without Noise
In modern financial markets, news travels faster than ever. Economic data releases, central bank statements, corporate earnings, geopolitical developments, and even social media posts can move prices within seconds. While news creates opportunities, it also creates noise—misleading signals, emotional reactions, rumors, and short-term volatility that can trap unprepared traders. News trading without noise is the disciplined practice of extracting high-quality, actionable information from news while filtering out distractions, overreactions, and irrelevant data. This approach allows traders to participate in major market moves with clarity, confidence, and consistency.
Understanding the Difference Between News and Noise
Not all news is equal. Markets react strongly only to information that changes expectations. Noise, on the other hand, consists of repetitive commentary, speculative opinions, exaggerated headlines, and minor developments that do not materially alter fundamentals. For example, a central bank interest rate decision that deviates from expectations is meaningful news, while repeated media debates about possible outcomes before the announcement are often noise. Successful news traders focus on what is new, unexpected, and impactful, rather than what is loud or popular.
Noise is dangerous because it triggers emotional trading—fear of missing out (FOMO), panic selling, or impulsive entries. News trading without noise requires emotional detachment and a rules-based mindset, where decisions are driven by predefined criteria rather than instant reactions.
Focusing on High-Impact News Events
A noise-free news trading strategy begins with selectivity. Traders should focus only on high-impact, scheduled, and well-defined events such as:
Central bank interest rate decisions and policy statements
Inflation data (CPI, PPI), employment reports, and GDP figures
Corporate earnings from market leaders
Major geopolitical events that affect global risk sentiment
Low-impact data releases and speculative breaking news should be ignored unless they directly affect market expectations. By limiting attention to a small set of powerful events, traders reduce cognitive overload and improve decision quality.
Trading Expectations, Not Headlines
Markets move based on the gap between expectations and reality. A positive news headline does not always lead to rising prices if the market had already priced in better outcomes. News trading without noise means understanding consensus forecasts, market positioning, and sentiment before the event.
For instance, if inflation data comes in high but slightly below expectations, markets may rally despite inflation remaining elevated. Traders who focus only on the headline number may misinterpret the move, while those who analyze expectations understand the true driver. This expectation-based approach helps traders align with institutional flows rather than fighting them.
Using Price Action as the Final Filter
Price action is the most reliable filter against noise. Before acting on news, traders should observe how the market reacts in the first few minutes or hours. Strong, sustained moves with high volume often indicate genuine institutional participation, while sharp spikes followed by quick reversals usually signal noise-driven volatility.
News trading without noise does not mean reacting instantly. Instead, it means waiting for confirmation. Breakouts above key resistance levels, breakdowns below support, or continuation patterns after news provide clearer, lower-risk entry points. Letting price validate the news helps traders avoid false signals.
Timeframe Alignment and Patience
Many traders lose money by trading news on timeframes that do not match the event’s significance. Short-term scalping during major news releases is extremely risky due to slippage and whipsaws. Noise-free news traders often prefer higher timeframes—15-minute, 1-hour, or even daily charts—where the true impact of news becomes clearer.
Patience is critical. Not every news event needs to be traded immediately. Sometimes the best opportunity emerges hours or days later, once the market digests the information and establishes a clear trend.
Risk Management Over Prediction
A core principle of news trading without noise is accepting uncertainty. News outcomes are unpredictable, and even correct analysis can result in losses due to unexpected market reactions. Therefore, risk management is more important than prediction.
Traders should use predefined stop-loss levels, conservative position sizing, and avoid overexposure during high-volatility periods. Protecting capital ensures longevity and reduces emotional pressure, making it easier to stay disciplined and ignore noise.
Avoiding Media and Social Media Traps
Financial media and social platforms often amplify noise. Sensational headlines, conflicting expert opinions, and real-time commentary can distort perception and push traders into impulsive decisions. Noise-free traders limit exposure to such inputs, relying instead on primary data sources, official releases, and their own analysis frameworks.
Developing a personal trading plan and sticking to it is the best defense against external influence. When traders know exactly what they are looking for, irrelevant information naturally fades into the background.
Building a Structured News Trading Framework
To trade news without noise, traders should create a structured framework that includes:
A predefined list of tradable news events
Clear rules for pre-news preparation and post-news execution
Specific technical levels for confirmation
Strict risk management guidelines
This structure transforms news trading from reactive gambling into a professional, repeatable process.
Conclusion
News trading without noise is not about being the fastest or reacting to every headline. It is about clarity, selectivity, and discipline. By focusing on high-impact information, understanding expectations, waiting for price confirmation, and managing risk carefully, traders can turn news from a source of confusion into a powerful trading edge. In an age of information overload, the ability to filter noise is not just an advantage—it is a necessity for consistent success in financial markets.

EURUSD: Wave Structure Education - Understanding Wave CountsEducational breakdown of wave structure counting using current EURUSD as a live example.
📚 WAVE STRUCTURE FUNDAMENTALS
Understanding wave counts is essential for identifying high-probability setups. Let's break down the key concepts using EURUSD's current structure.
🌊 WAVE 1 - The Foundation
Most Important Aspect: Wave 1 has two variations
Variation 1 - ABC Pattern:
Wave 1 forms as a corrective ABC structure before the main trend establishes.
Variation 2 - Straight Away:
Bearish: Higher High (HH) directly to Lower Low (LL)
Bullish: Lower Low (LL) directly to Higher High (HH)
Why This Matters:
Identifying which Wave 1 variation you're seeing helps you understand the strength and nature of the trend forming.
📈 EXTENSION WAVES - The Power Moves
Bearish Extension Pattern:
The sequence for bearish extensions:
Lower High (LH)
Higher Low (HL)
Lower High (LH)
Lower Low (LL)
Bullish Extension Pattern:
The sequence for bullish extensions:
Higher Low (HL)
Lower High (LH)
Higher Low (HL)
Higher High (HH)
Key Principle:
Extensions follow a specific pattern. Recognizing these sequences allows you to anticipate the completion point and trade accordingly.
💼 CURRENT EURUSD WAVE COUNT
Position: Bearish Wave 2 Extension (3 of 5)
What This Means:
We're in Wave 2 of the larger structure
Wave 2 is extending (showing the extension pattern)
Currently at position 3 within the 5-wave extension sequence
More downside expected to complete the extension
Trading Application:
Understanding we're in position 3 of 5 tells us:
Two more wave points to complete (4 and 5)
Wave 4 will be a pullback (selling opportunity)
Wave 5 will be the final leg down in this extension
🎓 Educational Takeaways:
1. Wave 1 Sets The Stage:
Always identify which Wave 1 variation you're seeing. ABC or Straight Away? This determines your initial bias.
2. Extensions Follow Patterns:
Both bullish and bearish extensions have specific sequences. Learn to recognize them.
3. Count = Roadmap:
When you know where you are in the wave count (like "3 of 5"), you know what's coming next.
4. Practice Required:
Wave counting takes time to master. Watch price action create these patterns repeatedly until recognition becomes second nature.
Summary:
Wave 1 has two variations: ABC or Straight Away (HH→LL / LL→HH)
Extensions follow patterns: Specific sequences for bullish/bearish
Current EURUSD: Bearish Wave 2 Extension, position 3 of 5
Next: Expect Wave 4 pullback, then Wave 5 completion
👍 Boost if you found this educational
👤 Follow for more wave structure lessons
💬 Questions? Drop them in comments

Why the Market Loves to Trap Traders!!!If trading ever feels personal, it’s not.
The market isn’t hunting you; it’s hunting liquidity.
Understanding this single idea changes how you read charts forever.
1️⃣ The Market Moves Toward Liquidity, Not Logic
Most traders expect price to move because a pattern is “complete” or a level is “perfect.”
In reality, price moves to where orders are sitting.
Where is liquidity usually found?
- Above obvious highs
- Below obvious lows
- Around round numbers
- Near breakout levels everyone is watching
The market goes where the orders are, not where traders hope it goes.
2️⃣ Breakouts Are the Most Common Liquidity Pools
When price approaches a clear resistance, traders place:
- breakout buys above
- stop-losses from shorts just above
That creates a liquidity magnet.
Price spikes above the level, fills those orders…
and often reverses sharply once liquidity is consumed.
That’s not manipulation... that’s mechanics.
3️⃣ Traps Reveal Who’s Really in Control
A trap happens when price:
- breaks a key level
- fails to follow through
- returns back inside the range
This tells you something critical:
➡️ The side that should have won… didn’t.
4️⃣ Professionals Don’t Chase; They Wait
Retail traders react to the breakout.
Professionals wait for the reaction after the breakout.
They ask:
- Did price accept above the level?
- Did momentum expand or fade?
- Did structure shift or snap back?
Patience turns traps into opportunities.
📚The Core Lesson
The market’s job is not to reward anticipation. It’s to test conviction.
Once you stop trading where everyone else enters and start observing who gets trapped,
price action becomes clearer, calmer, and more logical.
⚠️ Disclaimer: This is not financial advice. Always do your own research and manage risk properly.
📚 Stick to your trading plan regarding entries, risk, and management.
Good luck! 🍀
All Strategies Are Good; If Managed Properly!
~Richard Nasr
ESG and Carbon Credit TradingThe New Architecture of Sustainable Finance
In the modern global economy, sustainability has shifted from being a moral consideration to a strategic and financial imperative. At the center of this transformation lie ESG (Environmental, Social, and Governance) principles and carbon credit trading, two closely linked frameworks that are reshaping how businesses, investors, and governments measure value, manage risk, and pursue long-term growth. Together, they form the backbone of sustainable finance and climate-aligned markets.
Understanding ESG: Beyond Profits
ESG refers to a set of non-financial criteria used to evaluate a company’s operations and long-term resilience.
Environmental (E): How a company manages its impact on nature—carbon emissions, energy usage, waste management, water conservation, and biodiversity.
Social (S): How it treats employees, customers, and communities—labor practices, human rights, diversity, workplace safety, and customer responsibility.
Governance (G): How it is managed—board structure, executive compensation, transparency, shareholder rights, and ethical conduct.
Unlike traditional financial metrics that focus mainly on short-term profitability, ESG frameworks aim to capture long-term sustainability and risk-adjusted performance. Investors increasingly believe that companies with strong ESG practices are better positioned to handle regulatory changes, reputational risks, climate shocks, and social disruptions.
Why ESG Matters in Capital Markets
ESG has become a decisive factor in global capital allocation. Institutional investors, sovereign wealth funds, pension funds, and asset managers now integrate ESG scores into portfolio decisions. This shift is driven by three powerful forces:
Risk Management: Climate change, social unrest, and governance failures can destroy shareholder value. ESG analysis helps identify hidden risks.
Regulatory Pressure: Governments worldwide are mandating ESG disclosures, forcing companies to report sustainability metrics alongside financial results.
Investor Preference: A growing base of investors prefers companies aligned with ethical, environmental, and social responsibility.
As a result, ESG is no longer a “nice-to-have” feature—it directly affects stock valuations, borrowing costs, and access to global capital.
Carbon Credit Trading: Putting a Price on Pollution
Carbon credit trading is a market-based mechanism designed to reduce greenhouse gas emissions by assigning a monetary value to carbon dioxide and other greenhouse gases.
A carbon credit typically represents the right to emit one metric ton of CO₂ (or equivalent gases). Companies that emit less than their allowed quota can sell surplus credits, while high emitters must buy credits to offset excess emissions.
There are two major carbon markets:
Compliance Markets: Mandated by governments (e.g., cap-and-trade systems). Companies must comply with legally binding emission limits.
Voluntary Carbon Markets (VCMs): Companies voluntarily purchase credits to meet sustainability goals, net-zero pledges, or ESG commitments.
By attaching a financial cost to emissions, carbon trading incentivizes businesses to innovate, adopt cleaner technologies, and improve energy efficiency.
The Link Between ESG and Carbon Credit Trading
Carbon credit trading is a practical tool that directly supports the Environmental pillar of ESG. Companies with strong ESG strategies often use carbon credits to:
Offset unavoidable emissions
Achieve carbon neutrality or net-zero targets
Demonstrate measurable climate action to investors
Improve ESG ratings and sustainability scores
In essence, carbon markets convert climate responsibility into a tradable financial instrument, aligning environmental goals with market incentives.
Carbon Credits as a Financial Asset
Over time, carbon credits have evolved from regulatory instruments into tradable assets. They are now bought and sold by:
Corporations managing emissions
Financial institutions and hedge funds
ESG-focused investment funds
Commodity traders and exchanges
This financialization has increased liquidity, price discovery, and global participation, while also introducing volatility and speculation. Carbon prices now respond to policy changes, economic growth, energy transitions, and geopolitical developments—much like traditional commodities.
ESG Ratings and Corporate Strategy
Companies are increasingly embedding ESG into their core strategies rather than treating it as a compliance exercise. Carbon credit trading plays a critical role in this shift:
Operational Strategy: Firms invest in renewable energy, efficiency upgrades, and carbon offsets to reduce exposure to carbon costs.
Reputation Management: Transparent use of high-quality carbon credits enhances credibility with stakeholders.
Capital Access: Strong ESG performance lowers financing costs and attracts long-term investors.
However, the effectiveness of ESG depends on authentic action, not cosmetic compliance.
Challenges and Criticism
Despite their promise, ESG and carbon credit markets face several challenges:
Greenwashing: Some companies exaggerate ESG claims or rely excessively on low-quality carbon offsets.
Lack of Standardization: ESG ratings vary widely across agencies, creating confusion and inconsistency.
Carbon Credit Quality: Not all credits deliver real, additional, and permanent emission reductions.
Market Transparency: Voluntary carbon markets still lack unified oversight and pricing benchmarks.
These issues have sparked calls for stricter regulation, better disclosure standards, and improved verification mechanisms.
The Role of Technology
Technology is accelerating trust and efficiency in ESG and carbon markets:
Blockchain: Ensures traceability and prevents double-counting of carbon credits.
AI and Data Analytics: Improve ESG scoring, emissions tracking, and risk assessment.
Satellite Monitoring: Verifies forest conservation, renewable energy output, and land-use projects.
These innovations are helping transform ESG and carbon trading into more reliable and scalable systems.
Future Outlook: ESG and Carbon Trading as Economic Pillars
Looking ahead, ESG and carbon credit trading are expected to become central pillars of the global financial system. As climate risks intensify and governments tighten emissions regulations, carbon prices are likely to rise, making sustainability a competitive advantage rather than a cost burden.
Key future trends include:
Integration of carbon pricing into mainstream financial models
Expansion of regulated carbon markets across emerging economies
Greater convergence of ESG reporting standards
Increased investor scrutiny of carbon offset quality
Conclusion
ESG and carbon credit trading represent a fundamental shift in how markets define value, risk, and responsibility. By embedding environmental and social costs into financial decision-making, they bridge the gap between economic growth and planetary limits. While challenges remain, their evolution signals a future where sustainability and profitability are no longer opposing goals—but interconnected drivers of long-term success.
In this new financial architecture, companies that adapt early and authentically will not only comply with regulations but also gain strategic, reputational, and financial advantages in a rapidly changing world.

Why Risk–Reward Matters More Than Win Rate!!One of the biggest myths in trading is this:
“I need to win more trades to be profitable.”
✖️You don’t...
Some of the most profitable traders in the world win less than 50% of their trades.
So what’s the real edge?
👉 Risk–reward.
1️⃣ Win Rate Without Risk–Reward Is Meaningless
A trader who wins 70% of the time but risks 3 to make 1 is still bleeding slowly.
Meanwhile, a trader who wins only 40% of the time
but risks 1 to make 3 can grow consistently.🪜
Win rate tells you how often you’re right.
Risk–reward tells you how much it matters when you are.
2️⃣ Risk Defines the Trade Before Entry
Professionals don’t start with targets.
They start with invalidation.
They ask:
- Where is my idea wrong?
- Where does structure break?
- Where must I be out?
Only after risk is defined, do rewards become meaningful.🏆
If you don’t know where you’re wrong,
you don’t know what you’re trading.
3️⃣ Good Risk–Reward Creates Emotional Stability
When your risk is small and predefined:
- losses feel normal
- hesitation disappears
- overtrading drops
Why?
Because no single trade can hurt you badly❗️
Risk–reward doesn’t just protect your account.
It protects your mindset.
4️⃣ Risk–Reward Is What Builds Consistency
Consistency doesn’t come from winning streaks.
It comes from surviving losing streaks.📉
Proper risk–reward ensures:
- drawdowns stay shallow
- confidence stays intact
- discipline stays repeatable
That’s how traders last long enough to let probabilities work.
📚The Big Lesson
✔️You don’t need to be right more often.
✖️You need your winners to matter more than your losers.
When risk is controlled and reward is logical, trading stops feeling like gambling and starts feeling like execution.
⚠️ Disclaimer: This is not financial advice. Always do your own research and manage risk properly.
📚 Stick to your trading plan regarding entries, risk, and management.
Good luck! 🍀
All Strategies Are Good; If Managed Properly!
~Richard Nasr

Pharmaceutical Stocks: Growth, Stability, and OpportunitiesThe Healthcare Market
Pharmaceutical stocks represent companies engaged in the research, development, manufacturing, and marketing of medicines and healthcare products. These stocks play a crucial role in global equity markets because healthcare is a basic necessity, largely independent of economic cycles. As populations grow, age, and face new health challenges, the demand for medicines continues to rise, making the pharmaceutical sector one of the most resilient and strategically important industries worldwide.
Nature and Importance of the Pharmaceutical Sector
The pharmaceutical industry is built on innovation and scientific research. Companies invest heavily in research and development (R&D) to discover new drugs, improve existing treatments, and address unmet medical needs. This long-term focus makes pharma stocks unique compared to other sectors. While technology companies innovate in software or electronics, pharma firms innovate in human health, often requiring years of clinical trials, regulatory approvals, and large capital investments.
Pharma stocks are important not only for investors but also for society. Breakthrough drugs for cancer, diabetes, cardiovascular diseases, and infectious illnesses can significantly improve quality of life and extend life expectancy. Governments and healthcare systems depend on pharmaceutical companies to maintain public health, which ensures consistent demand for their products.
Types of Pharmaceutical Companies
Pharmaceutical stocks can broadly be divided into different categories. Large-cap pharmaceutical companies, often called “big pharma,” have diversified product portfolios, global distribution networks, and strong balance sheets. These companies usually provide stable revenues, regular dividends, and lower risk compared to smaller firms.
Mid-cap and small-cap pharma companies often focus on niche therapies, generic drugs, or contract manufacturing. While they carry higher risk, they can deliver higher growth if they succeed in expanding markets or securing regulatory approvals. Biotechnology companies, which are closely linked to pharma stocks, focus on cutting-edge research such as gene therapy, vaccines, and biologics. These stocks can be highly volatile but offer substantial upside potential.
Drivers of Growth in Pharma Stocks
Several factors drive the growth of pharmaceutical stocks. One of the most important is demographic change. Aging populations, especially in developed countries, increase demand for chronic disease treatments such as diabetes, arthritis, and heart-related conditions. At the same time, rising healthcare awareness and improving access to medicines in emerging markets support long-term growth.
Innovation is another key driver. Companies that successfully develop patented drugs enjoy pricing power and exclusivity for several years, leading to high profit margins. Vaccines, specialty drugs, and biologics have become major growth areas, particularly after global health crises highlighted the importance of rapid drug development.
Government healthcare spending and insurance coverage also influence pharma stocks. Increased public and private investment in healthcare infrastructure supports pharmaceutical sales. In many countries, policies encouraging generic drug use create opportunities for companies specializing in cost-effective medicines.
Risks Associated with Pharma Stocks
Despite their defensive nature, pharmaceutical stocks carry specific risks. One of the biggest challenges is regulatory uncertainty. Drug approvals depend on strict regulatory authorities, and delays or rejections can significantly impact a company’s share price. Even after approval, drugs may face post-marketing safety issues that lead to recalls or legal action.
Patent expiration is another major risk. When a blockbuster drug loses patent protection, generic competitors enter the market, sharply reducing revenues. This “patent cliff” can negatively affect earnings if companies fail to replace lost sales with new products.
Pricing pressure is also a growing concern. Governments and insurers often push for lower drug prices to control healthcare costs. This can reduce profit margins, particularly in developed markets. Currency fluctuations, especially for companies with global operations, can further affect financial performance.
Pharma Stocks as Defensive Investments
Pharmaceutical stocks are often considered defensive because demand for medicines remains relatively stable during economic downturns. Unlike sectors such as real estate or luxury goods, healthcare spending cannot be easily postponed. As a result, pharma stocks tend to show lower volatility during market corrections and provide portfolio stability.
Many large pharmaceutical companies pay consistent dividends, making them attractive to long-term and income-focused investors. Their strong cash flows allow them to reinvest in R&D while also rewarding shareholders. During periods of high inflation or market uncertainty, pharma stocks are often viewed as a safe haven.
Role of Emerging Markets and India
Emerging markets play an increasingly important role in the pharmaceutical industry. Countries like India and China have become major hubs for generic drug manufacturing and contract research. Indian pharmaceutical companies, in particular, are known for producing affordable medicines and supplying a large share of global generic drugs.
For investors, pharma stocks in emerging markets offer a balance of growth and cost efficiency. Expanding healthcare access, government support, and export opportunities contribute to long-term potential. However, these stocks may also face regulatory scrutiny from international markets, especially related to quality standards.
Investment Approach to Pharma Stocks
Investing in pharmaceutical stocks requires a long-term perspective. Fundamental analysis is crucial, focusing on a company’s product pipeline, R&D capabilities, regulatory track record, and financial strength. Diversification within the sector helps reduce risk, as not all drugs or companies succeed at the same time.
Some investors prefer large-cap pharma stocks for stability, while others allocate a smaller portion of their portfolio to high-growth biotech or specialty pharma companies. Monitoring clinical trial results, patent timelines, and policy changes is essential for informed decision-making.
Conclusion
Pharmaceutical stocks occupy a unique and powerful position in the global equity market. They combine elements of stability, innovation, and long-term growth driven by healthcare needs. While the sector faces challenges such as regulatory risks, patent expirations, and pricing pressures, its fundamental importance to society ensures sustained demand.
For investors, pharma stocks can serve as a defensive core holding while also offering opportunities for capital appreciation through innovation and emerging market growth. With careful analysis and a balanced approach, pharmaceutical stocks can play a vital role in building a resilient and diversified investment portfolio.

Why the Reaction Matters More Than the Level!!!Most traders spend their time hunting for the perfect level.✖️
Support. Resistance. Demand. Supply.
They draw the zone… and assume price must react.
But professionals know something crucial:
The level itself is not the edge.
The reaction is.
Here’s why.
1️⃣ Levels Are Common Knowledge
Everyone sees the same support.
Everyone sees the same resistance.
If levels alone were enough, everyone would be profitable.
A level is just a location.📍
It doesn’t tell you who is in control.
2️⃣The Reaction Reveals Intent
What matters is how price behaves at the level.
Ask yourself:
- Does price reject immediately or hesitate?
- Are candles impulsive or overlapping?
- Does price leave the level with strength or drift away slowly?
A strong reaction tells you:
➡️ One side stepped in aggressively.
A weak reaction tells you:
➡️ The level exists… but conviction doesn’t.
3️⃣ Clean Rejections Beat Perfect Levels
A slightly imperfect level with a violent reaction
is far more valuable than a textbook level with no follow-through.
Professionals wait for:
- sharp rejections
- momentum expansion
- structure confirmation
They don’t assume... they observe.
4️⃣ Failed Reactions Are Warnings
When price reaches a level and does nothing…
that silence is information.
Failed reactions often lead to:
- level breaks
- deeper moves
- trend continuation
The market is telling you:
➡️ “This level no longer matters.”
📚The Big Lesson
Levels tell you where to look.
Reactions tell you what to do.
If you shift your focus from drawing levels to reading behavior at levels,
your trading instantly becomes clearer and more objective.
⚠️ Disclaimer: This is not financial advice. Always do your own research and manage risk properly.
📚 Stick to your trading plan regarding entries, risk, and management.
Good luck! 🍀
All Strategies Are Good; If Managed Properly!
~Richard Nasr
Risk Psychology and Performance in Global Markets1. Defining Risk Psychology
Risk psychology, sometimes referred to as behavioral finance, examines how emotions, cognitive biases, and mental frameworks shape perceptions of risk and influence decision-making. Traditional economic theory assumes that market participants are rational actors who always make decisions based on complete information and logical analysis. However, decades of research, particularly by psychologists like Daniel Kahneman and Amos Tversky, have shown that human behavior often deviates from rationality. Traders may overreact to news, underestimate the probability of rare events, or follow herd behavior—actions that directly impact performance in global markets.
Risk psychology can be divided into several key dimensions:
Risk Perception: How individuals interpret and assess potential losses and gains.
Risk Tolerance: The degree to which an individual or organization is willing to accept uncertainty or potential financial loss.
Cognitive Biases: Systematic errors in thinking, such as overconfidence, anchoring, or confirmation bias.
Emotional Responses: Reactions such as fear, greed, panic, or euphoria that can override logical decision-making.
2. Cognitive Biases and Market Behavior
One of the central insights from risk psychology is that cognitive biases can significantly distort market performance. Some of the most influential biases include:
Overconfidence: Traders often overestimate their knowledge or forecasting ability, leading to excessive risk-taking or frequent trading. In global markets, overconfident investors may underestimate geopolitical risks or macroeconomic uncertainties, which can result in large losses.
Loss Aversion: This is the tendency to weigh potential losses more heavily than equivalent gains. In volatile markets, loss-averse behavior can lead investors to exit positions prematurely, missing potential recoveries.
Herding: Many investors follow the actions of the majority rather than independent analysis, leading to bubbles and crashes. The 2008 global financial crisis and other market corrections illustrate how herding behavior amplifies systemic risk.
Anchoring: Market participants often rely too heavily on a reference point, such as a stock's past high, when making decisions. This can lead to mispricing in fast-moving global markets.
These biases illustrate that market performance is as much about managing internal psychological factors as it is about external economic conditions. Recognizing and mitigating these biases is essential for achieving consistent performance.
3. Emotional Drivers in Global Markets
Emotions are another powerful factor affecting performance. Fear and greed are two dominant emotions influencing trading decisions:
Fear: Sudden market downturns, geopolitical events, or economic crises can trigger fear, leading to panic selling. Fear-driven actions often exacerbate volatility and can result in substantial losses.
Greed: Conversely, the desire for high returns can push investors into over-leveraged positions or speculative assets. Excessive greed may lead to ignoring warning signals, contributing to financial bubbles.
In global markets, these emotions are amplified by the 24/7 nature of trading, high-speed information flow, and exposure to international geopolitical and macroeconomic events. Investors must develop emotional discipline to withstand market volatility and maintain long-term performance.
4. Risk Tolerance and Portfolio Management
Risk psychology directly informs risk tolerance, which is crucial for portfolio construction and investment strategy. Understanding one’s own risk profile—or that of an organization—is essential for aligning investment choices with financial goals and market conditions.
Conservative Investors: Prefer stable, low-risk assets even if returns are modest. They may underperform in bullish markets but avoid significant drawdowns during crises.
Aggressive Investors: Willing to take on higher risk for the potential of greater returns. Their performance can be stellar in favorable conditions but highly volatile during downturns.
Institutional Risk Management: Large global institutions often implement structured risk management frameworks that combine quantitative models with psychological insights to mitigate irrational decision-making among traders.
Balancing risk tolerance with market opportunities is a core component of consistent performance. Investors who fail to match their strategies with their psychological profile often make impulsive decisions that negatively affect returns.
5. The Impact of Risk Psychology on Market Trends
Risk psychology doesn’t just affect individual investors—it can influence global market trends. Collective human behavior, shaped by shared perceptions of risk and sentiment, can drive market cycles:
Bull Markets: Optimism and reduced risk perception fuel buying, often inflating asset prices beyond fundamental values.
Bear Markets: Pessimism and heightened fear lead to selling, creating sharp declines.
Volatility Spikes: Emotional reactions to unexpected events, such as geopolitical crises or central bank announcements, can result in abrupt market swings.
Market sentiment indicators, like the Volatility Index (VIX), are essentially measures of collective risk psychology. Traders and institutions often use these tools to gauge sentiment and anticipate potential market movements.
6. Strategies to Mitigate Psychological Risk
Given the profound influence of risk psychology on performance, it is crucial for market participants to implement strategies to manage these effects:
Education and Awareness: Understanding common biases and emotional triggers helps investors make more rational decisions.
Structured Decision-Making: Using checklists, rules-based systems, and quantitative models reduces the influence of emotion on trading decisions.
Diversification: Spreading investments across asset classes, geographies, and strategies mitigates the impact of unexpected events and reduces stress.
Regular Reflection and Journaling: Tracking decisions, outcomes, and emotional states helps identify patterns and improve future performance.
Stress Testing: Simulating adverse scenarios allows traders and institutions to anticipate emotional responses and refine risk management.
7. Conclusion
Performance in global markets is a complex interplay of economic fundamentals, technical analysis, and, importantly, human psychology. Risk psychology illuminates the ways in which emotions, cognitive biases, and perception of uncertainty influence market behavior. Traders and investors who cultivate self-awareness, emotional discipline, and structured decision-making frameworks can navigate market volatility more effectively and improve long-term performance.
Global markets are inherently uncertain, and even the most sophisticated models cannot fully predict outcomes. By understanding risk psychology, market participants gain a powerful tool: insight into their own behavior and the collective behavior of others. This understanding not only enhances individual performance but also contributes to a more stable and resilient financial system.
In essence, mastering risk psychology is not about eliminating risk—it’s about managing human responses to risk, aligning decisions with long-term goals, and leveraging an understanding of human behavior to thrive in the complex world of global finance.

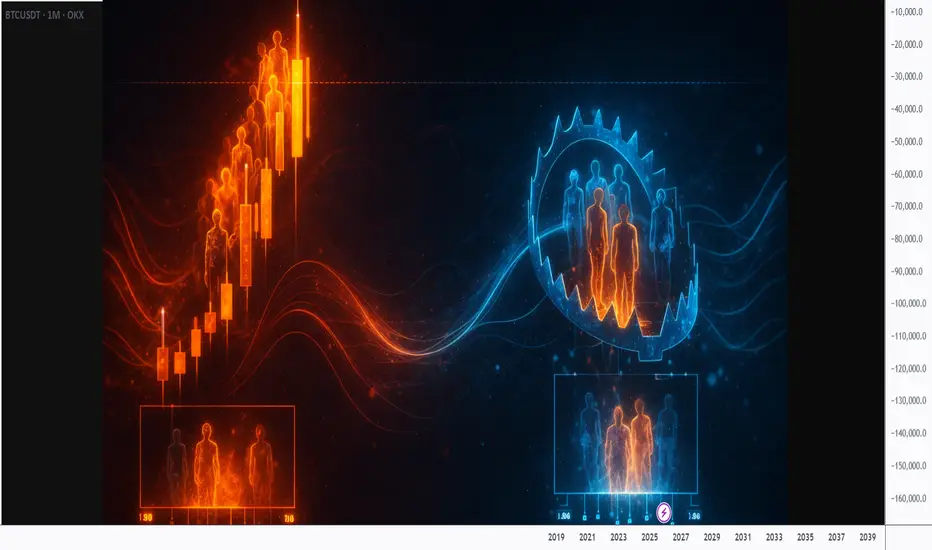
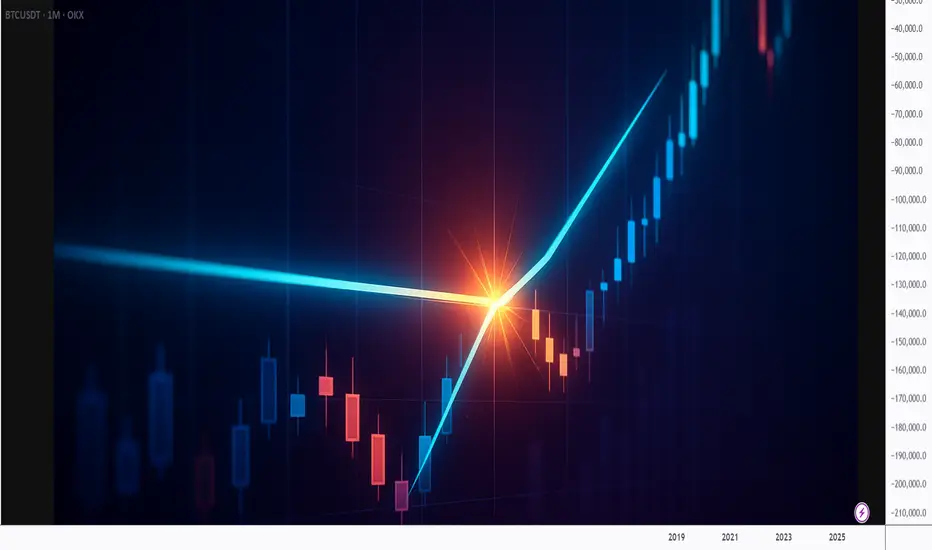
Leading Diagonals: Confusing Traders since 1880sSInce mid Nov 2025, traders have found it almost impossible to predict the pattern in Bitcoin, Coreweave, NBIS kind of charts and rightly so, because leadign diagonal has entered the room.
So what is a leading diagonal . In Elliot wave theory, a leading diagonal appears at the start of a new trend. In short,
- It looks like a wedge with overlapping waves
- Forms when a trend is trying to begin but lacks full conviction
- Indicates early positioning before broader participation
- Is usually followed by a strong, decisive move once belief catches up
Think of it as the market testing new direction, before committing to it.
How the market feels when a leading diagonal is forming:
Conflicted rather than confident. Price is moving in the direction of the new trend, but the underlying conviction isn’t fully there yet.
1. Early believers vs. skeptics
A new trend is trying to start, but most participants are still anchored to the prior trend. Early buyers (or sellers) step in, yet they’re repeatedly met with profit-taking and countertrend pressure.
2. Momentum exists, but it’s uneven
You’ll often see overlapping waves, shallow follow-through, and corrective pullbacks that feel premature. This reflects commitment without consensus.
3. Volatility stays elevated
Because conviction is low, price tends to swing more than it should in a healthy impulse. Stops get hunted, and false breaks are common.
4. Participation is selective
Smart money is probing. Retail is hesitant. Volume often fails to expand cleanly because positioning is still being tested rather than fully deployed.
5. Pressure quietly builds
Each push forward that doesn’t fully fail chips away at skepticism. By the time the diagonal completes, positioning is often lopsided, setting up the sharp move that usually follows.
In short ,
A leading diagonal feels like a market arguing with itself. Direction is emerging, but belief hasn’t caught up yet. That internal debate is exactly why the structure looks messy and why the resolution afterward tends to be decisive.
So how to identify a leading diagonal technically:
1. Wave count: Five waves (1–2–3–4–5), but waves overlap (Wave 4 overlaps Wave 1).
2. Shape : Price compresses into a wedge (contracting or expanding).
3. Momentum : Progress is directional but uneven, with shallow follow-through.
4. Trendline s: Upper and lower boundaries converge or diverge, not parallel like an impulse.
5. Confirmation : The move after the diagonal is typically sharp and fast, validating the pattern.
6. Usually, : Wave a or 1 is longest and wave c or (iii) cannot be shortest amount the up waves
In essence, if price is advancing, overlapping, and compressing early in a move,while still making progress, you’re likely looking at a leading diagonal.
What do indicators show when a leading diagonal is forming ?
RSI
-Often shows weaker momentum on Wave 3 than expected.
- May produce early divergence even though price is still advancing.
- Tends to stay capped (bullish case) instead of trending strongly.
MACD
- Momentum expands initially, then fails to accelerate.
- Histogram peaks early and flattens as price continues.
- Signal line crosses are frequent, reflecting overlap and indecision.
How to trade a leading diagonal ?
- Leading diagonals overlap and retrace deeply. If you size or manage it like a clean Wave 1, you’ll get chopped.
- The safest entry is from Wave 4 → Wave 5, Stops usually go beyond the Wave b or wedge invalidation level.
- Best approach WAIT: The highest-quality trade often comes after the diagonal finishes.
- What to wait for: Clean break of the wedge, Momentum expansion (RSI/MACD confirmation), Strong follow-through in the next impulse
- Breakouts inside the diagonal frequently fail so avoid chasing internal breakouts. If price breaks a boundary but momentum and volume don’t expand, assume it’s noise.
A leading diagonal is the market warming up. The real opportunity comes once it’s done arguing.

BITCOIN'S ALL TIME HISTORY CHART(KEY INSIGHTS)This is a breakdown of all major waves that have occurred in Bitcoin's History. This chart might explain why CRYPTOCAP:BTC has been the most successful coin while also answering if the growth will be sustained. This is a pretty standard 5 wave move- Waves 1 to 4 having been completed(shown in Red). We are on our last Major wave before it becomes a complete 5 wave impulse.
Wave 1(Red) was followed by a Zigzag correction for Wave 2, hence we expected a Flat correction For Wave 4. Keep in mind, this Flat correction had been predicted almost 2 and a half years before, when Wave 2 was completed! Wave 4 had 3 internal waves namely A,B and C- shown in Blue.
With Wave 4 complete, it was time to launch our 5th Wave of the Major impulse. This 5th Wave has 5 internal waves as is typical for impulses and are shown in Green. Once again, when Wave 1(Green) completes we see a Flat correction for Wave 2 meaning our Wave 4 would most likely be a Zigzag correction. Note that these two corrections are best seen on the Weekly and Daily Charts.
With Wave 4(Green) complete, what we are left with is Wave 5(Green) in its final developments. Once this Wave 5 is complete, this will be the Wave 5(Red) of Bitcoin. When this happens, it will be the end of the first impulse that started in 0ct. 2009 and the beginning of Wave 2, which will be a massive correction!

Volume Do Not Predict Price! - It Explains It!Most traders look at volume the wrong way.✖️
They expect volume to tell them where price will go next.
But volume’s real job is much more important:
Volume explains why price moved the way it did.
If you learn to read volume correctly, price action becomes clearer, not noisier.
1️⃣ Price Up + Rising Volume = Commitment
When price moves higher and volume expands, it means buyers are committed, not just reacting.
This is not random buying.
This is participation.
📈Rising volume during an impulse confirms that the move is supported by real interest, not just thin liquidity.
Strong trends are built on expanding volume.
2️⃣ Price Up + Falling Volume = Warning
When price continues higher but volume dries up, something changes.
The move still exists... but conviction doesn’t.
This often signals:
- exhaustion
- a potential pause
- or an upcoming correction
That’s when professionals stop chasing and start managing risk.
3️⃣ Sideways Price + Rising Volume = Accumulation or Distribution
This is where most traders get confused:
Price isn’t moving much, but volume is increasing.
That’s not boredom.
That’s positioning.
Large players don’t chase price.
They build positions quietly while price looks “dead.”
Breakouts that follow these zones tend to be fast and decisive, because the work was already done.❗️
4️⃣ Breakouts Without Volume Are Suspect
A breakout candle looks exciting.
But without volume, it’s just a move, not a decision.
Low-volume breakouts often lead to:
- fakeouts
- traps
- fast reversals
🏹Volume doesn’t need to explode... but it needs to confirm participation.
💡The Big Picture
Volume is not a signal by itself. It’s context.
Price tells you what happened, while Volume tells you how serious that move really was.
✔️When price and volume agree, trades feel easy.
✖️When they disagree, something important is hiding underneath.
⚠️ Disclaimer: This is not financial advice. Always do your own research and manage risk properly.
📚 Stick to your trading plan regarding entries, risk, and management.
Good luck! 🍀
All Strategies Are Good; If Managed Properly!
~Richard Nasr

Global Trade Costs, Inflation, and Interest Rates1. Global Trade Costs: What They Are and Why They Matter
Global trade costs refer to all expenses involved in moving goods or services from one country to another. These costs end up affecting product prices, competitiveness, and economic growth.
A. Components of Trade Costs
Transportation Costs
Shipping, aviation, trucking, rail freight
Fuel prices
Port handling and container charges
Insurance on cargo
When fuel prices rise or there is a shortage of containers (like after COVID-19), transportation costs shoot up sharply.
Tariffs
Governments impose taxes on imported goods. Tariffs can protect domestic industries but increase prices for consumers.
Non-Tariff Barriers (NTBs)
These include:
Quality standards
Product certifications
Customs procedures
Import quotas
Environmental and safety regulations
NTBs often add delays and compliance costs.
Exchange Rate Fluctuations
If a country’s currency weakens, its imports become more expensive; if it strengthens, imports become cheaper.
Political and Geopolitical Risks
War, sanctions, tensions between countries
Trade agreements collapsing
Piracy risks on shipping routes
These uncertainties raise risk premiums and insurance costs.
Logistical Efficiency
Countries with strong ports, roads, and customs technology have far lower trade costs.
B. Impact of High Trade Costs
Higher export and import prices
Reduced competitiveness in global markets
Lower consumer choices
Slowdown in global supply chains
Inflationary pressure, especially in import-dependent countries
Thus, trade cost is not just an economic number—it is a powerful driver behind global price movements.
2. Inflation: The Price Level That Affects Everyone
Inflation is the rate at which the general price level of goods and services rises over time. When inflation increases, money loses value, and purchasing power declines.
A. Major Causes of Inflation
Demand-Pull Inflation
When demand is higher than supply (e.g., festival season, economic boom), prices rise.
Cost-Push Inflation
When the cost of production increases—due to higher raw material prices, trade costs, or wages—producers raise prices.
Imported Inflation
Many countries depend on imports for food, energy, metals, or electronics.
If global trade costs increase or the currency weakens, import prices rise and inflation increases.
Supply Chain Disruptions
Events such as pandemics, geopolitical conflicts, and natural disasters break supply chains and reduce availability, leading to higher prices.
Monetary Factors
When central banks print too much money or keep interest rates too low, prices tend to rise.
B. Effects of Inflation
Reduced purchasing power
Higher cost of living
Lower savings value
Increased business uncertainty
Wage-price spiral
Pressure on governments and central banks to intervene
Moderate inflation is normal, but high inflation or hyperinflation can destabilize entire economies.
3. Interest Rates: The Financial Lever Controlling Inflation
Interest rates are the cost of borrowing money. Central banks (like the Federal Reserve, ECB, RBI, etc.) adjust interest rates to stabilize economic growth and inflation.
A. How Interest Rates Work
When interest rates rise:
Loans become expensive
Businesses reduce investments
Consumers cut spending
Savings become attractive
Economy slows
Inflation typically falls
When interest rates fall:
Borrowing becomes cheaper
Investment and consumption rise
Economy grows
If demand grows too fast, inflation increases
Interest rates are the primary tool used by central banks to fight inflation.
4. How Global Trade Costs, Inflation, and Interest Rates Interact
These three forces are deeply interconnected, and one change triggers reactions in the others.
A. High Trade Costs → Higher Inflation
When trade costs rise due to fuel surges, war disruptions, or container shortages:
Transportation becomes expensive
Imports cost more
Raw materials become pricier
Companies pass these costs to consumers
This leads to cost-push inflation, especially in developing countries dependent on imported commodities.
Examples:
Oil price increases raise transportation costs globally.
War in major shipping routes slow down container movement and raise freight rates.
B. Inflation → Higher Interest Rates
When inflation rises above a country’s target (usually 2–6%), central banks increase interest rates to cool the economy.
This is called monetary tightening.
Why?
Higher interest rates reduce demand in the economy and slow down price growth.
C. Higher Interest Rates → Higher Trade Costs
When interest rates rise globally:
The cost of financing ships, warehouses, and inventory increases
Multinational companies borrow less
Currency values fluctuate
Emerging markets face capital outflows
Trade slows, increasing per-unit shipping costs
Thus, interest rate hikes indirectly increase global trade costs.
D. Higher Interest Rates → Stronger Domestic Currency
This reduces imported inflation because foreign goods become cheaper.
But if a strong currency hurts export competitiveness, trade volumes may decline.
5. The Global Cycle: How One Factor Creates a Chain Reaction
A typical cycle looks like this:
Trade costs rise due to global disruptions.
This causes imported inflation.
Central banks respond by raising interest rates.
Higher interest rates:
slow down demand
reduce inflation
increase borrowing cost
Businesses cut production or trade volumes, which eventually lowers global trade costs again.
This balancing cycle is what keeps global markets stable over time.
6. Why These Factors Matter More Today
Global markets face many new challenges:
Fragmenting supply chains (“China+1” diversification)
Geopolitical tensions
Climate-related disruptions
Volatile energy prices
Uncertain global monetary policies
All these factors make the interaction between trade costs, inflation, and interest rates more unpredictable. Investors, traders, and policymakers must track them closely to anticipate market movements.
Conclusion
Global trade costs, inflation, and interest rates form a powerful economic triangle that influences every country, company, and consumer in the world. Trade costs shape prices, inflation determines purchasing power, and interest rates regulate economic stability. Their interaction drives global growth cycles, financial markets, and corporate strategies. Understanding this dynamic helps traders, economists, and students decode global market behavior in a clear, structured manner.

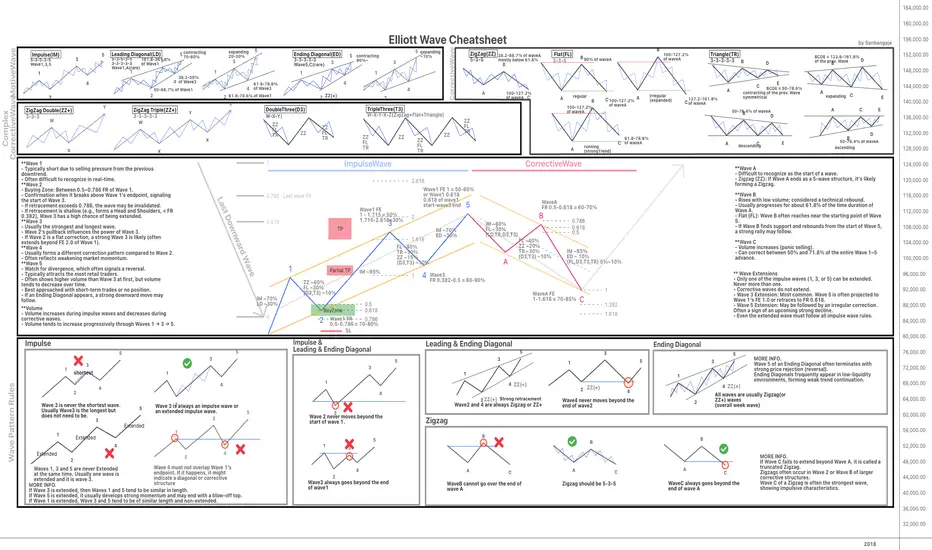
Elliott Wave Rules: Quick Cheatsheet for TradersHello everyone! I'm happy to share this Elliott Wave Cheat Sheet that I personally created during my journey. I hope this guide is helpful to the community.
This chart is designed to provide a quick, at-a-glance overview of the core Elliott Wave principles and patterns. Please note, it is just a summary of the main theories.
To dig into further and truly master the concepts, I highly recommend consulting the foundational texts:
* Elliott Wave Principle: Key to Market Behavior by A.J. Frost and Robert Prechter
* Mastering Elliott Wave by Glenn Neely
** Best viewed with QHD resolution (2560x1440)
** If the chart appears slightly squeezed vertically, you can adjust the aspect ratio by dragging the Price Panel (Y-axis) on the right side of the chart.**
**You can download the PNG version of this chart here:
drive.google.com
Happy Trading!
Swap Trading Secrets1. What Is a Swap?
A swap is a contract between two parties to exchange cash flows or financial obligations for a specified period. These exchanges typically involve interest rates, currencies, commodities, or credit risks.
Think of a swap like this:
You have one type of cash flow.
I have another.
We exchange them because each of us prefers the other’s structure.
This exchange helps both parties balance risk, stabilize cash flows, or lock in profits.
Swaps are custom-designed, traded over the counter (OTC), and not listed on exchanges.
2. Major Types of Swaps
To understand swap trading secrets, you first need to know the main types used globally:
1. Interest Rate Swaps (IRS)
Most common type.
Party A pays a fixed rate.
Party B pays a floating rate.
Useful for:
Hedging interest costs.
Managing debt efficiently.
2. Currency Swaps
Exchange principal + interest in different currencies.
Useful for:
Reducing currency risk.
Accessing foreign loans at cheaper rates.
3. Commodity Swaps
Fixed vs floating commodity prices.
Useful for:
Hedging input costs (oil, metals, agri).
Locking profit margins.
4. Credit Default Swaps (CDS)
Insurance against bond default.
Useful for:
Hedging credit risk.
Speculating on company survival.
5. Equity Swaps
Exchange equity returns for interest or another equity index.
Useful for:
Gaining exposure without owning the asset directly.
3. Why Swaps Are Considered a “Secret Weapon”
Swaps provide powerful advantages that many traders do not see:
A. Hidden Leverage
Institutions gain exposure to markets:
WITHOUT owning assets,
WITHOUT large upfront capital.
This makes swaps an efficient way to amplify returns.
B. Off-Balance-Sheet Benefits
Swaps can shift risks without moving assets on books, making financial statements look cleaner.
C. Customization
Unlike futures, swaps are tailor-made:
Amount
Duration
Payment structure
Asset type
Currency
This gives institutions almost unlimited flexibility.
D. Access to Better Pricing
Banks and hedge funds use swaps to:
Access lower foreign interest rates
Reduce borrowing costs
Hedge exposures cheaply
This pricing advantage is one of the biggest swap trading secrets.
E. Tax Optimization
Some institutions use swaps to:
Receive returns without triggering capital gains
Change income types for tax benefits
4. How Institutions Actually Use Swap Trading
Now let’s explore the real-world secrets of how swaps are used.
Secret 1: Hedging Interest Rate Risk Like a Pro
When interest rates rise or fall, companies with loans face huge cost changes.
So they use Interest Rate Swaps:
If expecting rates to rise → pay fixed, receive floating.
If expecting rates to fall → receive fixed, pay floating.
This stabilizes their cash flows.
Example:
A company with a floating-rate loan fears rising rates.
They enter a swap to pay 5% fixed and receive floating.
If floating rates shoot to 8%, the swap saves them millions.
Secret 2: Currency Swaps for Cheaper Global Loans
Corporations often borrow in foreign currencies.
But banks offer different interest rates in different countries.
So companies use currency swaps to borrow where rates are cheaper, then swap back to their local currency.
Example:
An Indian company might borrow yen at 1% instead of rupees at 7%, then swap obligations with a Japanese firm.
This cuts financing cost dramatically.
Secret 3: Equity Exposure Without Buying Shares
Hedge funds love equity swaps because they:
Get full market returns
Avoid ownership reporting
Avoid voting rights
Avoid taxes on buying/selling stocks
Can build secret positions
This is how some funds take huge equity bets without showing them publicly.
Secret 4: Commodity Swaps to Lock Prices Years Ahead
Airlines, manufacturers, and refiners use commodity swaps to stabilize costs.
Example:
An airline may fix jet fuel prices for three years through swaps, eliminating volatility.
This ensures consistent profit margins regardless of market swings.
Secret 5: Credit Default Swaps for Hidden Speculation
CDS contracts let traders “bet” on whether a company will default.
Professionals use CDS to:
Hedge corporate bond exposure
Take leveraged positions on credit quality
Profit from market panic or recovery
Some hedge funds made billions during the 2008 crisis via CDS trades.
5. Secret Trading Strategies Using Swaps
Let’s break down advanced strategies used in swap trading.
A. Swap Spread Trading
Traders exploit differences between:
Swap rates
Government bond yields
If swap spreads widen or narrow unexpectedly, traders enter opposite positions to profit from mean reversion.
B. Curve Steepening / Flattening Strategies
Traders use interest rate swaps to bet on the shape of the yield curve.
Steepener: receive fixed (long end), pay fixed (short end)
Flattener: opposite
These are used when expecting macroeconomic shifts.
C. Currency Basis Arbitrage
Banks exploit differences between:
Currency forward rates
Interest rate differentials
Swap rates
This arbitrage generates low-risk profits.
D. Synthetic Asset Exposure
Traders use swaps to create:
Synthetic bonds
Synthetic equity positions
Synthetic commodities
This avoids capital requirements and tax implications.
E. Hedged Carry Trades
Funds borrow in low-rate currencies and swap into higher-rate currencies while hedging currency risk.
This generates predictable “carry” income.
6. Key Risks in Swap Trading
Swaps are powerful, but they carry risks:
1. Counterparty Risk
If your swap partner defaults, you lose.
(This is what happened with Lehman Brothers.)
2. Liquidity Risk
Swaps cannot be easily sold like stocks.
3. Interest Rate / Market Risk
If the market moves against your swap position, you face large losses.
4. Valuation Complexity
Swaps require mark-to-market calculations.
5. Legal & Operational Risk
Documentation errors can cause disputes.
7. Why Retail Traders Rarely Use Swaps
Swaps require:
Large contracts
Institutional relationships
Legal agreements
Creditworthiness
Sophisticated pricing models
However, retail traders indirectly benefit through:
Mutual funds
ETFs
Banks
Derivative products
These institutions use swaps behind the scenes to improve performance.
Conclusion
Swap trading is one of the financial world’s most powerful, secretive, and flexible tools. Institutions use swaps to hedge risk, create leverage, optimize taxes, reduce financing costs, and structure sophisticated trading strategies across interest rates, currencies, commodities, and credit.
Even though retail traders rarely trade swaps directly, understanding them gives you insights into how the world’s largest financial players operate. If you understand swap dynamics, you gain a deeper understanding of global money flows, risk management, and institutional market behavior.
International Market Insights1. What Are International Markets?
International markets refer to financial markets operating across countries—where global investors trade stocks, currencies, bonds, commodities, and derivatives. These markets include:
a) Global Stock Markets
Major exchanges such as:
NYSE & Nasdaq (USA)
London Stock Exchange (UK)
Tokyo Stock Exchange (Japan)
Shanghai & Hong Kong Stock Exchange (China)
Euronext (Europe)
India's NSE & BSE (Emerging Markets)
International stock markets reflect global corporate earnings, economic health, and geopolitical stability.
b) Forex (Foreign Exchange Market)
The largest financial market globally, trading:
Major pairs (EUR/USD, USD/JPY)
Cross pairs (EUR/JPY)
Emerging market currencies (INR, BRL)
Forex movements show real-time global economic sentiment.
c) Commodity Markets
Global commodities such as:
Crude oil
Gold & silver
Natural gas
Base metals (Copper, Zinc)
Agricultural products (Soybean, Wheat)
d) Bond Markets
Sovereign and corporate bonds traded internationally reflect interest rates, inflation expectations, and risk appetite.
2. Why International Markets Matter
International markets provide insights into global:
Liquidity flow
Economic trends
Risk appetite
Corporate performance
Currency stability
Commodity cycles
For a trader or investor, global markets act like a “leading indicator.” For example:
If the U.S. markets fall sharply, Asian markets often open lower.
If crude oil prices rise, inflation risk increases globally.
If the USD strengthens, emerging markets often see capital outflows.
Understanding international markets allows better decision-making in:
Equity investing
Forex trading
Commodity trading
Options & derivatives
Business planning and imports/exports
3. Major Drivers of International Markets
A. Economic Indicators
Global markets move on key macroeconomic data such as:
GDP growth
Interest rates
Inflation (CPI, WPI)
Unemployment rate
Manufacturing PMI
Retail sales
Trade balance
For example:
Higher U.S. inflation → Higher chances of Federal Reserve rate hike → Strengthening USD → Weakening global equities.
B. Central Bank Policies
Central banks such as the Federal Reserve (Fed), European Central Bank (ECB), Bank of Japan (BOJ), and Reserve Bank of India (RBI) influence global liquidity.
Higher interest rates restrict liquidity → markets fall.
Lower interest rates create liquidity → markets rally.
C. Geopolitical Events
Events such as:
wars,
sanctions,
elections,
trade disputes,
diplomatic tensions,
immediately affect international markets.
Example:
Russia–Ukraine war → Crude oil and natural gas prices surged globally.
U.S.–China trade war → Impact on global supply chains and tech stocks.
D. Currency Movement
Currency fluctuations affect:
Import/export costs,
Foreign investment,
Commodity prices.
If USD rises:
Commodities like gold and crude become expensive.
Emerging market currencies weaken.
E. Corporate Earnings
Global companies like Apple, Tesla, Amazon, Samsung, and Toyota influence global investor sentiment.
Positive earnings → global market rally
Negative earnings → global correction
4. Key Global Market Trends to Track
1. US Market Trends
The U.S. market influences almost every other market. Key indices include:
Dow Jones
S&P 500
Nasdaq 100
Why important?
US technology and financial institutions dominate global markets.
The USD is the world’s reserve currency.
2. European Market Outlook
Important indices:
FTSE 100 (UK)
DAX (Germany)
CAC 40 (France)
Europe’s data impacts:
Auto sector
Banking
Energy markets
3. Asian Markets
Key markets:
Nikkei (Japan)
Hang Seng (Hong Kong)
Shanghai Composite (China)
Nifty & Sensex (India)
Asia is crucial for:
Manufacturing
Global supply chains
Technology components
Emerging market growth
4. Crude Oil Trends
Crude oil affects:
Inflation
Transportation
Trade deficit
Currency movement
Countries like India are heavily impacted by crude prices.
5. Gold Trends
Gold is a “safe-haven asset.” During fear or recession:
Gold prices rise
Stock markets fall
6. Bond Yields
US Bond yield (10-year) is a critical global indicator.
Rising yields → risk-off sentiment.
Falling yields → risk-on sentiment.
5. How International Markets Impact India
India is one of the world’s fastest-growing emerging markets. Global cues directly influence Indian equities, forex, and commodities.
a) US Market Impact
If the US markets fall:
FIIs withdraw from India
Nifty & Sensex fall
INR weakens
b) Dollar Index (DXY)
Rising DXY → pressure on emerging markets
Falling DXY → relief rally in equities and commodities
c) Crude Oil Movement
Higher crude = higher inflation = possible RBI rate hike
d) Global Risk Appetite
If global funds shift to safe assets such as bonds or gold, emerging markets see outflows.
6. Tools Used to Analyze International Markets
1. Economic Calendar
Tracks global economic events impacting market volatility.
2. Market Correlation Analysis
Example:
Nifty is highly correlated with S&P 500.
Gold is inversely correlated with USD.
3. Volume Profile & Market Structure
You can analyze:
Price action
Value areas
Global liquidity zones
(Useful for your interest in volume profile and structure-based trading.)
4. Global Indices Screeners
Tools to monitor:
Pre-market data
Futures
International indices
Currency heatmaps
Commodity charts
5. Central Bank Commentary
Federal Reserve statements often drive global markets for weeks.
7. Key Risks in International Markets
A. Geopolitical Risk
War, terrorism, sanctions.
B. Economic Policy Risk
Changes in:
Taxes
Trade tariffs
Government spending
C. Currency Risk
Sudden currency crashes affect global trade.
D. Interest Rate Risk
Rapid rate hikes cause:
Stock market crash
Bond market volatility
Capital flight from emerging markets
E. Commodity Price Shock
Crude oil spikes can trigger global recession fears.
F. Systemic Risk
Banking crisis, global debt crisis, or recession.
8. Future Trends Shaping International Markets
1. AI & Technology Dominance
AI, cloud computing, EVs, semiconductors will drive global market cycles.
2. De-dollarization Debate
Countries exploring alternative settlement systems could impact USD strength.
3. Supply Chain Realignment
Shift from China to India, Vietnam, Mexico.
4. Green Energy Revolution
Solar, hydrogen, EV batteries creating new global winners.
5. Digital Currencies
CBDCs (Central Bank Digital Currencies) will reshape global payments & forex markets.
Conclusion
International markets operate like a complex web connecting economies, currencies, commodities, and financial flows worldwide. Understanding these markets provides powerful insights into global opportunities, economic cycles, and risk management. For traders and investors—especially in countries like India—tracking global cues such as US market trends, crude oil, USD movement, geopolitical events, and central bank policies is essential for making informed decisions.

Inflation Impact on the Market1. Impact on Stock Market
Inflation influences stock markets in complex ways, creating both opportunities and risks for traders and investors.
a. Corporate Earnings and Profit Margins
When inflation rises, companies face higher costs for raw materials, labor, transportation, and utilities. If businesses cannot pass these costs to customers through higher prices, their profit margins shrink. Lower profits often lead to a decline in stock prices because investors expect reduced future earnings.
b. Investor Sentiment
High inflation creates uncertainty. Investors begin to worry about:
Reduced consumer spending
Declining profitability
Increased interest rates
Slower economic growth
This negative sentiment causes selling pressure in equity markets, especially in growth stocks.
c. Sector-Wise Impact
Inflation does not affect all sectors equally:
Beneficiaries: Energy, commodities, metal, mining, and FMCG often benefit because they can pass on higher costs to customers.
Losers: Technology, banking, real estate, and discretionary sectors often struggle because their valuations depend heavily on future growth. When inflation rises, the present value of future earnings decreases.
d. Value Stocks vs. Growth Stocks
Value stocks generally perform better during high inflation because they have stable cash flows today.
Growth stocks tend to underperform because higher inflation reduces the future value of their expected earnings.
2. Impact on Bond Market
Bonds are significantly affected by inflation because their returns are fixed.
a. Rising Inflation Reduces Bond Value
When inflation rises, the real return on bonds falls. For example, if a bond gives 6% interest and inflation rises to 7%, the bond has a negative real return of –1%. As a result, investors sell bonds, causing bond prices to fall and yields to rise.
b. Central Bank Response
To control inflation, central banks like the RBI typically raise interest rates. Higher interest rates push bond yields upward and reduce the attractiveness of older bonds with lower rates.
c. Impact on Long-Term Bonds
Long-term bonds suffer more during inflation because they lock in low interest rates for many years. Investors shift to short-term bonds or inflation-protected bonds.
3. Impact on Currency Market
Inflation directly influences exchange rates and currency strength.
a. Weakening Domestic Currency
When inflation rises in a country faster than its trading partners:
The domestic currency loses value
Imports become costlier
Foreign investors withdraw money
A weak currency increases inflation even more because imported goods like crude oil, electronics, and chemicals become more expensive.
b. Foreign Investment Outflows
High inflation reduces real returns for foreign investors. They move money to stable and low-inflation countries like the U.S., causing depreciation of the domestic currency.
4. Impact on Commodity Market
Commodity markets are highly sensitive to inflation because commodities are physical goods used in production.
a. Commodities Act as an Inflation Hedge
During inflation, investors prefer:
Gold
Silver
Oil
Natural Gas
Metals
These commodities usually rise in value, making them a hedge against inflation.
b. Cost-Push Inflation
When commodity prices rise, the cost of production increases for companies. This leads to:
Higher retail prices
Reduced consumer spending
Lower corporate profits
This is known as cost-push inflation, which slows economic growth.
5. Impact on Real Estate Market
Inflation influences real estate in multiple ways.
a. Rising Property Prices
Inflation increases the cost of construction materials like cement, steel, and labor. This results in:
Higher property prices
Increased rental yields
Real estate is often seen as a hedge against inflation.
b. Higher Interest Rates Affect Demand
When central banks raise interest rates:
Home loans become expensive
Demand for housing slows
Real estate transactions reduce
Thus, inflation can both push real estate prices up (due to costs) and reduce demand (due to financing costs).
6. Impact on Consumers
Inflation directly hits consumers’ pockets.
a. Reduced Purchasing Power
Consumers can buy fewer goods and services with the same amount of money. This reduces:
Savings
Consumption
Discretionary spending (luxury items)
b. Shift in Spending Patterns
Consumers prioritize essentials:
Food
Utilities
Healthcare
Transport
and reduce spending on:
Travel
Clothing
Electronics
Dining out
This shift affects sectors differently in the stock market.
7. Impact on Businesses
Companies face several challenges during inflation.
a. Higher Operating Costs
Input costs such as raw materials, transportation, and wages increase. Companies must decide whether to:
Pass higher costs to customers
Absorb the impact and reduce margins
b. Uncertain Forecasting
Inflation makes it difficult for businesses to plan:
Budgets
Future investments
Expansion strategies
High unpredictability leads to slower business growth.
c. Wage Inflation
Employees demand higher salaries to maintain living standards. Companies face increased payroll costs, which affects earnings.
8. Impact on Economic Growth
Inflation influences the broader economy through multiple channels.
a. High Inflation Slows Growth
If inflation rises too fast:
Consumption decreases
Investment slows
Borrowing becomes expensive
Business expansion reduces
This leads to slower GDP growth.
b. Risk of Stagflation
Stagflation refers to a situation where:
Inflation is high
Growth is low
Unemployment is rising
This is considered the worst-case economic scenario.
c. Central Bank Intervention
To control inflation, RBI raises interest rates and tightens monetary policy. Although this helps reduce inflation, it can slow economic momentum.
9. Impact on Investment Strategies
Traders and investors change strategies based on inflation trends.
a. Portfolio Rebalancing
Investors move money from:
Growth stocks → value stocks
Bonds → commodities
Domestic investments → foreign markets
b. Defensive Stocks Become Attractive
During inflation, sectors like:
FMCG
Utilities
Pharma
perform better because demand for their products remains stable.
Conclusion
Inflation plays a central role in shaping financial markets, economic conditions, business decisions, and investment strategies. While mild inflation indicates a healthy and growing economy, high or unpredictable inflation can create wide-ranging negative effects—market volatility, currency depreciation, reduced corporate earnings, and slower economic growth. Understanding how inflation impacts different sectors and asset classes helps investors make informed decisions and adapt their strategies based on current economic conditions.

Why Most Traders Misread Trends!!! (Fix It in 10 Seconds)Every trader talks about trends.
Few actually understand how to read them.
Most traders think a trend is defined by:
- a diagonal line
- a moving average
- or a breakout
But the truth is much simpler... and far more powerful:
A trend is defined by the quality of its pullbacks.
📚Here’s the 10-second method professionals use:
1️⃣ Shallow Pullbacks = Strong Trend
When pullbacks barely retrace and reverse quickly,
it means one side is overwhelming the other.
Momentum is healthy.
Continuation is likely.
A shallow pullback tells you:
➡️ “Don’t fade this. Follow it.”
2️⃣ Deep Pullbacks = Weakening Trend
When price retraces deep into the previous leg,
momentum is slowing and imbalance is shrinking.
Buyers are less aggressive.
Sellers are gaining confidence.
A deep pullback tells you:
➡️ “Trend still alive, but the engine is cooling.”
3️⃣ Chaotic Pullbacks = Trend Is Dying
If pullbacks become wide, choppy, overlapping, messy,
the trend is no longer in control.
It’s not a trend anymore.
It’s a negotiation.
A chaotic pullback tells you:
➡️ “Stop trading the trend. Wait for structure.”
📚Final Thought
The market isn’t random ... it’s rhythmic.
And pullbacks are the rhythm.
Once you learn to read that rhythm, you’ll stop fighting trends…
and start flowing with them.
⚠️ Disclaimer: This is not financial advice. Always do your own research and manage risk properly.
📚 Stick to your trading plan regarding entries, risk, and management.
Good luck! 🍀
All Strategies Are Good; If Managed Properly!
~Richard Nasr
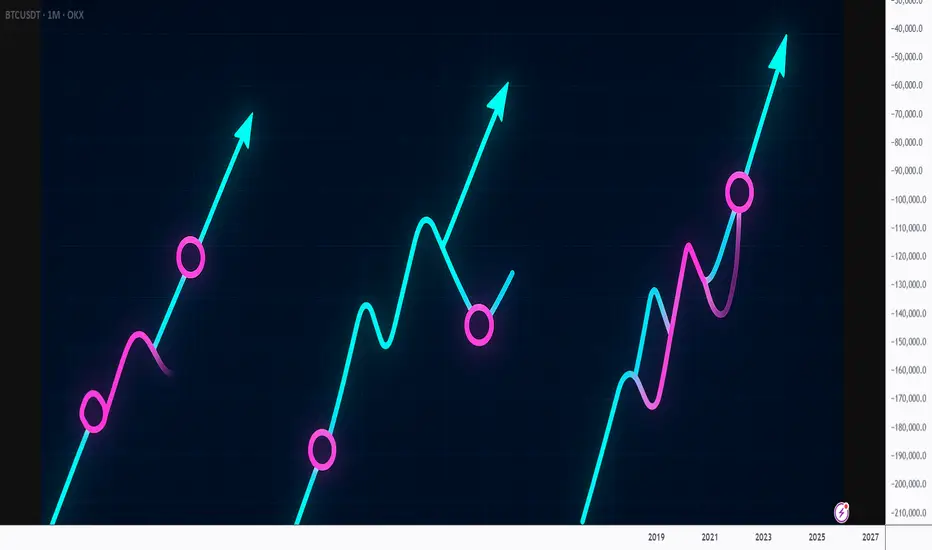
Derivatives and Hedging1. What Are Derivatives?
A derivative is a financial contract whose value is “derived” from an underlying asset.
The underlying can be:
Stocks
Indices (Nifty, Sensex, Dow Jones)
Currencies (USD/INR)
Commodities (gold, oil, silver)
Interest rates
Bonds
Cryptocurrencies
A derivative’s price depends on the price movement of these underlying assets.
Example:
If you buy a derivative contract on crude oil, the value of the contract changes with crude oil prices.
Derivatives are used for:
Hedging (reducing risk)
Speculation (betting on price movement)
Arbitrage (risk-free profit between markets)
Leverage (control large positions with small capital)
2. Why Derivatives Exist
Every market has uncertainty. Prices rise and fall due to:
Supply and demand
Economic conditions
Inflation
Geopolitical tensions
Monetary policies
Weather conditions (important in agriculture)
Derivatives allow traders and businesses to lock in costs and revenues, giving certainty and stability.
Example:
An airline uses derivatives to lock oil prices because fuel cost is a major expense.
A jeweller uses gold futures to secure gold price months in advance.
Thus, derivatives reduce uncertainty and protect profitability.
3. Major Types of Derivatives
There are four major types of derivatives:
3.1 Futures
A future is a legally binding contract to buy or sell an asset at a fixed price on a future date.
Features:
Traded on exchanges (NSE, BSE, CME)
Standardized contracts
Requires margin (not full payment)
Daily mark-to-market adjustments
Example:
Buying Nifty Futures at 24,000 means you commit to buy it on expiry at that price.
If Nifty rises to 24,500, you gain.
If falls to 23,500, you lose.
3.2 Options
An option gives you the right but not the obligation* to buy or sell an asset at a pre-decided price (strike price).
Two types:
Call Option – Right to buy
Put Option – Right to sell
Options buyers pay a premium, while sellers (writers) receive premium.
This is the most popular derivative instrument for hedging and speculation.
Example:
Buying a put option protects your stocks if the market falls.
This acts like an insurance policy.
3.3 Forwards
A forward contract is like a futures contract but traded privately (OTC – over the counter).
Features:
Custom agreements
Not exchange traded
Higher counter-party risk
Flexible terms
Used widely in:
Export/import business
Banks
Corporates managing currency and interest rate risk
3.4 Swaps
A swap is an agreement to exchange cash flows.
Most common types:
Interest Rate Swaps
Currency Swaps
Commodity Swaps
Example:
A company with a floating interest loan can swap it with a fixed rate to reduce risk.
4. What Is Hedging?
Hedging = Reducing or managing financial risk.
It involves taking a position in the derivative market opposite to your existing exposure.
The purpose is not to make profit, but to protect against loss.
Example:
If a farmer expects wheat prices to fall, he sells wheat futures to lock a price.
If a stock investor fears market correction, he buys put options for insurance.
Hedging is like:
Wearing a helmet while riding
Buying fire insurance for a factory
Airbags in a car
You hope not to use it, but you are protected when something goes wrong.
5. How Hedging Works (With Examples)
5.1 Stock Market Hedging
Suppose you have a portfolio worth ₹10 lakh and fear a short-term correction.
You buy a Nifty Put Option.
If the market falls:
Your portfolio loses value
But your put option gains
Losses get balanced
Your overall impact becomes minimal
This is called portfolio insurance.
5.2 Commodity Hedging
A gold exporter wants to lock selling price.
He sells gold futures at ₹62,000 per 10g.
If gold falls to ₹60,000:
He loses in physical market
Gains in future market
Net impact = protected revenue
5.3 Currency Hedging
An importer has to pay USD 1 million after 3 months.
He fears USD may rise and increase his cost.
He buys a USD/INR futures contract.
If USD rises:
He pays more in real world
Gains from USD futures
Total cost remains stable
5.4 Interest Rate Hedging
A company with floating-rate loans fears interest rates will rise.
Solution: Interest Rate Swap
They swap floating rate with fixed rate.
If rates rise, their cost stays fixed.
6. Why Hedging Is Important
Hedging ensures:
Stability of business profits
Predictable cash flows
Protection from catastrophic losses
Avoiding market shocks
Better planning and forecasting
In global markets, companies face:
Exchange rate volatility
Commodity price swings
Inflation
Interest rate fluctuations
Hedging becomes essential for survival.
7. Hedging vs Speculation
Aspect Hedging Speculation
Purpose Reduce risk Make profit
Risk Low High
Approach Opposite market position Same direction market bet
Used by Corporates, exporters, investors Traders
Profit Expectation Limited or none Unlimited potential
Hedgers use derivatives to protect themselves.
Speculators use derivatives to make gains.
Both together create market liquidity.
8. Advantages of Derivatives
Risk management
Price discovery
High liquidity
Low cost trading
Leverage enables big trades with small capital
Opportunity to short market easily
Global market linkage
Derivatives make markets more efficient and enable smoother functioning of financial systems.
9. Risks of Derivatives
While powerful, derivatives carry risks:
Leverage amplifies losses
High volatility
Complex structures
Counter-party risk in forwards
Regulatory risk
Potential for misuse
Over-speculation causing market stress
This is why exchanges enforce:
Margin systems
Position limits
Daily settlement
Strict surveillance
10. Role of Derivatives in Global Markets
Derivatives are vital for:
Managing global trade risks
Stabilizing prices for commodities like oil, gold, wheat
Supporting financial institutions
Allowing global investors to hedge international exposure
Facilitating cross-border capital flow
Every major economy relies on derivatives to maintain financial stability.
Conclusion
Derivatives and hedging are core pillars of modern finance.
Derivatives derive value from underlying assets and are used for hedging, speculation, and arbitrage.
Hedging protects against adverse price movements, offering stability to investors and businesses.
Though derivatives involve risks, proper use creates balance, efficient markets, and reduced uncertainty.
Whether you are an investor, trader, or business, understanding derivatives and hedging is essential for navigating today’s dynamic financial environment.

New Energy Market Trends1. Rapid Growth of Renewable Energy Capacity
One of the most dominant trends in the new energy sector is the unprecedented expansion of renewable power capacity—mainly solar, wind, and hydropower. Solar energy is leading the transition due to plummeting module costs, scalable technology, and supportive government policies. Large-scale solar parks, rooftop installations, and floating solar plants are becoming mainstream. Wind power, especially offshore wind, is growing rapidly thanks to improved turbine technology, higher capacity factors, and falling installation costs.
Developing countries, particularly India, China, and parts of Southeast Asia, are experiencing the fastest renewable capacity growth due to rising electricity demand and favorable national policies. Many countries are committing to Net Zero targets and increasing their proportion of renewable energy in the grid-mix. This shift is also being supported by private players, as corporate Power Purchase Agreements (PPAs) gain popularity for decarbonizing operations.
2. Energy Storage Becomes Essential for Grid Stability
With renewable energy’s intermittent nature, energy storage systems—especially lithium-ion batteries—have become critical. Storage allows solar and wind energy to be stored during peak production and used during high demand or low generation hours. This enhances grid reliability and reduces blackout risks.
Battery storage prices have been falling consistently, supported by innovation in lithium-ion chemistry, solid-state battery development, and economies of scale in production. Grid-scale battery farms, home energy storage, and industrial storage systems are growing globally. Additionally, alternative storage technologies like pumped hydro storage, flow batteries, and thermal energy storage are emerging as powerful solutions for long-duration needs.
Countries with high renewable penetration, such as Australia, Germany, and the United States, are heavily investing in hybrid renewable-plus-storage projects, which combine solar/wind with batteries to stabilize supply. This trend will continue as more renewable energy is integrated into power grids worldwide.
3. Green Hydrogen Gains Global Attention
Green hydrogen—produced using renewable energy through electrolysis—is becoming a key pillar of the clean energy transition. It provides a decarbonization pathway for hard-to-abate sectors like steel, cement, fertilizers, shipping, and heavy industries.
Major economies such as the European Union, Japan, South Korea, India, and China are investing heavily in national hydrogen strategies. Electrolyzer prices are expected to fall significantly as production scales up, similar to the trend seen in solar panels. Industrial clusters across the world are piloting hydrogen-based steel production, hydrogen fuel cells for vehicles, and hydrogen-powered power plants.
Hydrogen also acts as an energy storage medium, helping balance renewable power supply. The future will likely see widespread hydrogen hubs, export-import corridors, and integration with heavy industries.
4. Growth of Electric Vehicles (EVs) Reshapes Energy Demand
Electric mobility is one of the biggest disruptors in the energy market. EV adoption is accelerating due to falling battery costs, government incentives, improving charging infrastructure, and increasing environmental awareness. With automotive giants transitioning to all-electric fleets, EVs are reshaping the demand for electricity, metals, energy storage, and charging technology.
Charging infrastructure is becoming more widespread—public stations, fast chargers, home charging units, and battery swapping stations (popular in Asia) are expanding rapidly. Vehicle-to-grid (V2G) technology, which allows EVs to feed energy back into the grid, is another emerging innovation that may stabilize electricity networks.
The shift from internal combustion engines to EVs also affects the oil and gas industry, reducing long-term demand for petrol and diesel while increasing dependence on electricity and battery raw materials.
5. Digitalization and Smart Grid Technologies Transform Energy Systems
Smart grids and digital energy solutions are essential for managing the growing complexity of modern power systems. Real-time data, automation, smart meters, IoT-connected devices, and AI-driven energy management platforms are dramatically improving energy efficiency.
Smart grids help utilities balance demand and supply more effectively, reduce transmission losses, and manage decentralized renewable resources. Consumers also benefit through smarter home energy devices, solar-plus-storage systems, and real-time consumption insights.
AI and machine learning are being used for:
Predicting energy demand patterns
Optimizing renewable generation
Monitoring grid assets
Reducing energy waste
Enhancing power trading
Blockchain-based energy trading is also emerging, allowing peer-to-peer power purchase in local microgrids, making energy more democratized.
6. Carbon Markets and ESG Investing Accelerate Clean Energy Adoption
Global carbon markets—both compliance and voluntary—are growing as companies and nations commit to decarbonization. By putting a price on carbon emissions, governments incentivize cleaner technologies and penalize polluting industries. This pushes industries toward renewable energy, energy efficiency, and sustainable operations.
ESG (Environmental, Social, Governance) investing has gained tremendous momentum, with institutional investors increasingly allocating funds to companies with strong sustainability practices. Renewable energy companies, green bonds, and climate-focused funds are benefiting from this capital inflow.
Carbon credit trading, carbon offset projects, and nature-based solutions are becoming new investment categories. Companies are adopting internal carbon pricing to make environmentally conscious decisions and prepare for stricter regulations in the future.
7. Energy Transition Metals See Rising Demand
Clean energy technologies rely heavily on specific metals—lithium, cobalt, nickel, graphite, copper, and rare earth elements. As EVs, batteries, solar panels, and wind turbines scale up, demand for these minerals is surging.
This has triggered investments in sustainable mining, recycling technologies, and alternative materials to avoid supply chain bottlenecks. Countries are also exploring domestic mineral reserves to reduce dependence on dominant exporters. Circular economy initiatives—battery recycling, solar panel reuse, rare metal recovery—are gaining traction globally.
8. Distributed Energy and Microgrids Expand
Distributed energy resources (DERs) such as rooftop solar, small wind systems, home batteries, and local microgrids are becoming popular for both residential and commercial users. These systems reduce dependence on central grids and improve energy resilience.
Microgrids are particularly valuable for remote regions, military bases, industrial facilities, and disaster-prone areas. They can operate independently during grid failures, providing reliable and clean power.
DERs and microgrids help reduce transmission losses, lower consumer bills, and decentralize energy production—making energy more democratic and community-driven.
Conclusion
The new energy market is evolving faster than any previous phase in global energy history. Renewable power growth, battery storage, green hydrogen, EVs, smart technologies, and carbon markets are fundamentally reshaping how the world generates, distributes, and consumes energy. Innovations in digitalization, materials science, and policy frameworks further accelerate this transformation.
As nations pursue sustainability and energy security, the new energy sector will continue attracting massive investments and technological advancements, unlocking long-term economic, environmental, and social benefits. The coming decade marks a decisive shift towards decentralized, digital, and decarbonized energy systems—defining the future of global markets.

Emerging Market vs Developed Market1. Definitions
Developed Markets
Developed markets are countries with high economic maturity, advanced financial systems, strong institutions, and stable political environments. Their characteristics include high GDP per capita, industrial sophistication, deep capital markets, and steady (though slower) economic growth. Examples include USA, UK, Canada, Japan, Germany, France, Australia, and Singapore.
Emerging Markets
Emerging markets are economies transitioning from developing to developed status. They show rapid industrialization, expanding middle-class populations, improving institutions, and increasing integration with global markets. Examples include India, China, Brazil, Indonesia, South Africa, Mexico, Turkey, and Vietnam.
2. Key Characteristics
2.1 Economic Growth
Emerging Markets:
Faster GDP growth, driven by urbanization, industrial expansion, rising consumption, digital adoption, and favorable demographics. Annual growth often ranges from 4–7%.
Developed Markets:
Slower but stable growth, typically 1–3%, due to market maturity, ageing demographics, and saturated industries.
Implication: EMs offer growth potential; DMs offer stability.
2.2 Income Levels and Living Standards
Developed Markets:
High income, advanced infrastructure, strong social welfare systems, high productivity.
Emerging Markets:
Lower but rapidly rising incomes, infrastructure still developing, large segments transitioning to formal economy.
2.3 Financial Markets and Institutions
Developed Markets:
Deep, liquid, and highly regulated financial markets. Stock exchanges (e.g., NYSE, NASDAQ, LSE) exhibit high transparency and strong corporate governance.
Emerging Markets:
Growing markets but with lower liquidity, higher volatility, and varying investor protections. Institutional reforms are ongoing.
2.4 Currency Stability
Developed Markets:
Stable currencies, low inflation, credible central banks.
Emerging Markets:
More prone to currency fluctuations, inflation spikes, and external shocks due to reliance on imported commodities and foreign capital.
2.5 Political and Regulatory Environment
Developed Markets:
Predictable policies, rule of law, strong regulatory systems.
Emerging Markets:
More political uncertainty, policy shifts, regulatory inconsistencies. However, some EMs like India are rapidly improving regulatory transparency.
2.6 Demographics
Emerging Markets:
Young, expanding populations — a positive for long-term consumption and labor supply.
Developed Markets:
Ageing populations — leading to higher healthcare spending, slower consumption growth, and labor shortages.
3. Opportunities in Emerging vs Developed Markets
3.1 Investment Opportunities
Emerging Markets
Higher returns due to rapid growth.
Sectors like technology, fintech, manufacturing, renewable energy, and infrastructure show exceptional potential.
Underpenetrated markets allow companies to grow at scale.
Developed Markets
Stable and predictable returns.
Strong corporate governance and reduced risk of fraud or systemic failures.
Advanced industries like AI, biotechnology, cloud computing, clean tech, and high-end manufacturing.
3.2 Consumer Market Potential
EMs have massive, growing middle classes. Consumption is expected to double in many EMs in the next two decades.
DMs have saturated markets, with growth reliant on innovation rather than new customers.
3.3 Capital Flows
Investors often chase high growth in EM equities, debt, and startups.
DMs attract long-term, stable institutional capital due to reliability of returns.
4. Risks in Emerging vs Developed Markets
4.1 Market Volatility
Higher in EMs, due to currency risks, political events, commodity dependence, and lower liquidity.
DMs show lower volatility thanks to robust financial systems.
4.2 Geopolitical and Policy Risks
EMs often face elections, reforms, or geopolitical pressures that can shift markets abruptly.
DMs are more predictable, although events like Brexit or US political gridlocks still create uncertainty.
4.3 Currency and Inflation Risks
EM currencies can depreciate sharply in global stress periods.
DMs maintain low inflation and strong central bank credibility.
4.4 Structural Challenges
EMs face challenges like corruption, weak judiciary, infrastructure gaps, and bureaucratic hurdles.
DMs deal with challenges like high public debt, low productivity growth, and ageing populations.
5. Comparative Overview
5.1 Growth vs Stability
Emerging markets = growth, opportunity, volatility
Developed markets = stability, safety, lower returns
5.2 Innovation and Technology Adoption
DMs lead in innovation due to research ecosystems.
EMs leapfrog technology — e.g., India’s digital payments boom, China’s e-commerce leadership.
5.3 Trade and Globalization
EMs are increasingly integrated into global supply chains.
DMs dominate global trade policies, IMF, World Bank, and monetary influence (USD, Euro, Yen).
5.4 Corporate Structures
DMs have multinationals with global footprints.
EMs are producing new giants (e.g., Reliance, Tata, Alibaba, BYD, Samsung).
6. Examples
Emerging Markets
India: Fastest-growing major economy, tech innovation, digital transformation.
China: Manufacturing hub, consumption growth.
Brazil: Natural resources, agriculture economy.
Indonesia & Vietnam: Manufacturing and consumption boom.
Developed Markets
USA: World’s largest and most innovative economy.
Japan: High-tech industries, strong institutions.
Germany: Industrial powerhouse.
UK & Canada: Stable financial systems.
7. Which Is Better for Investors?
Emerging Markets Are Ideal If You Want:
High long-term growth potential
Exposure to rising consumption
High-return equity opportunities
Portfolio diversification
Developed Markets Are Ideal If You Want:
Safety and predictability
Lower volatility
Strong governance
Blue-chip stability
Best Strategy:
A balanced portfolio that mixes both — e.g., EM for growth + DM for stability — provides optimal long-term results.
8. Conclusion
Emerging and developed markets represent two ends of the global economic spectrum. Emerging markets offer high growth, rising consumer demand, innovation, and long-term opportunities, but with higher risks and volatility. Developed markets deliver stability, security, and robust institutions, though with slower growth.
Understanding the differences helps investors, businesses, and policymakers choose the right strategies. In today’s interconnected world, both market types are essential components of global economic progress. A combination of the dynamism of emerging markets and the reliability of developed markets provides a balanced and powerful approach to global investment and economic engagement.
Domestic Market vs Global Market1. Meaning of Domestic Market
The domestic market, also known as the internal market or home market, refers to the economic environment within a specific country. All transactions—production, distribution, marketing, buying, and selling—take place inside national borders. Participants operate under the country’s laws, currency, taxation, and business culture.
Key Characteristics of Domestic Markets
** Single Currency:** All trade happens in the nation’s currency (e.g., INR for India).
** Local Regulation:** Businesses follow national laws, taxation, and safety standards.
** Known Consumer Preferences:** Companies understand local culture, tastes, and purchasing power.
** Lower Risk:** No foreign exchange fluctuation, geopolitical uncertainty, or cross-border compliance.
** Easier Market Entry:** Setting up operations, distribution, and marketing is simpler compared to international expansion.
Advantages of Domestic Markets
Lower cost of operations.
Predictable demand patterns.
Better regulatory familiarity.
Local brand loyalty.
Smaller logistical and transportation challenges.
Limitations
Limited customer base.
Growth potential capped by domestic economic conditions.
High competition if the market is saturated.
Vulnerable to local inflation, interest rate changes, and policy shifts.
2. Meaning of Global Market
The global market (or international market) refers to buying and selling across multiple countries worldwide. Companies sell products, raise capital, and source raw materials internationally. Global markets connect nations, businesses, and consumers across borders through trade, investment, and technology.
Key Characteristics of Global Markets
Multiple Currencies: Trade involves forex markets (USD, EUR, JPY, etc.).
Global Consumer Base: Millions of potential customers worldwide.
Complex Regulations: Different countries have different laws on product standards, taxes, and business operations.
Increased Competition: Competing with international brands and multinational corporations.
High Growth Opportunity: Access to huge markets, new segments, and diverse demand.
Advantages of Global Markets
Unlimited expansion potential.
Higher profit margins due to scale.
Ability to diversify business risk across countries.
Access to cheaper raw materials and skilled labour.
Enhanced brand value and global recognition.
Limitations
Complex logistics and supply chain challenges.
Exposure to currency fluctuations.
Geopolitical risks (wars, sanctions, trade barriers).
Cultural and language barriers.
High cost of marketing, compliance, and international operations.
3. Key Differences: Domestic vs Global Market
1. Scale of Operation
Domestic: Operates within one country.
Global: Operates across several countries or continents.
2. Consumer Base
Domestic: Limited to local population.
Global: Millions of global customers with different needs and purchasing behaviours.
3. Currency
Domestic: One currency.
Global: Multiple currencies and exposure to forex volatility.
4. Competition
Domestic: Compete with local businesses.
Global: Compete with global giants such as Apple, Tesla, Samsung, etc.
5. Regulation
Domestic: One set of national laws.
Global: Must comply with customs, trade agreements, tariffs, and legal systems of many countries.
6. Risks
Domestic: Political instability, inflation, taxation.
Global: Geopolitics, supply chain disruptions, currency risk, global recessions.
7. Logistics
Domestic: Simple networks within the country.
Global: Shipping, customs clearance, warehousing, and international transport.
8. Marketing Strategy
Domestic: Fixed strategy based on local culture.
Global: Localization required—adapt product names, pricing, packaging, promotions, and language.
4. Why Companies Expand from Domestic to Global Markets
Businesses often start in domestic markets to build a stable foundation. Once they achieve brand recognition and financial strength, they expand into global markets for:
1. Growth and Scalability
The domestic market may become saturated. Going global allows businesses to tap into new customer segments.
2. Diversification
Expanding globally helps protect companies from domestic economic downturns.
3. Cost Efficiency
Countries like India, Vietnam, and Bangladesh offer affordable labour and production costs, reducing overall expenses.
4. Competitive Advantage
Companies that operate globally often achieve technological, financial, and operational superiority.
5. Resource Access
Global markets provide access to:
Rare minerals
High-end technology
Skilled talent
Advanced manufacturing hubs
5. Impact on Investors: Domestic vs Global Markets
Investors also benefit differently from domestic and global markets.
Domestic Investing
Less complex.
Lower risk.
Better understanding of companies and regulations.
Global Investing
Exposure to fast-growing economies.
Diversification across countries.
Opportunities to invest in global companies like Apple, Google, or Amazon.
However, global investing involves:
Currency risk
Higher brokerage costs
Taxation complexity
6. Impact on the Economy
Domestic Market’s Role
Creates employment.
Strengthens local industries.
Helps the government generate tax revenue.
Global Market’s Role
Boosts exports.
Improves foreign exchange reserves.
Promotes technological advancement through global competition.
Encourages multinational companies (MNCs) to invest locally.
A strong global presence can elevate a country’s economic status.
7. Examples for Better Understanding
Domestic Market Examples
Patanjali selling products primarily within India.
Local Kirana stores and regional brands.
India-focused stock exchanges like NSE and BSE (though they attract global money indirectly).
Global Market Examples
Apple selling products worldwide.
Tata Motors operating in 100+ countries.
Amazon’s global e-commerce network.
Reliance exporting petrochemicals to several continents.
These comparisons show how companies leverage both markets depending on their goals.
8. Conclusion
The domestic market forms the foundation of any business, offering stability, low risk, and predictable demand. It is ideal for startups and companies building brand loyalty. On the other hand, the global market presents massive opportunities for scale, profit, innovation, and diversification—but requires deep resources, compliance capability, and adaptability.
In today’s interconnected world, businesses and investors increasingly balance both domestic and global markets. Companies begin locally, refine operations, and gradually expand internationally. Investors diversify across borders to reduce risk and capture global growth.
Understanding the distinctions between these two markets helps businesses design better strategies, investors make smarter decisions, and policymakers create more balanced, growth-focused economic policies.
