APPLE: Bearish Continuation
Our strategy, polished by years of trial and error has helped us identify what seems to be a great trading opportunity and we are here to share it with you as the time is ripe for us to sell APPLE.
Disclosure: I am part of Trade Nation's Influencer program and receive a monthly fee for using their TradingView charts in my analysis.
❤️ Please, support our work with like & comment! ❤️
AAPL

Stock Market Forecast | TSLA NVDA AAPL AMZN META MSFTStock Market Forecast | NASDAQ:QQQ AMEX:SPY
Mag 7 Forecast | NASDAQ:TSLA NASDAQ:NVDA AAPL AMZN META MSFT GOOGL

$QQQ $508 Rug Pull ? All in on REDSo… attaching the bar pattern from Spring 2022, I see the next decline by the middle of next week. I’ll be placing my bets at today’s close if possible . 🫡 Target is $480 by next Friday. Short $508 into next week.

AAPLAAPL price is in the correction period. If the price cannot break through the 258.56 level, it is expected that the price will drop. Consider selling the red zone.
🔥Trading futures, forex, CFDs and stocks carries a risk of loss.
Please consider carefully whether such trading is suitable for you.
>>GooD Luck 😊
❤️ Like and subscribe to never miss a new idea!

Stock Market Forecast | TSLA NVDA AAPL AMZN META GOOGL MSFTStock Market Forecast | QQQ, SPY, AMEX:XLV , AMEX:XLF
Mag 7 Forecast | NASDAQ:TSLA NASDAQ:NVDA AAPL AMZN META GOOGL MSFT

APPLE Buyers In Panic! SELL!
My dear followers,
This is my opinion on the APPLE next move:
The asset is approaching an important pivot point 245.60
Bias - Bearish
Safe Stop Loss - 251.37
Technical Indicators: Supper Trend generates a clear short signal while Pivot Point HL is currently determining the overall Bearish trend of the market.
Goal - 235.33
About Used Indicators:
For more efficient signals, super-trend is used in combination with other indicators like Pivot Points.
———————————
WISH YOU ALL LUCK

$QQQ Dead Cat to 10 WMA, then lower. Buy $496, Sell $514 What I see here is a double top on the weekly just like 2022. I can see our last 9 count in 2022 produced a 30% rally to the top. After the rally several months of sideways movement until we break trend. If we are Indeed Repeating the 2022 TOP. Then we have a harsh year ahead of us. As I said in previous posts, we should close February at the low of January. I have KRE falling out next week so I'm skeptical about what's going on. We've got DOGE checks and what not, who knows. I'm extremely bearish and I do believe we will bounce into a rejection this next week, then fall even further the week of 3/14. I will update day by day. For now, $496 will be my Buy. and $514 will be the Sell. Take Care Yall.

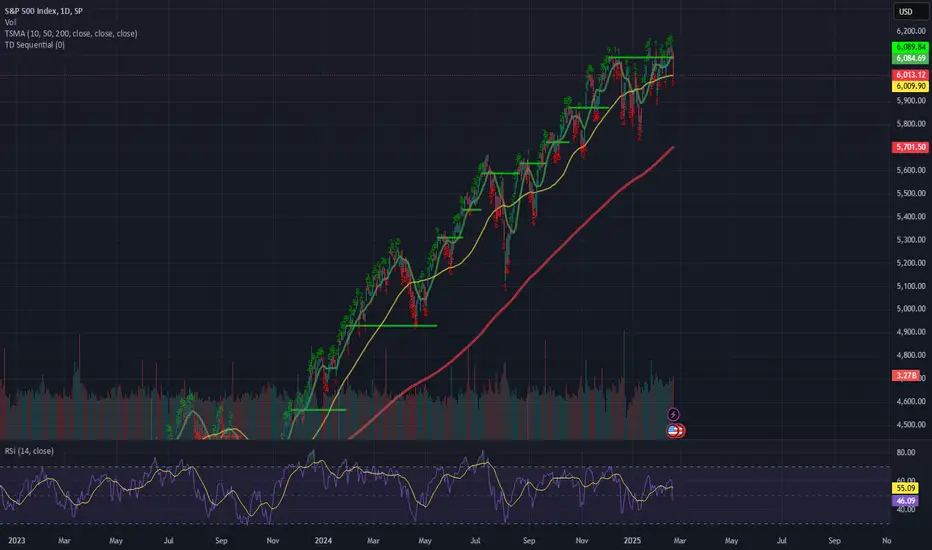
$SPY $SPX Pullback to Gap Fill? I've been waiting for a rocket to AMEX:SPY $630 but my monthly tells me that February wants to close red. Here is my daily with a fib that we cant seem to hold above although today we did close above once I have been waiting patiently in this box unlike others, I have constantly reiterated, don't try to be a hero inside of the box. Now that the Box seems to be pushing towards the upside, I can't help but notice we continue printing bearish candles regardless of direction. Today we closed with a Hangman, which begs the question, could we perhaps lean bearish for two of the most bearish weeks of the year in comparison? I'd like to think I'm not wrong here and we will get a spill before anyone gets an expected blow off top. Be careful out there, volatility remains present and the VIX was above the 50DMA last time I checked. If we can get this gap fill and start moving back up, I will be confident in the gap fill being bottom. Seeing as $593 AMEX:SPY alert for bottom never filled, I will have to assume it's still a possibility. Taz out.

$PLTR 4h RSI, Vol. Bearish Divergence4H chart showing divergence and may not necessarily be a top but could be pulling back for a test of support. Watch 10DMA for potential support.

$META CRASH in PROGRESS !! $600 incomingWowzers... I'm not sure what to say but ... good money is going to be made here for sure... would love to see this play out to the Tee... Take care yall ... DAILY BAR PATTERN from the Box of June 24' - Aug 24' .... I must say... let's make it happen..

394% Biggest gainer of the day $ONVOPerfect dip buy with minimum risk before the pop back to highs for easy money 🎯
All that while the rest of the market ends the day in deep red
+17.0% realized profit on the day while NASDAQ:TSLA NASDAQ:AAPL NASDAQ:NVDA NASDAQ:PLTR and the rest of the market all 🔻

Apple: Top and DropAs part of Apple's ongoing wave (2) correction, we assume that the subordinate turquoise wave X still needs to conclude in the short term before the price can drop into our magenta Target Zone between $209.57 and $196.05. There, we anticipate a bullish reversal, which should offer trading opportunities for the long side and mark the starting point for the next major upward move. Alternatively, there is a 37% chance that the low of wave alt.(2) has already been reached, which will be confirmed if the price surpasses $260.10.

AAPLAAPL price is in a correction phase. Now the price is near the resistance zone. If the price cannot break through 259, it is expected that the price will drop. Consider selling the red zone.
🔥Trading futures, forex, CFDs and stocks carries a risk of loss.
Please consider carefully whether such trading is suitable for you.
>>GooD Luck 😊
❤️ Like and subscribe to never miss a new idea!

10D Chart shows Falling 3 , Pullback to 3/18!! $SPYAMEX:SPY shows 10D trend very clear. It is my hidden gem. We, by my charting, Should pullback until 3/18 ... not sure how far but I have plenty of targets on the way down to my ultimate target at 5200... I think we could flush to $560.. Good Luck yall. Gems I tell ya... sorry I'm so bad at explaining things..

$SPY $SPX OLD CHART BAR PATTERN COVID CRASH NOW!!!!Holy crap.... I just came across an old chart and literally in the nick of timeI tell you. All I'm going to say is... I'm a pattern chart trader and this is the COVID bar pattern attached to our daily from like a year ago almost and I loaded up an old layout to do work and boom... here we are... Good LUCK ... Not sure what the trigger will be but we are here.

$SPY $SPX OLD CHART BAR PATTERN COVID CRASH NOW!!!!Holy crap.... I just came across an old chart and literally in the nick of timeI tell you. All I'm going to say is... I'm a pattern chart trader and this is the COVID bar pattern attached to our daily from like a year ago almost and I loaded up an old layout to do work and boom... here we are... Good LUCK ... Not sure what the trigger will be but we are here.
AAPL Price Analysis: Targeting $270 by December 2024Hello Traders,
I'm sharing my latest analysis on AAPL, currently trading at $226.5. Previously, on August 23, 2023, I predicted that AAPL would hit its first target of $220 and its second target of $250. As you can see in the attached chart, AAPL has been making significant progress.
On the weekly chart, a flag pattern has emerged in the middle of the chart. I’ve drawn a parallel channel surrounding this flag pattern and aligned the channel’s upper and lower lines with the Fibonacci levels of 38% and 61.8%. By projecting these lines to the 100% level, I’ve identified a target price of $270, a key level based on important angular calculations.
Target 🎯: $270
When? Based on the time it took for AAPL to move from the 0% level at $55 to the 50% level at $165, which was 86 weeks or 602 days, I anticipate a similar timeframe for the move from the 50% level to the 100% level (yellow circles on chart). This places the expected date to reach $270 around December 23, 2024.
NASDAQ:AAPL

Stock Market Analysis | TSLA NVDA AAPL AMZN META GOOGL MSFTStock Market Forecast | NASDAQ:QQQ AMEX:SPY SEED_ALEXDRAYM_SHORTINTEREST2:NQ NYSE:ES
Mag 7 Forecast | NASDAQ:TSLA NASDAQ:NVDA NASDAQ:AAPL NASDAQ:AMZN NASDAQ:META NASDAQ:GOOGL NASDAQ:MSFT

APPLE: Bearish Continuation & Short Signal
APPLE
- Classic bearish formation
- Our team expects fall
SUGGESTED TRADE:
Swing Trade
Sell APPLE
Entry Level - 245.60
Sl - 251.83
Tp - 233.21
Our Risk - 1%
Start protection of your profits from lower levels
❤️ Please, support our work with like & comment! ❤️

Apple Inc. (AAPL) Forming a Potential W-Pattern – A Bullish SignApple Inc. (AAPL) Forming a Potential W-Pattern – A Bullish Signal
Apple Inc. (AAPL) appears to be shaping a significant W-pattern, a well-known technical formation often associated with bullish momentum. From a psychological standpoint, this pattern suggests a potential buying opportunity.
Should fundamental factors align with this technical setup, I anticipate a strong upward move, targeting my 3 TP levels at $245, $250, and $260.
To maximize profitability and maintain a disciplined approach, traders should consider managing risk effectively.
Holding positions for optimal gains becomes easier when avoiding excessive leverage—or better yet, trading with no leverage at all.
Trade with caution.
Always align technical insights with fundamental analysis before making investment decisions.

New highs area +$1,000/share unlocked for NasdaqSeems like 2 months of sideways downtrending (since mid December) is over for Nasdaq.
Unless any surprise political shock news come out (we all know that can be a challenge with Trump) we could see Nasdaq reach $23,000 per share area in drawn upcoming green period.
This would also reflect directly on upward momentum for several bluechip stocks:
Apple Inc. NASDAQ:AAPL
Microsoft Corporation NASDAQ:MSFT
Amazon.com Inc. NASDAQ:AMZN
Alphabet Inc. NASDAQ:GOOGL
Meta Platforms Inc. NASDAQ:META
NVIDIA Corporation NASDAQ:NVDA
Tesla Inc. NASDAQ:TSLA
Intel Corporation NASDAQ:INTC

APPLE Trading Opportunity! SELL!
My dear subscribers,
This is my opinion on the APPLE next move:
The instrument tests an important psychological level 244.56
Bias - Bearish
Technical Indicators: Supper Trend gives a precise Bearish signal, while Pivot Point HL predicts price changes and potential reversals in the market.
Target - 234.19
My Stop Loss - 250.52
About Used Indicators:
On the subsequent day, trading above the pivot point is thought to indicate ongoing bullish sentiment, while trading below the pivot point indicates bearish sentiment.
———————————
WISH YOU ALL LUCK

Stock Market Forecast | TSLA NVDA AAPL AMZN META GOOGL MSFTStock Market Analysis | SPY QQQ, NQ ES
Mag 7 Analysis | TSLA NVDA AAPL AMZN META GOOGL MSFT
