AAVE: Channel DownTrade setup : Price is in a downtrend, trading in a Channel Down pattern. We wait for a breakout, ideally above $100 resistance and 200-day moving average, to signal bullish trend reversal.
Pattern : Price is trading in a Channel Down pattern. With emerging patterns, traders who believe the price is likely to remain within its channel can initiate trades when the price fluctuates within its channel trendlines. With complete patterns (i.e. a breakout) – initiate a trade when the price breaks through the channel’s trendlines, either on the upper or lower side. When this happens, the price can move rapidly in the direction of that breakout. Learn to trade chart patterns in Lesson 8.
Trend : Downtrend across all time horizons (Short- Medium- and Long-Term).
Momentum is Mixed as MACD Line is above MACD Signal Line (Bullish) but RSI ~ 50 (Neutral).
Support and Resistance : Nearest Support Zone is $80, then $60. The nearest Resistance Zone is $105 (previous support), then $130 and $150.
Aave

📈 AAVE Trade Analysis 🔄💼Trade Overview:
AAVE seems to have established a range low after filling the Fair Value Gap (FVG) and forming a triple bottom pattern, suggesting a potential bullish reversal. Monitoring for a final sweep to fill 50% of the wick or a Market Structure Shift (MSS) can help confirm the trade setup.
Trade Strategy:
Entry: Consider entering a trade between $75 to $85, capitalizing on the range low and potential reversal pattern.
Take Profit: Set take profit targets around $120 and $160, aiming for gains within these levels.
Stop Loss: Place the stop loss at a daily close below $70 to manage risk effectively.
📊🔍 Stay attentive to AAVE's price action for trade validation and adjustments! #AAVETrading #CryptoAnalysis 🌐🔒

AAVE: Approaching SupportTrade setup : Trends are mixed to down. After a bearish breakout from a Channel Up pattern, price broke below 200-day moving average, which is a sign of downtrend. Trend Traders: It bounced off of $80 support and could approach $100 but it’s a higher risk trade setup since overall trend is down. Price needs to break back above 200-day MA (~$100) to resume its uptrend.
Trend : Downtrend across all time horizons (Short- Medium- and Long-Term).
Momentum is Mixed as MACD Line is above MACD Signal Line (Bullish) but RSI ~ 50 (Neutral).
Support and Resistance : Nearest Support Zone is $80, then $60. The nearest Resistance Zone is $105 (previous support), then $130 and $150.

AAVE: Approaching SupportTrade setup : Trends are mixed to down. After a bearish breakout from a Channel Up pattern, price broke below 200-day moving average, which is a sign of downtrend.
Trend Traders : It’s now sitting at $80 support, which held up a couple of times recently and could be a swing trade entry but it’s a higher risk trade setup since overall trend is down. Price needs to break back above 200-day MA (~$100) to resume its uptrend.
Trend : Downtrend across all time horizons (Short- Medium- and Long-Term).
Momentum is Mixed as MACD Line is above MACD Signal Line (Bullish) but RSI < 45 (Bearish). MACD Histogram bars are declining, which suggests that momentum is weakening.
Support and Resistance : Nearest Support Zone is $80, then $60. The nearest Resistance Zone is $105 (previous support), then $130 and $150.

AAVE: Approaching SupportTrade setup : Trends are mixed to down. After a bearish breakout from a Channel Up pattern, price broke below 200-day moving average, which is a sign of downtrend. Trend Traders: Price needs to break back above 200-day MA (~$100) to resume its uptrend.
Trend : Downtrend on Short- and Medium-Term basis and Neutral on Long-Term basis.
Momentum is Mixed as MACD Line is above MACD Signal Line (Bullish) but RSI < 45 (Bearish).
Support and Resistance : Nearest Support Zone is $80, then $60. The nearest Resistance Zone is $105 (previous support), then $130 and $150.

Aave, a DeFi pillar in a long accumulationAave (AAVE) is a key player in the Decentralized Finance sector, at -86% drawdown, which is back in its long accumulation range. Our Supreme Vision (BSV) tool is also indicating a new accumulation period (green background)!
Moreover, according to the Master Oscillator (BMO), less than 40% of addresses are in profit, with a slight increase in the percentage of supply held by Whales and long-term Holders.

AAVE: Approaching ResistanceTrade setup : Trends are mixed to down. After a bearish breakout from a Channel Up pattern and below 200-day moving average, price bounced up from $80 support and could swing up to $100 again (200-day MA). Trend Traders: Price needs to break back above 200-day MA (~$100) to resume its uptrend.
Trend : Downtrend on Short- and Medium-Term basis and Neutral on Long-Term basis.
Momentum is Mixed as MACD Line is above MACD Signal Line (Bullish) but RSI < 45 (Bearish).
Support and Resistance : Nearest Support Zone is $80, then $60. The nearest Resistance Zone is $105 (previous support), then $130 and $150.

AAVE: Approaching ResistanceTrade setup : Trends are mixed. Price had a bearish breakout from a Channel Up pattern and below 200-day moving average. It got oversold (RSI ~ 30) and bounced off of $80 support. Now it’s approaching a stiff resistance area: 200-day MA (~$100) and $105 horizontal resistance zone.
Swing Traders: if price gets rejected at this resistance area, it could pull back and revisit $80 again.
Trend Traders: Price needs to break back above 200-day MA (~$98) to resume its uptrend.
Trend : Downtrend on Short- and Medium-Term basis and Uptrend on Long-Term basis.
Momentum is Mixed as MACD Line is above MACD Signal Line (Bullish) but RSI < 45 (Bearish).
Support and Resistance : Nearest Support Zone is $80, then $60. The nearest Resistance Zone is $105 (previous support), then $130 and $150.

AAVE: Approaching ResistanceTrade setup : Trends are mixed. Price had a bearish breakout from a Channel Up pattern and below 200-day moving average. It got oversold (RSI ~ 30) and bounced off of $80 support. Now it’s approaching a stiff resistance area: 200-day MA (~$100) and $105 horizontal resistance zone. Swing Traders: if price gets rejected at this resistance area, it could pull back and revisit $80 again. Trend Traders: Price needs to break back above 200-day MA (~$98) to resume its uptrend.
Trend : Downtrend on Short- and Medium-Term basis and Uptrend on Long-Term basis.
Momentum is Bearish but inflecting. MACD Line is below MACD Signal Line and RSI is below 45 but momentum may have bottomed since MACD Histogram bars are rising, which suggests that momentum could be nearing another upswing.
Support and Resistance : Nearest Support Zone is $80, then $60. The nearest Resistance Zone is $105 (previous support), then $130 and $150.

AAVE: Oversold at SupportTrade setup : Trends are mixed. Price had a bearish breakout from a Channel Up pattern and below 200-day moving average.
Swing Traders: Near term, price is oversold (RSI ~ 30) near $80 support, which means that it could bounce up to $98 for a +20% gain.
Trend Traders: Price needs to break back above 200-day MA (~$98) to resume its uptrend.
Pattern : Price was trading in a Channel Up pattern. With complete patterns (i.e. a breakout) – initiate a trade when the price breaks through the channel’s trendlines, either on the upper or lower side. When this happens, the price can move rapidly in the direction of that breakout.
Trend : Downtrend on Short- and Medium-Term basis and Uptrend on Long-Term basis.
Momentum is Bearish but inflecting. MACD Line is below MACD Signal Line and RSI is below 45 but momentum may have bottomed since MACD Histogram bars are rising, which suggests that momentum could be nearing another upswing.
Support and Resistance : Nearest Support Zone is $80, then $60. The nearest Resistance Zone is $105 (previous support), then $130 and $150.

AAVE: Oversold at SupportTrade setup : Trends are mixed. Price had a bearish breakout from a Channel Up pattern and below 200-day moving average.
Swing Traders:Near term, price is oversold (RSI ~ 30) near $80 support, which means that it could bounce up to $98 for a +20% gain.
Trend Traders: Price needs to break back above 200-day MA (~$98) to resume its uptrend.
Pattern : Price was trading in a Channel Up pattern. With complete patterns (i.e. a breakout) – initiate a trade when the price breaks through the channel’s trendlines, either on the upper or lower side. When this happens, the price can move rapidly in the direction of that breakout.
Trend : Downtrend on Short-Term basis, Neutral on Medium-Term basis and Uptrend on Long-Term basis.
Momentum is Bearish (MACD Line is below MACD Signal Line, and RSI is below 45).
Support and Resistance : Nearest Support Zone is $80, then $60. The nearest Resistance Zone is $105 (previous support), then $130 and $150.

#AAVE/USDT#AAVE
The price is moving in an upward channel on a 3-day frame
The price rebound more than once at the lower border of the channel at the price of 50 is evidence of the strength of the channel border and the expectation of a rise
We have a higher stability moving average of 100
Likewise, there is a trend in which the price touched the RSI and rebounded from it
Entry price is 0112
First goal: 132.97
The second goal is 151.92
The third goal is 175.74

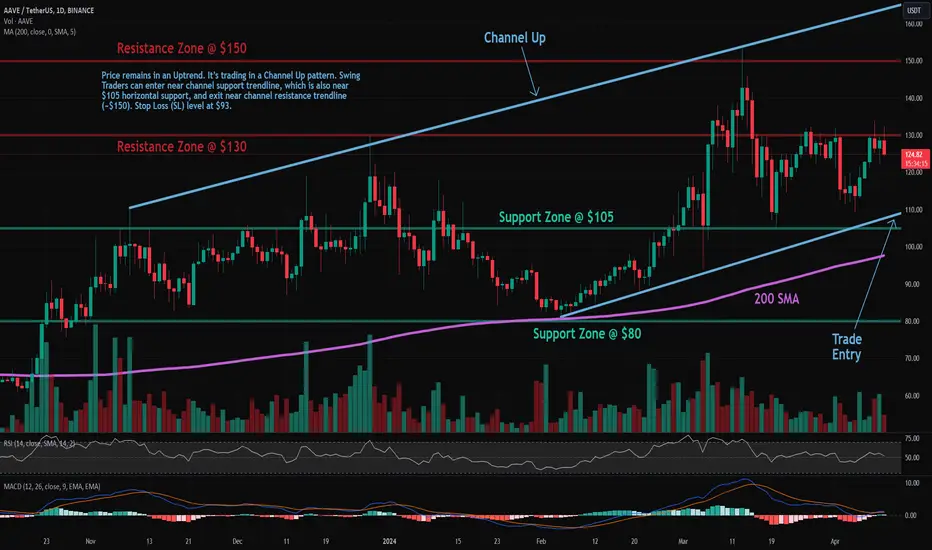
AAVE: Channel Up PatternTrade setup : Price remains in an Uptrend. It’s trading in a Channel Up pattern. Swing Traders can enter near channel support trendline, which is also near $105 horizontal support, and exit near channel resistance trendline (~$150). Stop Loss (SL) level at $93.
Pattern : Price is trading in a Channel Up pattern. With emerging patterns, traders who believe the price is likely to remain within its channel can initiate trades when the price fluctuates within its channel trendlines. With complete patterns (i.e. a breakout) – initiate a trade when the price breaks through the channel’s trendlines, either on the upper or lower side. When this happens, the price can move rapidly in the direction of that breakout.
Trend : Uptrend across all time horizons (Short- Medium- and Long-Term).
Momentum is Mixed as MACD Line is above MACD Signal Line (Bullish) but RSI ~ 50 (Neutral).
Support and Resistance : Nearest Support Zone is $105, then $80. The nearest Resistance Zone is $130, then $150 and $200.

AAVE, the next AVAX? 115% upside potentialAAVE / Weekly
- It's a weekly candle chart
- IF we close above $113 this week, a rebound is very probable
- There is the recent resistance line of $150, but high probability that we smash it through and go at least to $240

AAVE/USDT - Aave: SuperTrend BBand Breakout◳◱ On the $AAVE/ CRYPTOCAP:USDT chart, the Supertrend Bband Breakout pattern suggests a consolidation phase that could precede a trend continuation or reversal. Traders might observe resistance around 133.28 | 143.73 | 166.13 and support near 110.88 | 98.93 | 76.53. Entering trades at 124.43 could be strategic, aiming for the next resistance level.
◰◲ General info :
▣ Name: Aave
▣ Rank: 73
▣ Exchanges: Binance, Kucoin, Bybit, Huobipro, Gateio, Mexc
▣ Category/Sector: Financial - Lending
▣ Overview: Aave is an open-source and non-custodial protocol to earn interest on deposits and borrow assets with a variable or stable interest rate. It also enables ultra-short duration, uncollateralized flash loans designed to be integrated into other products and services.
◰◲ Technical Metrics :
▣ Mrkt Price: 124.43 ₮
▣ 24HVol: 9,142,592.597 ₮
▣ 24H Chng: 2.784%
▣ 7-Days Chng: -3.82%
▣ 1-Month Chng: -5.39%
▣ 3-Months Chng: 29.03%
◲◰ Pivot Points - Levels :
◥ Resistance: 133.28 | 143.73 | 166.13
◢ Support: 110.88 | 98.93 | 76.53
◱◳ Indicators recommendation :
▣ Oscillators: NEUTRAL
▣ Moving Averages: STRONG_BUY
◰◲ Technical Indicators Summary : BUY
◲◰ Sharpe Ratios :
▣ Last 30D: -0.90
▣ Last 90D: 1.47
▣ Last 1-Y: 0.84
▣ Last 3-Y: 0.20
◲◰ Volatility :
▣ Last 30D: 0.94
▣ Last 90D: 0.85
▣ Last 1-Y: 0.77
▣ Last 3-Y: 1.10
◳◰ Market Sentiment Index :
▣ News sentiment score is N/A
▣ Twitter sentiment score is 0.62 - Bullish
▣ Reddit sentiment score is 0.43 - Bearish
▣ In-depth AAVEUSDT technical analysis on Tradingview TA page
▣ What do you think of this analysis? Share your insights and let's discuss in the comments below. Your like, follow and support would be greatly appreciated!
◲ Disclaimer
Please note that the information and publications provided are for informational purposes only and should not be construed as financial, investment, trading, or any other type of advice or recommendation. We encourage you to conduct your own research and consult with a qualified professional before making any financial decisions. The use of the information provided is solely at your own risk.
▣ Welcome to the home of charting big: TradingView
Benefit from a ton of financial analysis features, instruments and data. Have a look around, and if you do choose to go with an upgraded plan, you'll get up to $30.
Discover it here - affiliate link -

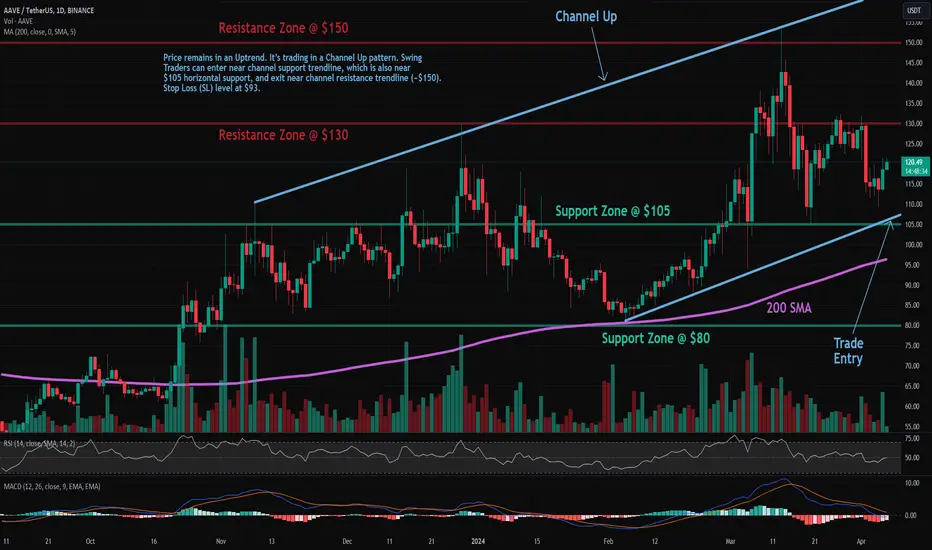
AAVE: Channel Up PatternTrade setup : Price remains in an Uptrend. It’s trading in a Channel Up pattern. Swing Traders can enter near channel support trendline, which is also near $105 horizontal support, and exit near channel resistance trendline (~$150). Stop Loss (SL) level at $93.
Pattern : Price is trading in a Channel Up pattern. With emerging patterns, traders who believe the price is likely to remain within its channel can initiate trades when the price fluctuates within its channel trendlines. With complete patterns (i.e. a breakout) – initiate a trade when the price breaks through the channel’s trendlines, either on the upper or lower side. When this happens, the price can move rapidly in the direction of that breakout.
Trend : Neutral on Short-Term basis and Uptrend on Medium- and Long-Term basis.
Momentum is Mixed as MACD Line is below MACD Signal Line (Bearish) but RSI ~ 50 (Neutral). MACD Histogram bars are rising, which suggests that momentum could be nearing another upswing.
Support and Resistance : Nearest Support Zone is $105, then $80. The nearest Resistance Zone is $130, then $150 and $200.
AAVE: Channel Up PatternTrade setup : Price remains in an Uptrend. It’s trading in a Channel Up pattern. Swing Traders can enter near channel support trendline, which is also near $105 horizontal support, and exit near channel resistance trendline (~$150). Stop Loss (SL) level at $93.
Pattern : Price is trading in a Channel Up pattern. With emerging patterns, traders who believe the price is likely to remain within its channel can initiate trades when the price fluctuates within its channel trendlines. With complete patterns (i.e. a breakout) – initiate a trade when the price breaks through the channel’s trendlines, either on the upper or lower side. When this happens, the price can move rapidly in the direction of that breakout.
Trend : Downtrend on Short-Term basis and Uptrend on Medium- and Long-Term basis.
Momentum is Mixed as MACD Line is below MACD Signal Line (Bearish) but RSI ~ 50 (Neutral).
Support and Resistance : Nearest Support Zone is $105, then $80. The nearest Resistance Zone is $130, then $150 and $200.

AAVE: Channel UpTrade setup : Price remains in an Uptrend. It’s trading in a Channel Up pattern. Near term, if price breaks back above $130, it could revisit $150 for +15% upside potential.
Pattern : Price is trading in a Channel Up pattern. With emerging patterns, traders who believe the price is likely to remain within its channel can initiate trades when the price fluctuates within its channel trendlines. With complete patterns (i.e. a breakout) – initiate a trade when the price breaks through the channel’s trendlines, either on the upper or lower side. When this happens, the price can move rapidly in the direction of that breakout.
Trend : Uptrend across all time horizons (Short- Medium- and Long-Term).
Momentum is Mixed as MACD Line is below MACD Signal Line (Bearish) but RSI > 55 (Bullish). MACD Histogram bars are rising, which suggests that momentum could be nearing another upswing.
Support and Resistance : Nearest Support Zone is $105, then $80. The nearest Resistance Zone is $130, then $150 and $200.

Aave (AAVEUSD): Setting Sights on Long-Term GrowthAave (AAVEUSD): BINANCE:AAVEUSD
Aave is considered a very interesting cryptocurrency for us, both fundamentally and technically. We have concluded the overarching Wave II at $45.28. Since then, there has been a sideways movement, but it's essential to note that we are in the overarching Wave III. The minimum target for this Wave III is currently an 871% increase, which is a tremendous surge and is considered realistic over a very long-term scenario. This won't happen today, tomorrow, or even in the next few months, but it remains a highly interesting coin for the long term.
Currently, we are subordinately finishing up a Wave (1) and are in the process of completing Waves 3. Zooming in further, we are in the midst of completing the encircled Wave ((iii)). This should reach between 61.8% and 100%, equivalent to $132 and $163. After this, we should see a pullback for Wave ((iv)) before completing the overarching Wave 3. We will be looking for an entry for this Wave ((iv)).

AAVEUSDT - Bouncing back from the support#AAVEUSDT (4H Chart) Technical Analysis Update
AAVE is bouncing back from the support.
As you can see in the chart, this is the 4th time its bouncing back from support and every time it bounced back from the support it made significant gain.
AAVE/USDT currently trading at $85.24
Entry Level :$ 85-84
Stop Loss: Below $82.52
Resistance level 1(Target) : $87.48
Resistance Level 2(Target): $91.9
Resistance Level 3(Target): $95
Resistance Level 4(Target): $99.65
Risk Reward Ratio : 1:5.2
Max Leverage: 5X
ALWAYS KEEP STOP LOSS...
Please Follow us, Like, Share and Comment your thoughts

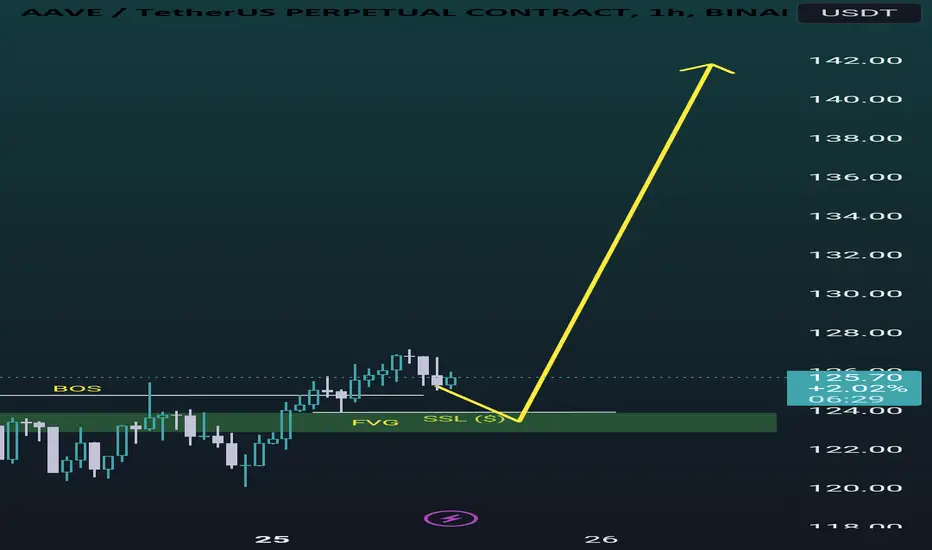
Aave bullish structure continue AAVE/USDT 1H Chart.
A clear break of structure (BOS) happened which has left a fair value gap.
This FVG is our Poi to Enter the Trade.
Do your analysis.
AAVE IS VERY BULLISHFrom the place we inserted "start" on the chart, it looks like a diametric has started.
Wave D seems to be a diametric, and only wave g is left of this diametric. In the coming days, with the completion of wave g from D, the bullish wave E is expected to start.
By maintaining this range, it is expected to move towards TPs.
Closing a daily candle below the invalidation level will violate the analysis.
For risk management, please don't forget stop loss and capital management
When we reach the first target, save some profit and then change the stop to entry
Comment if you have any questions
Thank You
