#ALGO/USDT - this will go Short#ALGO
The price is moving in a descending channel on the 1-hour timeframe. It has reached the upper limit and is heading towards breaking downwards, with a retest of the upper limit expected.
We have an upward trend on the RSI indicator, which has reached near the upper limit, and a downward reversal is expected.
There is a major resistance zone in green at 0.1440. The price has bounced from this zone multiple times and is expected to bounce again.
We have a trend of consolidation above the 100-period moving average, as we are moving close to it, which supports a downward move towards touching it.
Entry price: 0.1343
First target: 0.1316
Second target: 0.1287
Third target: 0.1250
Stop loss: Above the resistance zone in green.
Don't forget a simple thing: money management.
For inquiries, please leave a comment.
Thank you.
Algotrading

#ALGO/USDT - this will go up#ALGO
The price is moving in a descending channel on the 1-hour timeframe. It has reached the lower boundary and is heading towards breaking above it, with a retest of the upper boundary expected.
We have a downtrend on the RSI indicator, which has reached near the lower boundary, and an upward rebound is expected.
There is a key support zone in green at 0.1125. The price has bounced from this zone multiple times and is expected to bounce again.
We have a trend towards consolidation above the 100-period moving average, as we are moving close to it, which supports the upward movement.
Entry price: 0.1137
First target: 0.1150
Second target: 0.1172
Third target: 0.1197
Stop loss: Below the support zone in green.
Don't forget a simple thing: capital management.
For inquiries, please leave a comment.
Thank you.

The Beginner's Blueprint to Custom Trading Indicators
Your First AI‑Assisted Indicator Doesn't Need to Be Perfect - It Just Needs to Be Yours
In the AI era, you don't have to be "a coder" to build tools that actually match how you see the market.
You just need:
A clear idea
Basic Pine Script concepts
AI to help with the heavy lifting, while you fine tune/debug it.
This post is about turning that first idea into a real indicator on your chart.
---
Step 1: Start With One Sharp Idea, Not Ten Vague Ones
Instead of:
"I want an indicator that tells me when to buy and sell."
try:
"I want a trend filter that only shows long signals when price is above a 200‑MA and volatility is not extreme."
The sharper your idea, the easier it is for both you and AI to build something useful.
---
Step 2: Break the Idea Into Building Blocks
Most indicators combine a few simple components:
Trend (moving averages, higher highs/lows)
Momentum (RSI, rate of change)
Volatility (ATR, bands)
Volume (OBV, volume filters)
Your job is to decide:
Which components matter for your idea
How they should interact (AND, OR, weights)
Then you can tell AI exactly what to code instead of saying "make me something cool".
---
Step 3: Talk to AI Like a Developer, Not a Customer
When you ask AI for Pine code, be specific:
"Overlay indicator on price chart"
"Inputs for fastMA, slowMA, ATR length, ATR multiplier"
"Plot trend filter as a colored background"
"Create longCondition and shortCondition booleans"
You can even sketch the structure:
indicator("My Trend Filter", overlay = true)
// 1. Inputs
// 2. Calculations
// 3. Conditions
// 4. Plots
AI will happily fill in the gaps.
---
Step 4: Understand Before You Trust
AI can write the code, but you are still responsible for:
Reading each block and asking, "What does this do?"
Checking signals on different timeframes and markets
Confirming the indicator behaves like your original idea
Think of AI as an ultra‑fast junior dev. You’re still the lead.

Short term scalping Xau usd HURRY!Short term Xau Usd opportunity to seize
Can be free fall Very soon to our targets.

Regime Detection: The AI Trader's Secret Weapon
Your Strategy Didn’t "Stop Working" - The Market Regime Changed
Every trader knows the feeling:
Same signals
Same rules
Suddenly, completely different results
Most people call this "my edge stopped working".
Often, the truth is simpler: the regime changed, but your strategy didn’t.
---
What We Really Mean by "Regimes"
Regimes are just labels for how the market is behaving:
Trending vs ranging
High volatility vs low volatility
Risk‑on vs risk‑off
AI and systematic tools see this in the data:
ATR, realized volatility, and correlation spikes
Trend strength from measures like ADX
Clustered patterns in returns and volume
You feel it as:
"Breakouts keep failing now"
"Mean‑reversion is getting steamrolled"
"Options premium isn't decaying like it used to"
Same observation, different language.
---
Why Regime Awareness Is Mandatory in the AI Era
When you use AI or algo systems, you're often:
Running the same rules from last month
On today's data
If the rules were built in one regime and deployed in another, results will diverge.
AI can help by:
Classifying days/weeks into regime buckets
Tracking how each strategy performs in each bucket
Alerting you when the regime label flips
But you still have to decide how your playbook changes when the label changes.
---
A Simple Regime → Strategy Mapping
You don’t need complex ML to get started. Even a basic map helps:
Trending + Normal Vol → Trend‑following systems sized normally
Trending + High Vol → Same systems, reduced size, wider risk buffers
Ranging + Low Vol → Mean‑reversion and carry trades
Choppy + High Vol → Trade less, focus on defense, maybe only scalp
AI can refine the labels; your job is to define what each label means for you

AI Trading Fundamentals: The Trinity of Success
Most Traders Obsess Over Strategy - and Ignore the Two Things That Actually Save Them
In the AI trading era, it's easy to get lost in models, indicators, and signal quality.
But beneath every durable trading approach — manual or automated — there are only three pillars:
Edge – a real, testable reason your trades make money over time
Risk – how much you lose when you're wrong
Execution – how consistently you follow the plan
Remove any one, and the entire structure collapses.
Pillar 1: EDGE – Why This Should Work at All
In a world of AI‑generated strategies and infinite backtests, edge has to mean more than "the curve looks nice".
Ask your system:
What market behavior is this exploiting?
Why should that behavior continue ?
What market conditions break this logic?
If your only explanation is "the bot backtested well", you don't have an edge. You have a story.
Pillar 2: RISK – How You Survive Your Own Edge
Even a strong edge comes with:
Losing trades
Losing streaks
Drawdowns that feel worse live than on paper
In the AI era, risk decisions include:
Position sizing rules for each strategy
Portfolio‑level exposure caps across multiple bots/systems
Maximum drawdown and daily loss limits that auto‑trigger when hit
Edge without risk is just leverage pointed at a wall.
Pillar 3: EXECUTION – Where Most Traders Quietly Lose
Execution is simply: Did you do what your plan said, when it said to do it?
With AI tools, this becomes:
Did you take every valid signal, or did you cherry‑pick?
Did you change parameters mid‑drawdown "to feel safer"?
Did you override bots based on fear or FOMO?
AI is excellent at pure execution. Humans are not. The hack is to let algorithms handle the rules - and keep humans in charge of designing those rules and managing risk.
Putting It Together in the AI Era
When you review your trading or systems, don't just ask "Did I make money?". Ask:
Edge: Do I still understand why this works? Has the market changed?
Risk: Are my size, drawdown limits, and kill switches clear and enforced?
Execution: How often did I actually follow the plan?
For most traders, the weakest pillar isn't edge - it's risk or execution.

Algorithmic Trading vs Manual TradingWhy the Edge Is Shifting And Why 2026 May Be a Turning Point
As this year comes to an end, it’s the perfect moment to slow down, zoom out, and ask an uncomfortable but necessary question:
Are we trading the markets — or are the markets trading us?
Whether you are in your first year of trading or have spent a decade studying charts, there comes a moment of clarity where you ask yourself:
“If I know what to do… why don’t I always do it?”
Beginners ask this after their first emotional mistake.
Experienced traders ask it after their hundredth.
The market does not punish ignorance as harshly as it punishes inconsistency.
Most traders don’t fail because they lack knowledge.
They fail because they are human.
We all know this pattern:
The entry is clear but hesitation creeps in
The stop is defined but gets adjusted “just a little”
The trend is obvious yet profits are taken too early
The system says don’t trade but emotions say this time is different
At the end of the day, trading is not a battle against the market.
It’s a battle against ourselves.
And that’s exactly where algorithmic (systematic) trading enters the game. Not as a shortcut, not as a holy grail, but as an evolution of execution.
Now, with AI evolving rapidly and tools becoming accessible to retail traders, something big is happening:
The same systematic edge institutions used for years is now available to individuals.
That raises a powerful question:
Can a system (without emotion, instinct, or fear) trade better than a human?
After spending the last 6–8 months deeply immersed in algorithmic trading, intense backtesting, rule-building, and system refinement, I came to a conclusion:
Algorithmic trading is not just the future, it’s the logical evolution of trading itself.
And I strongly believe 2026 will be a major turning point.
Let’s break this down properly.
Manual Trading (Human Trading) → The Strengths & The Silent Killers
Manual trading is where almost everyone starts and for good reason.
What humans do exceptionally well
Pattern recognition
Context awareness and regime interpretation
Macro, narrative, and sentiment understanding
Adaptation during abnormal market conditions
For experienced traders, discretion often becomes earned intuition.
But here’s the uncomfortable truth:
The better you get, the more painful your mistakes become.
Why?
Because you know better yet still break your own rules.
Humans are great at ideas.
But trading success doesn’t come from ideas.
It comes from execution → repeated thousands of times.
And this is where humans struggle most.
The Complete List of Human Trading Failures (The Real Reason Most Traders Lose)
Regardless of experience, humans share the same failure modes.
Here’s the part most people avoid talking about.
Emotional failures
Fear when price approaches entry
Greed when price runs in profit
Panic after one losing trade
Overconfidence after a winning streak
Revenge trading to “get it back”
Execution & discipline failures
Moving stop losses too early
Widening stops to avoid realizing a loss
Taking profit early because “it’s green now”
Ignoring your system once emotions kick in
Changing rules mid-trade
Cognitive biases (even in professionals)
Confirmation bias (seeing only what supports your bias)
Recency bias (overweighting the last trade)
Anchoring to entry price
Counter-trading the trend because price “feels extended”
Lifestyle & state-based issues
Trading tired
Trading stressed
Trading distracted
Trading emotionally impacted by life events
The classic question every trader has asked:
“Why did I take profit so early when the trend was obvious?”
Or:
“Why did I counter-trade when the moving averages clearly showed downside momentum?”
These aren’t skill problems.
They are human problems.
The Hard Truth: Trading Is an Execution Game
Markets reward:
Consistency
Repetition
Risk control
Statistical edge
They do not reward:
Creativity during execution
Emotional intelligence in drawdowns
Smart excuses
Execution quality determines outcomes and execution is precisely where humans are weakest.
Algorithmic Trading → What Changes When Rules Take Control
Algorithmic trading removes the weakest link in trading:
The trader.
A system:
Doesn’t feel fear, stress, fatigue, or boredom
Doesn’t reinterpret rules mid-trade
Doesn’t revenge trade
Doesn’t move stops
Doesn’t second-guess
Doesn’t hesitate
It follows rules.
Every single time.
Key advantages of algorithmic trading
Processes multiple data points simultaneously
Executes instantly during fast price action
Trades 24/7 without fatigue
Applies identical risk rules every trade
Can be objectively tested and measured
There is no emotional deviation.
And that alone is a massive edge.
“But Humans Have Instinct” — The Big Myth
Instinct is just pattern recognition shaped by experience.
And patterns can be quantified.
If a trader can explain why they take a trade
that logic can be turned into rules.
And rules can be executed better by machines.
Win Rate Reality — How High Can It Really Go?
When I began researching existing algo traders:
Some had ~60% win rates with solid returns
Some reached 70–80%
That sparked a question I wrote down and circled:
“Is a 90% win rate even possible?”
So I tested.
Started with swing trading systems
Moved to intraday
Then scalping
Simplified rules instead of complexity
Tested only what truly mattered
After months of backtesting and refinement:
Achieving high-precision win rates of 80–90% across various asset classes, with drawdowns kept to an absolute minimum.
It proved something deeper:
Precision trading is possible when emotion is removed.
Important Reality Check (Especially for Experienced Traders)
High win rate does not automatically mean profitability.
What truly matters:
Risk-to-reward
Drawdowns
Expectancy
Consistency
Longevity over multiple market regimes
A system must survive:
Trending markets
Ranging markets
High volatility
Low volatility
Durability beats elegance.
Always.
The Real Future of Trading (2025–2030)
Here’s how I see it:
More traders will become system builders, not button clickers
Manual trading will shift toward monitoring & strategy design
AI will assist in:
Data filtering
Pattern discovery
Optimization
Hybrid approaches will dominate:
Machines execute
Humans supervise
Manual trading won’t disappear
but manual execution will.
My Personal Conclusion
Manual trading becomes validation
Algorithmic trading becomes execution
Humans decide what to trade
Systems decide how to trade
That’s evolution.
Final Thoughts — End of Year Message 🎄
As the year comes to an end, take time to reflect:
What worked
What didn’t
Where emotions interfered
Where rules could replace decisions
Trading is a long-term game.
The goal isn’t to trade more
it’s to trade better.
Merry Christmas to everyone!
May the next year bring clarity, discipline and growth — both in trading and in life.
The edge is shifting.
And those who adapt early will lead.
Would love to hear your thoughts:
Are you trading fully manual?
Hybrid approach?
Or already building systems?
_________________________________
💬 If you found this helpful, drop a like and comment!

Your Trading Algorithm's Report Card: The Year-End Review
Forget New Year’s Resolutions — Give Your Trading a Real Audit
At the end of the year, most traders do one of two things:
Celebrate if they made money
Blame the market if they didn't
Neither of those changes anything.
In the AI era — where your tools can track every trade, every decision, every bot run — there's no excuse not to sit down once a year and ask: "What actually happened here?"
Why a Year‑End Audit Matters More With AI
When you're using AI tools or bots, you aren't just grading yourself. You're grading:
Your systems (manual or automated)
Your risk framework
Your behavior around those systems
Without an audit, it's easy to:
Blame the bot for what was actually poor risk management
Assume an edge that only worked in one regime
Miss the fact that overrides did more harm than good
Four Lenses for Your Year‑End Review
Performance – cold, hard numbers
Total return vs a simple benchmark ( AMEX:SPY , $CRYPTO:BTC, etc.).
Maximum drawdown — did it match what you thought you could handle?
Expectancy per trade and per system.
Process – did you do what you said you would?
How often did you follow your rules exactly?
How often did you override AI or system signals?
Did you journal or track reasons for trades?
Strategy – did your ideas actually have edge?
Which strategies carried the year?
Which consistently bled capital?
Did you unknowingly just ride a bull market?
Behavior – how you handled stress, FOMO, and drawdowns
Did you stick to size limits during losing streaks?
Did you revenge trade after losses?
Did you turn bots off or on based on feelings instead of rules?
Turning Reflection Into an Actual Plan
After the audit, write down three lists:
STOP – behaviors, markets, or strategies that clearly don't work for you.
START – habits you know would have helped (journaling, monthly reviews, better risk checks).
KEEP – strengths you want to double down on.
Then convert them into specific goals:
"Reduce discretionary overrides to <5% of total trades"
"Run walk‑forward tests on any new AI strategy before going live"
"Review performance on the first weekend of every month"
In the End, Data > Stories
The point of a year‑end audit isn't to beat yourself up.
It's to replace:
"I think I did okay this year"
with:
"My systems returned X%, max drawdown was Y%, my biggest leak was Z, and here’s exactly what I’m changing."
In a world where AI can track every detail of your trading, the traders who win are the ones willing to look at those details honestly.

Backtesting AI Strategies: The Complete Framework
Your Backtest Showing 1,000% Returns Is Probably Lying to You
In the age of AI tools and instant backtests, it's never been easier to generate beautiful equity curves.
It's also never been easier to fool yourself.
Backtesting isn't about proving your genius. It's about trying as hard as possible to break your idea before the market does.
What Backtesting Is Really For
Backtesting should answer boring, critical questions:
Does this logic have any edge beyond randomness?
How ugly do the drawdowns get when things go wrong?
Does it survive different market regimes, or only one lucky period?
What happens after costs, slippage, and realistic execution?
In the AI era, you can run thousands of tests in minutes. That doesn't mean you should trust the first curve that looks good.
The Classic Sins (Supercharged by AI)
AI makes it easy to commit every backtesting error faster:
Overfitting – Adding parameters and filters until the past looks perfect.
Look‑ahead bias – Accidentally using data that wouldn't have been known at the time.
Ignoring costs – Forgetting that spreads, fees, and slippage eat high‑frequency edges alive.
Data snooping – Testing hundreds of variants and only remembering the winners.
Each mistake quietly turns your "edge" into noise dressed up as science.
A Clean, Honest Testing Framework
You don't need a PhD. You need structure.
Write the Hypothesis First
"I think momentum in high‑volume stocks persists for 5–20 days."
Document the why before you see the results.
Split Your Data
Training: where you rough in the idea.
Validation: where you tune it.
Test: a final, untouched slice you only use once.
Compare Against Baselines
Buy‑and‑hold.
Random entries with similar risk rules.
Walk Forward
Train on past → test on the next chunk → roll forward.
Mimic how you'd actually update the system in real time.
Stress It
High vol vs low vol.
Trends, ranges, crashes.
Key Metrics That Actually Matter
Skip the exotic stats. Focus on:
Max Drawdown – Can you survive it psychologically and financially?
Expectancy – Average profit per trade after costs.
Profit Factor – Gross profits / gross losses.
Win Rate + Win/Loss Size – How often you win, and how big wins vs losses are.
Monthly Consistency – How many months are red vs green.
These tell you if the system is tradable, not just impressive.
AI's Role: Helper, Not Judge
AI can:
Generate variations you wouldn't think of
Run large test grids quickly
Estimate parameter sensitivity
But you still have to:
Define what "good" looks like
Reject fragile, curve‑fit solutions
Decide when a system has truly failed and needs to be retired
In other words, AI gives you the lab. You still have to be the scientist.

Neural Networks in Trading: Separating Hype from Reality
"99% Accurate AI" Sounds Great — Until You See the Equity Curve
If you've been around markets lately, you've seen the pitch:
Our revolutionary AI uses deep neural networks to predict the market with 99% accuracy.
In the era of big models and buzzwords, it's easy to get hypnotized by charts that go straight up. The problem isn't that neural networks are useless — it's that most people use them (and sell them) in ways that have nothing to do with real trading.
What Neural Networks Actually Do
Underneath the hype, a neural network is just a flexible function approximator:
You feed it inputs (price, volume, indicators, sentiment, etc.)
It learns internal weights that map those inputs to outputs
It adjusts those weights to reduce error on past data
They are powerful because they can model complex, non‑linear relationships. But that power is a double‑edged sword: they can also memorize noise and call it "pattern".
The Big Myths (and the Boring Reality)
Myth: "AI predicts direction with high accuracy"
Reality: Markets are adaptive. High "accuracy" often means tiny moves or rare trades.
A model that wins 90% of the time by making 0.1% might still blow up on the 10% it loses.
Myth: "Deeper = Better"
Reality: Extra layers don't magically create edge.
Often, simple models with clear logic survive regimes better than giant black boxes.
Myth: "The AI will find hidden alpha humans can't"
Reality: It can only find what exists in the data you give it .
Garbage in, overfit magic out.
The AI revolution doesn't remove the need for market understanding — it punishes the lack of it faster.
Where Neural Nets Make Sense in Trading
In the AI era, the realistic edge isn't "my network predicts the next candle". It's using ML for jobs humans are bad at:
Sentiment and Text – Classifying news and social feeds as bullish/bearish/neutral.
Regime Detection – Clustering periods into "trend", "range", "crisis", etc.
Feature Extraction – Turning raw data into useful signals that simpler rules can trade.
Execution Optimization – Deciding how to slice orders to minimize impact and cost.
In all of these, the network is a component of your system, not the entire strategy.
The Overfitting Trap (Where Most AI Traders Die)
Neural networks are overfitting machines if you don't constrain them.
Signs you're in trouble:
Almost perfect backtest equity curve
Hundreds of parameters and indicators in the input
Performance collapses when you shift the date range or symbol
A few trades account for most of the profit
Remember: the network is trying to minimize past error, not maximize future robustness.
Practical Guidelines for Using Neural Nets in the AI Era
Start With the Problem, Not the Model
"I want to forecast tomorrow's close" is vague.
"I want to classify if we're in a high‑volatility regime" is concrete.
Keep Inputs Honest
No look‑ahead data.
Use realistic, survivorship‑aware histories.
Hold Out Real Out‑of‑Sample Data
Data the model never touches during training.
Use it once as a final exam, not 20 times as another tuning set.
Prefer Simple Uses Over "Magic"
Use nets to rank or score, not to call exact highs and lows.
Combine ML outputs with transparent risk rules.
AI Is a Tool, Not a Free Lunch
Neural networks are part of the AI trading toolkit — not the holy grail.
In this era, the traders who win are the ones who can:
Ask precise questions
Understand what their models are actually doing
Say "no" to beautiful but fragile backtests
Use AI to extend your edge, not to replace thinking.

The Psychology of Letting AI Trade for YouThe Hardest Part of AI Trading Isn't the Code - It's Letting Go
You can spend months building the perfect system.
You backtest it. Tweak it. Optimize it.
And then, the first time it takes three losses in a row, you override it.
In the era of AI and automation, the battlefield has shifted. The challenge is no longer just "Can I build a system?" — it's "Can I trust it enough to let it work?"
The New Psychological Game: Humans vs Their Own Bots
We tell ourselves we want robots to remove emotion.
What actually happens is more subtle:
We stop being emotional about individual trades
We start being emotional about the system itself
Instead of:
"Should I exit this trade?"
you think:
"Is the bot broken?"
"Should I turn it off?"
"Why did it take this trade? I wouldn't have."
The emotions don't vanish. They just move up a level.
The 5 Stages of AI Trading Psychology
Euphoria – Early wins, "this thing is a money printer."
Doubt – First real drawdown, "maybe it's not as good as I thought."
Intervention – You start skipping signals, closing early, or adding your own trades.
Confusion – You can no longer tell if results are from the system or from your meddling.
Integration (or Abandonment) – Either you learn your role vs the system… or you conclude "AI doesn't work" and go back to pure manual trading.
Most traders get stuck between stages 2–4. The goal is to move to stage 5 with eyes open .
Calibrated Trust: Between Blind Faith and Total Control
Two extremes kill AI trading:
Blind Trust – "The bot knows best, I'll never question it."
Zero Trust – "I'll override whenever I feel like it."
You want calibrated trust :
You understand how the system makes decisions
You know its expected win rate, drawdown, and losing streaks
You have written rules for when you will and won't intervene
Think of it as a partnership: the AI follows the rules; you manage the environment and the risk.
Designing Your Role Before You Turn the Bot On
Before you ever hit "start", write down:
Which signals you will take without second‑guessing
Which situations require human review (major news, tech issues, extreme volatility)
Your hard stop conditions:
Max daily loss
Max drawdown
Max number of consecutive losses
Your review schedule (weekly, monthly) for performance and logic
If your rules only live in your head, your emotions will rewrite them in real time.
Emotional Hacks for the AI Era
Trade Smaller Than You Think You Should
If you can't sleep, size is too big. No psychology trick beats position sizing.
Check Less Often
Every peek at P&L triggers a reaction.
Schedule times to review, rather than watching every tick.
Journal Your Urges, Not Just Your Trades
Write down: "Wanted to stop the bot after 3 losses, didn't."
Or: "Overrode this signal, why?"
Separate Process From Outcome
Good process + bad short‑term outcome is still a win .
Bad process + good short‑term outcome is a landmine.
Your Mind Is Still the Edge
AI can:
Scan faster
Execute cleaner
Track more variables than you ever could
But only you can decide:
What risk you are truly willing to take
When a drawdown is "normal" vs unacceptable
Whether the system still makes sense in the current regime
In the AI trading era, the real edge is a calm, knowledgeable person who knows when to trust the system - and when to step back.

The 5 Types of Trading Bots Every Trader Should Know
Not All Trading Bots Are the Same - Some Amplify Your Edge, Some Amplify Your Pain
Saying "I want a bot" is like saying "I want a vehicle":
A Formula 1 car
A delivery truck
A scooter
A helicopter
All are vehicles. None are interchangeable.
In the era of AI‑assisted trading, bots are execution engines for your ideas. This post breaks down five major bot archetypes so you can stop hunting for "the best bot" and start matching the right structure to your market, risk profile, and skill set.
First Cold Truth: Bots Don't Create Edge — They Scale It
Before we talk types, it’s worth being brutally honest:
If your strategy has no edge, a bot just lets you lose money faster, more consistently, and with perfect discipline.
Bots are about discipline , speed , and scalability . The edge still has to come from your logic, testing, and risk framework.
Quick Map of the 5 Bot Types
Trend‑Following: Ride directional moves, ignore the noise.
Mean‑Reversion: Fade extremes, bet on snap‑backs.
Grid: Harvest volatility inside a range.
Signal‑Based: Turn ideas/alerts into consistent execution.
Arbitrage: Exploit price differences between related markets.
From here, you want to ask two things: What structure is the market in? and What structure is my brain comfortable with?
Type 1 – Trend‑Following Bots
These bots try to behave like a disciplined trend trader that never hesitates and never gets emotional.
Core idea: Buy strength in uptrends, sell weakness in downtrends.
Typical tools:
Moving‑average crossovers (fast vs slow)
Breakouts above recent highs or below recent lows
Momentum filters (e.g., ADX, rate of change, volatility filters)
Shine in: Clean, directional markets where pullbacks are shallow.
Struggle in: Sideways chop where price crosses the same levels repeatedly.
Main risk: A long sequence of small whipsaw losses when there is no real trend.
In the AI era, you can use models to classify regimes (trending vs ranging) and only let the trend bot run when the environment actually supports it.
//@version=6
indicator("Simple Trend Filter", overlay=true)
fast = ta.ema(close, 20)
slow = ta.ema(close, 50)
trendUp = fast > slow
trendDown = fast < slow
// Simple visual trend filter
plot(fast, color=color.teal)
plot(slow, color=color.orange)
bgcolor(trendUp ? color.new(color.teal, 90) : trendDown ? color.new(color.orange, 90) : na)
This kind of logic is usually just one piece of a full bot, but it shows how a trend‑following engine "sees" the market.
Type 2 – Mean‑Reversion Bots
Mean‑reversion bots assume that, most of the time, price doesn't drift off to infinity — it oscillates around some reference value.
Core idea: Fade overextended moves and bet on a return to the mean.
Typical tools:
RSI or Stochastic extremes ("overbought" / "oversold")
Touches or pierces of Bollinger Bands
Deviation from a moving average (z‑score, % distance)
Shine in: Ranging markets, stable channels, and mean‑reverting pairs.
Struggle in: Strong trends where "oversold" keeps getting more oversold.
Main risk: One big runaway move can erase many small wins if sizing and stops are not controlled.
These bots can feel smooth until they don't. AI can help here by measuring when volatility/range structure changes and cutting exposure before that "one big trend" shows up.
Type 3 – Grid Bots
Grid bots are volatility harvesters. They care less about direction and more about price oscillating through pre‑defined levels.
Core idea: Place a ladder of buy and sell orders above and below price.
Profit engine: As price bounces through the grid, the bot systematically buys lower, sells higher, and repeats.
Shine in: Sideways but active markets that revisit levels frequently.
Struggle in: Strong one‑way moves that blow through the grid and never mean‑revert.
Main risk: Deep, unrealized drawdowns if price trends hard against the grid without a safety mechanism.
Smart grid design in the AI era often includes:
Dynamic grid width that widens or tightens based on volatility
Max drawdown or margin‑usage limits that trigger a partial or full shutdown
Regime filters that turn the grid off when a strong trend is detected
Type 4 – Signal‑Based Bots
Signal bots don't "think" on their own – they are pure executors. Their job is to turn a human or model‑generated signal into consistent, rules‑based action.
Core idea: Separate idea generation from order execution .
Signal sources can include:
Multi‑indicator confluence (trend + volume + volatility)
Pattern recognition (breakouts, candle patterns, structures)
Order‑flow or whale‑tracking alerts
On‑chain, macro, or sentiment data for crypto and indices
Shine in: Any market where the underlying signal logic has been tested and proven.
Struggle in: Environments where the signal is over‑fitted, delayed, or not monitored.
Main risk: Blind faith in a black‑box signal without understanding its limits.
This is where AI often plugs in directly – models generate scores or labels, and the bot simply acts when the score crosses a threshold.
Type 5 – Arbitrage Bots
Arbitrage bots focus on relationships instead of single charts. They look for small, temporary mispricings and try to lock them in.
Core idea: Buy where something is cheap and sell where it's expensive, as close to simultaneously as possible.
Common approaches:
Same asset, different exchanges (spot vs spot or spot vs perp)
Triangular FX arbitrage between three currency pairs
Statistical arbitrage between correlated assets that have diverged
Shine in: Fragmented, less efficient markets with occasional big gaps.
Struggle in: Highly efficient markets where spreads and latency competition eat the edge.
Main risk: Execution risk – slippage, fees, and delays can flip a theoretical "risk‑free" trade into a losing one.
These are the most infrastructure‑heavy bots. Latency, connectivity, fee structure, and capital sizing matter as much as the model itself.
Choosing Your Bot in the AI Era
Instead of asking "Which bot makes the most?", ask:
What market structure am I actually trading most of the time?
How much drawdown and variance am I truly comfortable with?
Am I more aligned with riding trends or fading extremes?
What is my technical and infrastructure level right now?
Where can AI realistically help me – signal quality, risk controls, or execution?
AI can support you by:
Classifying regimes (trend vs range) and routing orders to the right bot type
Monitoring portfolio‑level risk across multiple bots and symbols
Detecting when performance degrades and suggesting parameter reviews
But the decision of which bot to run, when to turn it off, and how to size it is still your responsibility.
Your Turn
Which of these five bot types actually fits your temperament and the markets you trade right now?
If you had to upgrade one layer of your automation with AI today - signal generation, risk management, or execution - which one would move the needle the most for you?
Share it below. The clearer you are about what kind of bot you’re running and why , the less you’ll ever have to blame "the bot" when the outcome doesn’t match the plan.
Mutanabby_AI | ONEUSDT_MR1Simple question:
As a quant trader, do you think this strategy will survive in live trading?
Yes or No? And why?

Pine Script v6: The AI-Assisted Coding RevolutionAI Isn't Replacing Pine Script Developers, It's Creating More of Them
For years, if you wanted custom tools on $TRADINGVIEW, you had two options:
Spend months learning to code, or
Settle for whatever public indicators were available
The era of AI assisted Pine Script changes that. You don't have to choose between "coder" and "trader" anymore, you can be both, with AI as your quiet co‑pilot.
Why Pine Script + AI Is a Big Deal
In the new AI trading era, edge comes from:
Being able to test ideas quickly
Turning those ideas into rules
Automating those rules in a language the platform understands
AI can't give you edge by itself. But it can remove almost all of the friction between the idea in your head and a working NYSE:PINE script on your chart.
Instead of:
Googling syntax
Copy‑pasting random snippets
Debugging mysterious errors at 2am
you can describe your logic in plain language and let AI handle the boilerplate, while you stay in control of the trading logic.
The Modern Pine Script Workflow (AI Edition)
Old workflow:
Learn programming basics from scratch
Read documentation line‑by‑line
Write every line of code yourself
Fix every typo and bug manually
New workflow:
Define the strategy in plain English
Ask AI to draft the first version in Pine Script v6
Review and understand what it wrote
Refine, test, and harden it on your charts
The difference isn't "AI does everything" it's AI accelerates everything . You move from "How do I code this?" to "Is this idea actually good?" much faster.
What AI Is Great At in Pine Script
Syntax and Structure - Getting the small details right:
`indicator()` declarations
`strategy()` settings
Inputs, colors, line styles
Common functions like `ta.sma`, `ta.rsi`, `ta.crossover`
Boilerplate Code - The parts that repeat across almost every script:
Input sections
Plotting logic
Alert conditions
Explaining Code Back to You - You can paste a snippet and ask:
"What does this variable do?"
"Why is this `if` statement here?"
"Can you rewrite this more clearly?"
This is how you learn Pine Script by doing , instead of from a dry textbook.
What AI Is NOT Good At (If You Rely on It Blindly)
Designing Your Edge - AI doesn't know your risk tolerance, timeframe, or style. You still have to define the actual trading idea.
Protecting You From Over‑Optimization Ask it to "improve" a strategy and it may add 20 inputs that look perfect on past data and fail live.
Understanding Market Context - It can code the rules, but it doesn't "feel" what a trend, rotation, or macro regime shift means to you.
Use AI as a smart assistant, not an oracle.
Core Pine Script Concepts You Still Need
Even in the AI era, a few fundamentals are non‑negotiable. Think of them as the alphabet you must know, even if AI writes the sentences:
1. Data Types
float // prices, indicator values
int // bar counts, lengths
bool // conditions (true/false)
string // labels, messages
color // styling
2. Series Logic
Every variable in Pine is a time series . You don't just have `close`, you have `close `, `close `, etc.
close // current bar close
close // previous bar close
high // high from 5 bars ago
3. Built‑In Indicator Functions
You don't need to reinvent moving averages and RSI:
ma = ta.sma(close, 20)
rsi = ta.rsi(close, 14)
longCondition = ta.crossover(close, ma)
If you understand what these do, AI can handle how to wire them together.
A Clean AI‑Assisted Workflow to Build Your Next Indicator
Write the idea in plain language
"I want a trend filter that only shows long signals when price is above a 200‑period MA and volatility is not extreme."
Ask AI for a first draft in Pine Script v6
Specify: overlay or separate pane, inputs you want, and what should be plotted.
Read every line
Use AI as a teacher: "Explain this variable", "Explain this block".
Test on multiple markets and timeframes
Does it behave the way you expect on CRYPTOCAP:FOREX , $CRYPTO, and stocks?
Does it break on higher timeframes or very illiquid symbols?
Iterate, don't chase perfection
Tweak one idea at a time.
Avoid adding endless inputs just to fix old trades.
The Bigger Picture: Coders, Traders, and the AI Era
The old split was:
"Coders" who could build things but didn't trade
"Traders" who had ideas but couldn't code them
In the AI era, that wall disappears. The trader who can:
Describe ideas clearly
Use AI to generate Pine code
Understand enough to test and refine
…gets a massive edge over both pure coders and pure discretionary traders.
You don't need to be perfect. You just need to be dangerous, one well‑tested script at a time.
Your Turn
If you could build one custom tool this month with AI's help, what would it be?
An entry signal? A dashboard? A risk overlay?
Drop your idea below and consider this your sign to finally turn it into code.
AI Trading: The Revolution You Can't IgnoreThe Era of AI Trading Has Arrived And It's Only Getting Started
Forget the movie version of AI glowing red eyes flawlessly predicting every tick. The real story is colder, quieter, and way more powerful:
We are moving from a world where humans look at charts to a world where machines digest every tick, every candle, every flow of data… and feed you the edge you couldn't see on your own.
Right now, as you read this, AI is already sitting inside:
Execution algorithms routing institutional orders across venues
Risk engines stress testing portfolios in milliseconds
News and sentiment scanners parsing thousands of headlines a minute
Retail tools that turn a paragraph of English into working NYSE:PINE Script
This isn't science fiction. This is the baseline. And the baseline is rising.
The traders who survive this decade won't be the ones fighting AI. They'll be the ones partnering with it.
So What Exactly Is "AI Trading"?
At its core, AI trading is simply using algorithms that can learn from data to make parts of the trading process smarter.
That can mean anything from a small script that filters charts for you, all the way up to full stack systems managing billions. The spectrum looks like this:
AI Assisted Analysis You still click the buttons, but AI does the heavy lifting.
Pattern recognition on charts (trend, ranges, breakouts)
Scanning hundreds of symbols for your exact conditions
Sentiment analysis on news and earnings headlines
Idea generation: "Show me all large‑cap stocks breaking out with above‑average volume"
AI‑Generated Signals The machine tells you what it would do; you decide whether to listen.
Multi‑indicator models that output clear long/short/flat signals
Quant models that score each asset from 0-100 based on your rules
Bots that push alerts when high‑probability setups appear
Fully Automated Trading The system trades end‑to‑end while you supervise.
Execution from signal → order → risk control with no manual clicks
Self adjusting position sizing and risk controls
Strategies that re‑train on fresh data as regimes shift
Wherever you are on that spectrum, you're already in the AI game. The question isn't "Will I use AI?" it's "How deeply will I let it into my process?"
How AI Actually "Sees" the Market
Humans see a chart. AI sees a dataset.
Human view:
One instrument at a time
A couple of timeframes
A handful of indicators you like
Heavily filtered through emotion and bias
AI view:
Thousands of symbols at once
Dozens of timeframes and derived features
Years of historical data compressed into patterns
Zero fear, zero FOMO, zero boredom
Feed a model clean data and it can uncover:
Regimes you feel but can't quantify (trend, chop, grind, panic)
Relationships between assets that hold statistically
Behavioral patterns like "late‑day reversals after gap‑up opens"
Execution patterns in the order book around key levels
But here's the crazy part: AI is completely unforgiving about your assumptions.
If the data is noisy, biased, or poorly structured, the model will happily learn the wrong thing and apply it with perfect discipline. "Garbage in, garbage out" gets amplified at machine speed.
The Era We're Entering: Human + AI, Not Human vs AI
Over the next decade, expect three shifts to accelerate:
From Intuition First → Data‑First
Traders will still have hunches, but they'll validate them against hard data.
Instead of "this looks extended", you'll ask the system: "How often do moves like this actually continue?" and get an answer in seconds.
From Single‑Indicator Thinking → Multi‑Signal Models
No more worshiping one magic oscillator.
AI will blend technicals, fundamentals, flows, and sentiment into a unified view.
From Static Systems → Adaptive Systems
Instead of one set of parameters forever, models will adapt as volatility, liquidity, and structure change.
Think of it as a trading playbook that rewrites itself when the game changes.
Technologies like larger language models, specialized chips, and eventually quantum‑accelerated optimization won't magically "solve" markets, but they will make it cheaper and faster to test ideas, build systems, and manage risk.
The edge shifts from "Can I code this?" to "Can I ask the right questions, define the right constraints, and manage the risk around what the models tell me?"
Where You Fit In As a Trader
In the era of AI, your job becomes less about staring at every tick, and more about designing the rules of the game your tools play.
You define what "good" trades look like.
You choose which markets, timeframes, and risks matter.
You decide when a model is behaving, and when it's time to shut it off.
AI gives you:
Speed: scanning what you could never cover alone
Consistency: executing the plan without emotional drift
Feedback: showing you what really works in your own data
You bring:
Context: macro, narrative, and common sense
Values: what risks you refuse to take
Adaptability: knowing when to step back or switch regimes
Put together, that's where the edge lives.
Getting Started in the AI Era (Without Getting Overwhelmed)
You don't need a PhD, a server rack, or a lab full of quants. You can start small and intelligent:
Audit Your Current Process
Where are you slow? (Scanning, journaling, testing?)
Where are you emotional? (Entries, exits, sizing?)
Those are prime targets for AI assistance.
Add One AI Tool at a Time
Maybe it's an AI screener.
Maybe it's an NYSE:PINE Script assistant that helps you code and backtest.
Maybe it's a journaling tool that tags your trades automatically.
Learn to Read the Data Behind the Magic
Look at win rate, drawdown, expectancy.
Compare AI filtered setups to your old ones.
Keep what clearly improves your edge; drop the rest.
Respect the Risks
Over‑fitted models that look perfect on the past.
Black‑box systems you can't explain.
Over‑reliance on automation with no kill switch.
Is AI Going to Take Over Trading Completely?
In some corners of the market, AI and automation already dominate . High‑frequency execution, index rebalancing, options market‑making, these domains are machine territory.
But markets are more than math. They are human fear, greed, regulation, politics, liquidity constraints, structural changes and unexpected shocks. That messy mix is exactly where human oversight still matters.
The most realistic future isn't "AI replaces traders" it's AI replaces undisciplined, unstructured traders who bring nothing but guesses to the table.
Traders who can think in systems, understand risk, and collaborate with machines? They don't get replaced. They get leverage.
Your Turn
Where are you right now in this evolution?
Still fully manual, doing everything by hand?
Using a few AI assisted tools but not trusting them yet?
Already running bots and systematic strategies?
What part of AI trading are you most curious or skeptical about?
And the big question: Do you think the future of trading belongs to AI, or to traders who know how to use it?
Drop your thoughts in the comments this era is just beginning.

Algotrading AVAX longPress "Grab this chart", run strategy tester since 2020 and make sure that is good time for a long to yellow line

Algotrading XTZUSDTPress "Grab this chart", run strategy tester for entire history and make sure that is good time for a long to yellow line

Algotrading DOTUSDTPress "Grab this chart", run strategy tester and make sure that is good time for a long to yellow line

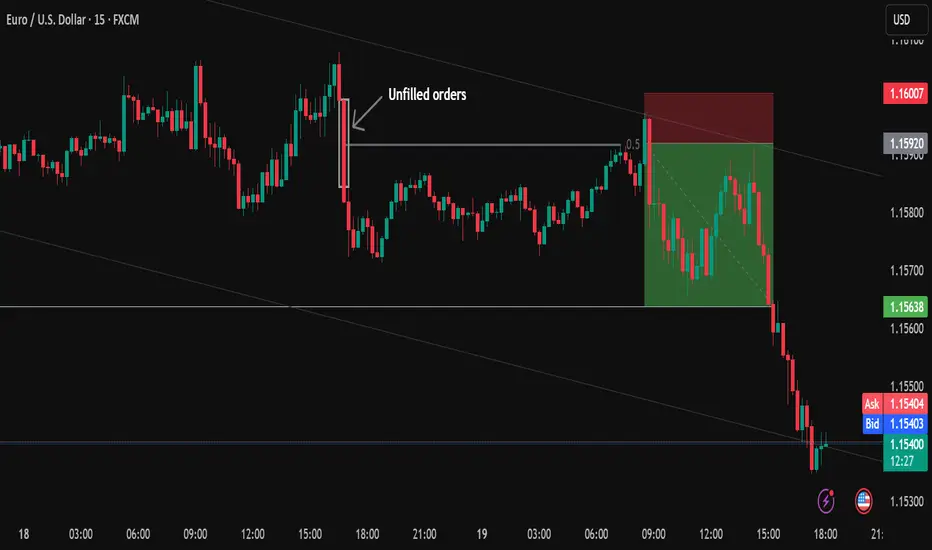
The market isn’t random. It’s driven by algorithms.The market is not arbitrary. It is powered by algorithms that essentially accomplish just two tasks:
either push the price in the direction of the next liquidity pool or pull it back to fill the orders they missed en route, such as leftover blocks, imbalances, and unfulfilled orders.
Understanding that basic behavior is the foundation of everything I trade.
Since it indicates where the algorithm is attempting to go next, I begin with the higher-timeframe trend.
Then, in order to determine which side is in control, I wait for a powerful push, a distinct, quick displacement.
The algorithm nearly always retraces slowly after that push because it must return to correct imbalances and complete the orders it overlooked.
Additionally, that gradual decline indicates that the trend is still going strong.
A quick or forceful pullback indicates that the algorithm is probably changing course because it is creating new imbalances rather than going back to correct the previous ones.
I therefore only accept trades when the price gradually returns to my order blocks, imbalances, or prior liquidity areas before moving on to the next pool of liquidity.
I don't forecast highs or lows.
I do not oppose the market.
All I'm doing is following the algorithm as it shifts from one liquidity pool to the next, making any necessary corrections before moving on.
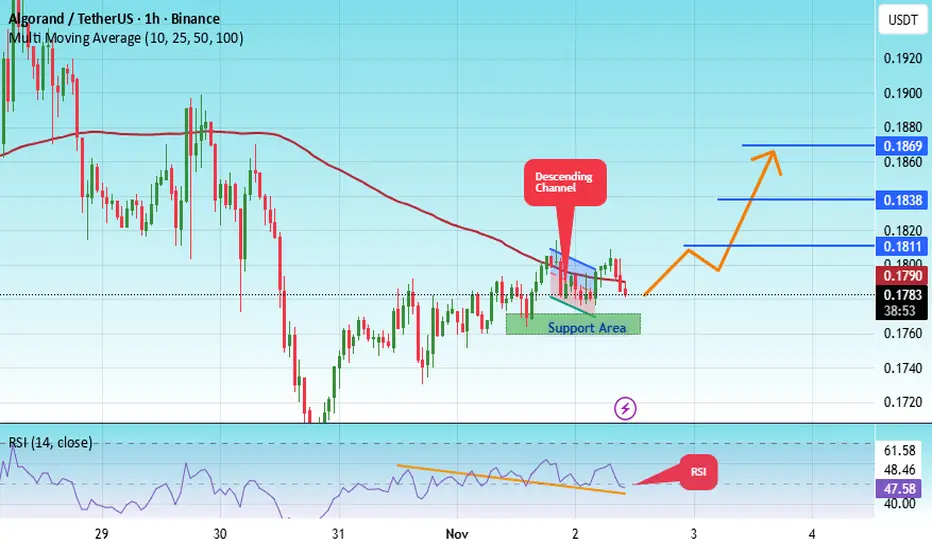
#ALGO/USDT - this will go up#ALGO
The price is moving within an ascending channel on the 1-hour timeframe and is adhering to it well. It is poised to break out strongly and retest the channel.
We have a downtrend line on the RSI indicator that is about to break and retest, which supports the upward move.
There is a key support zone in green at 0.1764, representing a strong support point.
We have a trend of consolidation above the 100-period moving average.
Entry price: 0.1784
First target: 0.1811
Second target: 0.1840
Third target: 0.1870
Don't forget a simple money management rule:
Place your stop-loss order below the green support zone.
Once you reach the first target, save some money and then change your stop-loss order to an entry order.
For any questions, please leave a comment.
Thank you.
short term cluster targets for bull +EV case in btc- ml predictions of 3 meaningful levels
- time horizon: 1-2 weeks
- trail stop lower low after 1st target achieved
- t2, t3 partial profits or full close

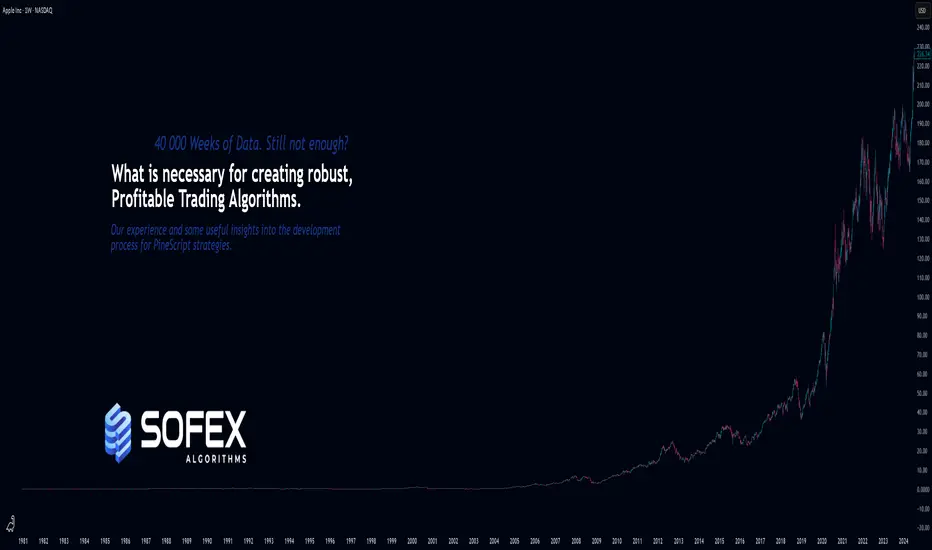
A few important steps for creating robust and winning StrategiesAs the title says, I want to share knowledge & important insights into the best practices for creating robust, trustworthy and profitable trading Strategies here on TradingView.
These bits of information that my team I have gathered throughout the years and have managed to learn through mostly trial and error. Costly errors too .
Many of these points more professional traders know, however, there are some that are quite innovative for all levels of experience in my opinion. Please, feel free to correct me or add more in the comments.
There are a few strategic and tactical changes to our process that made a noticeable difference in the quality of Strategies and Indicators immediately.
Firstly and most importantly, we have all heard about it, but it is having the most data available. A good algorithm, when being built NEEDS to have as many market situations in its training data as possible. Choppy markets, uptrends, downtrends, fakeouts, manipulations - all of these are necessary for the strategy to learn the possible market conditions as much as possible and be prepared for trading on unknown data.
Many may have heard the phrase "History doesn't repeat itself but rhymes well" - you need to have the whole dictionary of price movements to be able to spot when it rhymes and act accordingly.
The TradingView Ultimate plan offers the most data in terms of historical candles and is best suited for creating robust strategies.
___
Secondly, of course, robustness tests. Your algorithm can perform amazingly on training data, but start losing immediately in real time, even if you have trained it on decades of data.
These include Monte-carlo simulations to see best and worst scenarios during the training period. Tests also include the fundamentally important out-of-sample checks . For those who aren’t familiar - this means that you should separate data into training sets and testing sets. You should train your algorithm on some data, then perform a test on unknown to the optimization process data. It's common practice to separate data as 20% training / 20% unknown / 20% training etc. to build a data set that will show how your algorithm performs on unknown to it market movements. Out of sample tests are crucial and you can never trust a strategy that has not been through them.
Walk-forward simulations are similar - you train your algorithm on X amount of data and simulate real-time price feeds and monitor how it performs. You can use the Replay function of TradingView to do walk-forward tests!
When you are doing robustness tests, we have found that a stable strategy performs around 90% similarly in terms of win rate and Sortino ratio compared to training data. The higher the correlation between training performance and out of sample performance, the more risk you can allocate to this algorithm.
___
Now lets move onto some more niche details. Markets don’t behave the same when they are trending downward and when they are trending upwards. We have found that separating parameters for optimization into two - for long and for short - independent of each other, has greatly improved performance and also stability.
Logically it is obvious when you look at market movements. In our case, with cryptocurrencies, there is a clear difference between the duration and intensity of “dumps” and “pumps”. This is normal, since the psychology of traders is different during bearish and bullish periods. Yes, introducing double the amount of parameters into an algorithm, once for long, once for short, can carry the risk of overfitting since the better the optimizer (manual or not), the better the values will be adjusted to fit training data. But if you apply the robustness tests mentioned above, you will find that performance is greatly increased by simply splitting trade logic between long and short. Same goes for indicators.
Some indicators are great for uptrends but not for downtrends. Why have conditions for short positions that include indicators that are great for longs but suck at shorting, when you can use ones that perform better in the given context?
___
Moving on - while overfitting is the main worry when making an algorithm, underoptimization as a result of fear of overfitting is a big threat too . You need to find the right balance by using robustness tests. In the beginning, we had limited access to software to test our strategies out of sample and we found out that we were underoptimizing because we were scared of overfitting, while in reality we were just holding back the performance out of fear. Whats worse is we attributed the losses in live trading to what we thought was overfitting, while in reality we were handicapping the algorithm out of fear.
___
Finally, and this relates to trading in general too, we put in place very strict rules and guidelines on what indicators to use in combination with others and what their parameter range is. We went right to theory and capped the values for each indicator to be within the predefined limits.
A simple example is MACD . Your optimizer might make a condition that includes MACD with a fast length of 200, slow length of 160 and signal length of 100. This may look amazing on backtesting and may work for a bit on live testing, but these values are FUNDAMENTALLY wrong (Investopedia, MACD). You must know what each indicator does and how it calculates its values. Having a fast length bigger than the slow one is completely backwards, but the results may show otherwise.
When you optimize any strategy, manually or with the help of a software, be mindful of the theory. Mathematical formulas don’t care about the indicator’s logic, only about the best combination of numbers to reach the goal you are optimizing for - be it % Return, Profit Factor or other.
Parabolic SAR is another one - you can optimize values like 0.267; 0.001; 0.7899 or the sort and have great performance on backtesting. This, however, is completely wrong when you look into the indicator and it’s default values (Investopedia, Parabolic SAR).
To prevent overfitting and ensure a stable profitability over time, make sure that all parameters are within their theoretical limits and constraints, ideally very close to their default values.
Thank you for reading this long essay and I hope that at least some of our experience will help you in the future. We have suffered greatly due to things like not following trading theory and leaving it all up to pure mathematical optimization, which is ignorant of the principles of the indicators. The separation between Long / Short logic was also an amazing instant improvement.
View the linked idea where we explain the psychology of risk management and suggest a few great ways to calculate and manage your risk when trading - just as important as the strategy itself!
What do you think? Do you use any of these methods; Or better ones?
Let us know in the comments.
AlgorandAlgo usdt daily analysis
Time frame 4 hours
Risk rewards ratio >2.5 👈
Target = 0.33 $
I entered long position at the end of down trend
LS is so close and tight to decrease of damage
