840% Rocket Pool—500% Potential Profits @$30 Conservative TargetI found a good chart setup. Rocket Pool peaked its initial bullish breakout 11-May and has been sideways for the past few weeks. The chart is showing that the retrace is over/complete.
The initial breakout, between 7-April and 11-May, produced a total of ~135% growth. This happened in a little over a month.
The retrace ended as a clear-classic higher low and trading volume has been very high leaning towards the bullish side. This is a strong giveaway signal.
Market conditions are bullish for this pair. A continuation can happen anytime.
One thing though, there can be lower prices. Say a little more retrace and drop above the 6-May low at $3.85. There can be another drop if there isn't enough momentum to move higher and the higher low ends at $3.90. This is something that we have to wait and see. Both scenarios are high probability; straight up next week, or more consolidation before additional growth. Both scenarios are bullish on all timeframes. Regardless of the short-term, Rocket Pool (RPLUSDT) is set to grow.
A very nice target here goes for 840%. This is a strong target but also easy to achieve later this year. Another target, strong but more conservative, is found around $30 for a 500% potential profits.
Thank you for reading.
Namaste.
Altcoins

Vana, Easy Short-Term 180% Target—Profits vs Greed—350% NextI am giving you this one as a short-term chart setup. Vana has been rising since mid-March and I sense this chart becoming stronger by the day. The fact that the action is still happening at bottom prices after months of sideways is also good. This means that the breakout will be a surprise and super strong. Our target can hit within days once resistance break.
Something like more slowly rising challenging upper resistance. Once this break, a huge big candle with 50-60% green. Then another one and another one until the market settles within the bullish zone. After the initial burst, a small retrace followed by long-term growth.
This trading is so easy it should be illegal. All that is needed is to buy and hold. The market takes care of the rest.
Profits can come in a week's time, just as it can come within several months; it doesn't matter, we wait. Better to have sure certain profits playing wisely the market, than losing everything out of greed and with high lev.
A win is always more profitable than a loss, no matter what our ego says. Our ego will say, "If it is going up anyways, why not go all-in with 10X?" When this reasoning takes over, the market is about to turn.
The truth is that nothing is certain and since the bots can adapt live, when too many people go into the same reasoning, then no more growth, the market needs to remove all this greed before moving ahead.
For us, the thinking goes something like this, "If I can make money easy with 100% certainty, why take such a huge risk?" "I can simply hold and wait. I rather make $10,000 safe and secure, than lose $2,000 thinking of earning the same day."
The thinking goes like this, "The truth is that I've been tempted before, my ego tends to lie and instead of a win, I end up with a major loss. I will be patient, I trust Master Ananda and his winning strategy through buy and hold."
The market can end up moving faster than before.
We are in June 2025. There isn't much time left. We are going to be bullish for months and months and months. The retraces, the corrections, the consolidation... It is all over, we are going up.
Namaste.

Gains Network, Another Higher Low & Bullish (2025 Bull Market)You know how I like to share lots of proof to support my thesis. Everything I share is data-supported. Whenever I am sharing speculative opinion I let you know.
So I tell you the altcoins are growing—based on technical analysis—and will continue to grow. But after this one, we are going to move on.
Here we have Gains Network (GNSUSDT) and another higher low. The higher low confirms the bulls are in, present, active. The higher low confirms that buyers are ready to buy even before the last low is reached. The higher low keeps the bullish chart structure intact. Higher highs and higher lows is the actual definition of an uptrend, rising prices.
The low happened 3-February. A double-bottom 7-April. Yesterday, 31-May, we have a higher low compared to April and February. Bullish confirmed.
This is not only a positive signal in the sense that the market will continue growing, this is a very strong buy signal in the sense that you can go all-in, buy like is the end of the world because prices will never be any lower.
You see, a higher low will lead to a higher high. The last high happened mid-May ~50% higher. The next high will be something amazing and unexpected.
The deal is that by now, market participants are highly conditioned to seeing weak bullish price action. Whenever there is strong action it is capped and there is a correction.
So prices grow and you miss selling because you were waiting for more. You learned your lesson, this time you are committed to taking profits at 30%-50% but guess what, the market keeps on going and grows 200%-300%.
This is not the time to think small, think big, think long-term.
This is not the time (the coming wave) to be happy with 20-30% because you missed the previous wave. The next wave will be one of the biggest of this newly developing bull market. I am warning you ahead of time so you can prepare.
Buy and hold while aiming for the moon and the beyond.
No rockets, aim with your mind because the moon is in a different dimension, you are just seeing its shadow, kind of a reflection.
So aim up as in the direction of growth, but we know we cannot get there with a rocket, we will need higher vibrations and these vibrations will let us reach our dreams and fulfill our goals.
Namaste.

Streamr Confirms Altcoins Market Continues BullishThis is the altcoins market bullish confirmed. The bottom happened 7-April 2025. This week we have a higher low; period.
This higher low confirms what I've been saying that we are bullish. Now, Streamr is a classic pair, and thus it has a classic chart and many other projects move in the exact same way. So you can know what many are doing and will be doing by looking at this chart.
The bottom came in April and now we have a higher low. This higher low is a retrace from the initial bullish breakout. From this higher low we will get very strong, sustained long-term growth. We are talking about months of bullish action. Can be 3-6 months.
Spot traders can continue to accumulate (buy and hold). The current retrace is an opportunity to buy-in, buy more, rebuy and reload at the best possible prices before the 2025 high-bullish momentum bull market.
I will keep it simple as this chart is meant to show that the bullish potential, bias and chart structure cannot be broken unless we get lower lows.
Even if the 7-April low is challenged, we know this is a stop-loss hunt event because a new low would require the extension of the previous low rather than the same level being tested.
Anyway, we are going up and this growth will happen long-term. Think June, July, August, September, October, November... And on and on.
Thank you for reading.
If you enjoy the content, you can follow for more.
Namaste.

Ethereum Vs Bitcoin —Bare Minimum, 222.22% Profits Bullish WaveEthereum's current move vs Bitcoin —ETHBTC— is over-extended:
1) The drop has gone way beyond the 0.786 Fib. retracement level, almost reaching 1 (which means a 100% correction).
2) Trading volume is non-existent. Which means that this move is not supported by real people.
3) The RSI is oversold. Which means that the current action is very likely reaching its end.
4) Ethereum (ETHBTC) is trading at, and activated, the lowest prices since late 2019. The main support zone for this pair.
The current bearish move is over-extended and is showing many weaknesses, a trend reversal can happen any day. ETHBTC has been dropping since December 2021. A market can only take so much.
The minimum target for the reversal is the baseline level. Just as ETHBTC went down to test its 2019 support but with a higher low, as soon as this support zone is reached the reverse becomes true. Now ETHBTC needs to test its late 2023 early 2024 resistance zone. This level is likely to break and price reach higher but this is the bare minimum.
» The bare minimum is a nice 222.22% profits potential bullish wave.
Namaste.

Bittensor Hits A New High, Bullish Altcoins ExplainedYesterday Bittensor (TAOUSDT) hit a daily high. The highest price since early January. The highest price in five months.
This is a strong signal and reveals the overall conditions of the market.
There was a shakeout but not all pairs/projects are the same. Those pairs trading really high, BTCUSDT is a great example, move to produce a retrace or correction.
Those pairs coming out of strong market bottom in early April, continue with their newly developed uptrend and the shakeout is nothing more than short-term noise. The market will continue to grow long-term.
Each chart/pair/project needs to be considered individually.
Manual stop-loss should be preferred.
Some pairs went on to test their 7-April low. With a limit stop-loss order, this shakeout would produce a loss. With our system of a manual stop-loss, the next day prices are back to baseline. This is what the manual stop-loss system is for, to avoid becoming a victim of a stop-loss hunt event.
Here we have TAOUSDT moving higher and higher, slowly. The market moves in waves.
It is a rising trend; higher highs and higher lows. But, invariably, there will be retraces and corrections along the way. Prices can still drop lower before additional growth, anything goes. The market can fluctuate wildly but the end result will be a new all-time high when we reach the bull run phase.
It takes time. The whole cycle needs 6-8 months to fully develop. This is only the start. For TAOUSDT, this start produced a total of 200% growth in less than two months. This is really good, but there will be more. Buy and hold.
Namaste.

OTHERS ROADMAPTo me the view is pretty clear.
* The purpose of my graphic drawings is purely educational.
* What i write here is not an investment advice. Please do your own research before investing in any asset.
* Never take my personal opinions as investment advice, you may lose your money.
Horizen: What You Need To Know About The Altcoins—Experts Only!A shakeout is a market move where the whales (exchanges) create volatility in order to rattle unprepared traders and investors.
If you use a limit stop-loss and you are clueless, the exchanges and market whales can see your orders and they use this to their advantage. Since they own all of the coins and everything basically, they can move the market. They produce a massive amount of pressure until everybody freaks out.
Those with too much leverage gets their positions liquidated. Everything lost. That's fine, it is their fault for being too greedy. Learn from your mistakes. Take the loss and move on. Nobody to blame. Just a lesson and a learning experience.
Those with a tight stop-loss limit order get to sell at a lower price and secure a small loss, sometimes between 10-30%.
Those patient, @MasterAnanda readers and followers, get to watch from a distance and even buy more when prices are low. No loss.
Let me get back into conspiracy theory mode.
So the market produced a bottom and is set to grow long-term. Very stupid and greedy people start to become very aggressive and decide to buy with 15, 18 and even 20 or more X.
We have no compassion for these people because this obviously greed, too much of it. And of course, this can never work.
The market is like a living being. Like a horse or a camel. It feels it has too much weight on top of it and if it wants to go the long ride, it has to get rid of this weight. The shakeout only lasts a few days but more than 1 billion USD was removed from the market. This is all leverage. This has nothing to do with buyers, investors or spot traders ok?
So these were literally gamblers that lost money. This is not a casino, this is a financial market. Learn to play the game or get REKT.
The way to play is to buy and hold.
The way to play is by participating, being part of the market and accumulating.
Of course, there is nothing wrong with gamblers but if you do gamble, there is a very strong risk involved.
While a gambler can lose everything in one single bet. A spot trader can hold and if prices drop, simply wait. The worst case scenario ends up being a long wait.
It is a shakeout and look at this chart, ZENUSDT. Two days later, the market is back up—full green. We have a higher low.
This is only the start. It will get harder and more complex as the bull market develops.
Please, whatever you do, do not use margin or leverage if you don't know what you are doing, the results is never anything good.
The only reason why you would use leverage is "to earn more money." "To earn more," "to earn fast." How did that go?
In the quest for fast money, big money, you ended losing hundreds of thousands in less than a month.
It can take 2-3 months to earn a sure 100-300%.
It can take 3 weeks to have your entire position liquidated.
Anyway, stay away from leverage if you can't keep it below 5X.
If you do go there, just know that you will not make it out alive. Everybody is thinking that they can beat the professionals, but the professionals are trading 24-7, you are on a phone and only check-in every few days. By the time you try to adapt, everything is gone. You are not buying from an exchange, you are competing against them and it is a losing game, they hold your money, your history, your data, your coins. They will always beat you because they know everything that you do, and you know nothing about how they work.
They'll give you a great website, lots of numbers, lots of cats and dogs and the illusion that you can make money easily without much effort. You lose money and they make billions.
If you want to win, play long-term.
Only use leverage when you have been successfully trading spot for 2-3 years, minimum. And when you do start with 3X.
By the way, if you don't have time to plan, to read, to prepare, you won't have time to get paid.
This is the most advanced game in the whole world. It is a money game. Only a very small percent are successful at it. Think before you believe you can come ahead without any effort, you are playing against us—we own the market.
Thank you for reading.
Namaste.

Ethereum: $2,000 Entry LONG Opportunity: Advanced Trading TipsBe careful when SHORTing here. The downside is limited but the upside is unlimited. Ideally, we trade with the trend. With the bottom being set 7-April, it would be wiser to wait for the higher low and go LONG. Now, bears are bears and bears are going to SHORT and that's ok. Just don't do it if you lack experience because it is harder than a LONG trade.
So here is the chart. The exact support level I cannot say but a bearish continuation looks high probability.
A $500 drop equals 20%. If you are doing 5X, this caps your profits potential to 100%. This isn't bad considering that it can happen within days. Experts only.
On the other hand, 3-10 days should be the maximum but of course, it can extend—these are just rough estimates.
This is how it is done from the bullish side, my side.
We wait patiently for the market to complete its retrace. We know it is a retrace because it is short-lived and because it ends in a higher low compared to the last major low.
We wait patiently for the drop and for clear reversal signals to show up on the chart. Once we have clear reversal signals, we go LONG. Very simple.
If you bought the LONG from the $1,570 level, then of course, nothing needs to be done. Sell a bit at each resistance, buy more at support. You can reduce your position even now. Remember, no need to get the exact top nor exact bottom. So you can sell some now, take profits; great. Then buy some more when prices are low. Your buy price can be $1800, $2000, $2100, it doesn't make much difference. What matters is selling high and buying low.
The first step is to get the great entry. Done. We did this back in April. The second step is to play the market as the bull market unravels. See how much time there always is to take action. Plenty of time to buy we had, plenty of time to sell.
For this to be profitable and successful we have to plan beforehand.
Here I am giving you live step by step instructions and this can also be done. But the truth is, people went LONG at resistance with high leverage and ended up losing everything, because we tend to trade based on an impulse. No, no, no.
Instead, detach, wait for the perfect moment and go LONG/SHORT.
Which one you prefer, bull?
Then wait for support and go LONG. Do not trade against your preferred bias.
Are you a bear?
Wait for resistance SHORT the retrace or wait for the correction. But this is many times harder of course because the downside is limited.
I hope you find this information useful and if you do...
Good luck.
Namaste.

Bitcoin Mixed: Below Resistance, Above Support (Altcoins Update)I hope you are having a good Saturday and weekend my dear friend, I have a quick update on Bitcoin and the Altcoins market today. Good news and bad news.
Let's start with the good news.
The Altcoins are producing a higher low and bullish. This means that we will continue to see growth as expected. The market went through a shakeout, nothing more.
On the Bitcoin side, we have the bad news which is not that bad.
The action is happening above support (grey dashed line on the chart) but below local resistance. The market just went through a major shakeout. I shall explain.
People got greedy and ended up putting too much leverage on their positions, when this happens, the market needs to balance things out because it cannot grow in this way long-term. And thus the shakeout. 1 billion dollars worth of LONGs were liquidated.
The good news is that once this process is over, the market can resume with its usual cycle but...
The situation is tricky now but I can tell you exactly what will happen. Bitcoin will consolidate before additional growth. While Bitcoin consolidates, the Altcoins will move up. Plan and simple.
What happens next with Bitcoin, down or up?
As long as Bitcoin trades above $100,000-$102,000 weekly/monthly the chart and market bias is considered ultra-bullish . This means that Bitcoin is ultra-bullish right now.
If the action moves and closes weekly below 100K, nothing happens. A simple retrace that ends in a higher low followed by additional growth.
The market is bullish now and will continue bullish.
The Altcoins are a good buy and this recent flush gives an opportunity for those that missed early prices.
Market conditions remain the same. We are bullish and set to grow long-term.
We are 100% bullish on Bitcoin and the Altcoins market.
Namaste.

Bitcoin Bullish, Will Not Hit $200,000 This Cycle, $137,000 NextBitcoin is still bullish. A higher low is a bullish development. If Bitcoin stops bleeding at around a price of $88,888.88 this would be a strong, perfect, higher low compared to 7-April and it would match perfectly a classic correction because this price sits at the Fibonacci golden ratio.
Good afternoon my fellow Cryptocurrency trader, timing is important and we got perfect timing on this retrace. How far down will it go?
It is still too early to say but we know that below $74,500 isn't possible because that's the last low. $78,000 is possible but not necessary so we are betting that the lowest ever will be above $80,000. Remember, Bitcoin will never ever trade below $80,000 in its history. Sorry, but these prices are gone, nobody can buy this low again.
There is good news though. You can still buy when the next low is established.
It is impossible to predict the exact price when Bitcoin will stop dropping, but it is possible to see a support level being developed. So when the next support is in, we can cover (close the SHORT) and go LONG again.
Pretty simple. Buy when prices are low, sell when prices are high.
A new all-time high is pretty high and thus we sell (sold).
When the next support level is established, we buy again.
Thanks a lot for your continued support.
Each Altcoin needs to be considered individually because some will grow while others move down. We are more advanced now in this bull market cycle. You can visit my profile for more.
Namaste.
WallectConnect Grows Beyond 595%, Correction Time?The market always seeks balance. A strong bullish wave is balanced out by a retrace or correction. Here this type of scenario is already developing.
WallectConnect (WCTUSDT) grew strongly since April 15, as did much of the market but found a peak recently.
Total growth amounts to 597% from the market bottom. From the first support, some ~400% which is awesome. After the retrace/correction, you can expect additional growth.
The volume today as the all-time high was hit became the highest since April 16. Bearish volume that is. The highest bearish volume bar came right after the all-time high. This is a warning signal.
Do not rush to buy, wait for the establishment of support. Once support is found, you can go LONG. When the chart is bearish, now, the doors open to SHORT.
Remember to do your own research, numbers and planning.
Market conditions can always change.
When prices are high, do use a stop-loss if you decide to buy and hold.
(Only when buying (trading) at bottom prices the stop-loss is not recommended for spot.)
Namaste.

Actions Nightmare Is About To Be FinishedHello, Skyrexians!
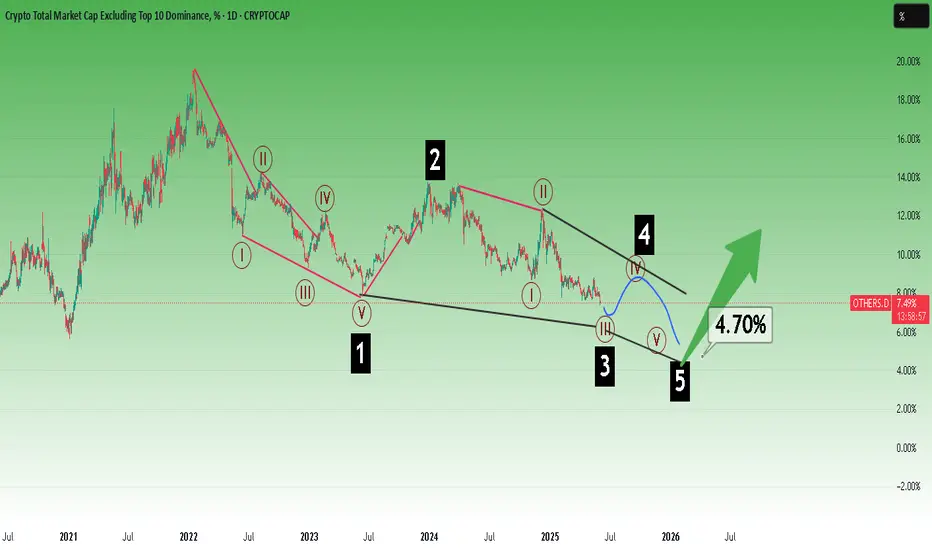
Recently I shared this article about CRYPTOCAP:OTHERS.D where I pointed out that this chart is about to print another one lower low. Now it's happening, but this is wave 5 and now it's time to look for the altcoins bear market bottom.
Here we have 4h time frame and the internal structure of the final wave 5. Our main reversal signal can be divergence on Awesome Oscillator, and now it can happen if this drop will be decelerated. Price is inside the large green box - reversal zone. If we will see 3 rising columns on the histogram it's going to be the reveal signal with the yellow Elliott waves structure. This structure can be changed if price continues going down now without pullbacks. In this case I will recalculate waves and may be it will reach 7%. Also it shall match with BTC dominance which also has some space to go up. It shall at least retest the high at 65.5% (potential shortened wave 5).
Best regards,
Ivan Skyrexio
___________________________________________________________
Please, boost this article and subscribe our page if you like analysis!

Altseason is cancelled for now. But Should resume soon.If you're interested in altcoins, be sure to check out my ideas. I’m closely tracking CRYPTOCAP:BTC.D and CRYPTOCAP:OTHERS , and you’ll find plenty of valuable insights in those analyses.
So, what’s going on? My CRYPTOCAP:OTHERS prediction played out — May was bullish. But was it the real altseason? Not quite. The true altseason typically begins at the end of the Bitcoin cycle, and we’re not there yet.
Right now, we’re seeing price action reminiscent of December 2024. Bitcoin maximalists are aggressively buying BTC during a time it should be correcting, which is inflating BTC dominance and crushing any momentum for an altseason. They appear to be using altcoins as exit liquidity to pump BTC, especially as retail investors hesitate to buy Bitcoin above $100K.
What’s next?
The daily MACD suggests we’re entering a correction phase that could last around two weeks. A drop toward $1.2T is likely, as there's a major order block between the current level and that target. However, the real support lies below $900B — my "green box" — which I view as the ideal buy zone.
Historically, entries in this green box have offered 2x–3x returns on high-volatility altcoins from the top 100, especially in sectors like memes, DeFi, and AI.
I expect altcoins to correct into that zone in the coming weeks — keep an eye on it.
DYOR (Do Your Own Research).
#Crypto #Altcoins #Bitcoin #BTC #BTCdominance #Altseason #CryptoMarket #CryptoTrading #MACD #TechnicalAnalysis #DeFi #MemeCoins #AIcoins #AltcoinSeason #DYOR

Market3I haven’t been posting much lately simply because there’s nothing particularly interesting to say, the market has been a bit dull.
2025 should be a strong year for altcoins, as they’ve been consistently suppressed. With BTC dominance reaching 64%, which is quite significant, all attention remains on Bitcoin.
On this chart, you can see that $1.17 trillion acted as a rejection level for the crypto market (excluding BTC and ETH). Time will tell, but I anticipate a $4 trillion altcoin bull market before the end of 2025.
Remember, Fibonacci plays a crucial role in long-term market predictions.
Invest wisely and at the right time.
Happy Tr4Ding !

$FET is about to re-enter my buy green zone. Quick update on this coin:
The consolidation appears to have found its bottom, and the bullish divergence has played out as expected.
We’re currently seeing a slight cooldown on the daily timeframe, which is healthy after the recent move.
If NYSE:FET enters my green buy zone, it could offer a strong long entry opportunity.
As always, make sure to DYOR, especially during these uncertain times for altcoins.
#FET #CryptoUpdate #Altcoins #TechnicalAnalysis #BullishDivergence #CryptoTrading #BuyZone #CryptoMarket

$BTC.D Dominance forecast: update May 2025📉 BTC Dominance (%BTC.D) Update – At Resistance, Altseason in the Balance
Back on April 5th, I published a forecast highlighting the critical 65% resistance level on BTC Dominance. That analysis still holds: BTC.D reached 65% and got rejected, pulling back to 62% as of now.
⚔️ What’s Happening?
Bitcoin dominance is compressing, and we're approaching a make-or-break moment:
🔹 Resistance confirmed at 65%
🔹 We bounced down to 62% — not up
🔹 Market is hesitating, and the next move will shape the short-term direction for alts
🔍 The Bigger Picture
Bitcoin pumped hard recently, mostly due to:
MACD reversal on the weekly
Oversold conditions now turning bullish
Renewed institutional interest in risk-on assets
But let’s be clear:
🚫 We’re not in a full altseason yet.
What we’re seeing is cautious altcoin rotation, not a blow-off alt rally.
📊 Tech Indicators
MACD: Overheated
RSI: Still has room to move up
So technically, BTC.D could still break out above 65% — but it hasn’t yet.
⚠️ What to Watch:
If BTC.D breaks out above 65%, expect:
➡️ Altcoin bloodbath
➡️ BTC.D could head toward 70%, crushing the mini-altseason
But if BTC.D continues to drop from here?
➡️ Altseason starts to heat up
🔮 Outlook
A true altseason might not arrive until September/October. For now, the market is stuck in a range of uncertainty.
Keep your eyes on:
BTC.D reaction at 62%–65%
TradFi stress (bond markets, macro fears)
Bitcoin strength and ETH/BTC ratio
🧠 Take profits when you can. Protect your capital.
📌 Follow me for future updates—and don’t forget to DYOR.
📎 Original forecast:

Dogecoin Bearish (BD) but Bullish (BU)You see, Dogecoin is bearish but this bearish is only short-term. This retrace can last a few days more and then the market will turn and start growing again. In the worst case scenario, the drop can extend and last one or two weeks, that's it. Nothing more.
So, what does it matter if it goes down short-term when it will grow in the long haul.
See the pattern on the chart and the rising trendline at the bottom. This is the main support. The bullish structure will remain intact, the market is adapting because obviously, too much leverage can never work.
Once the over-leverage is removed from the market, we resume growing and this resumption is just around the corner. Next week or the week after, it doesn't matter, we are going higher.
Namaste.

DEXE Update!You might not want to miss out on DEXE! 🚀
On the daily timeframe, DEXE has respected its support trendline and is currently in a rebound phase. The 100 EMA remains a key challenge, and historically, whenever DEXE has broken above it, the price has made massive moves.
With the support trendline holding strong, there’s a solid probability for DEXE to begin a bullish rally. 📈
You can wait for a breakout confirmation to enter this trade, or hold a small position and DCA.
🔹 Strategy:
~ Entry: $12.50 to $14.50
~ Trade Type: Spot or 3x leverage
~ Holding Period: Q3 (July–September 2025)
~ Invalidation: Breakdown and close below the support trendline
📝 Note: Always do your own analysis before investing.

Bullish Altcoins: Bitcoin Dominance In Correction ModeHere BTC.D is still moving within a classic ABC correction. The peak happened 7-May. After 14-May there was a bounce but this bounce ended in a lower high. The correction is not over.
As this index moves lower, the Altcoins market will grow.
When Bitcoin turns sideways, retraces or consolidates, it is an opportunity for the smaller Altcoins to move forward. This is the scenario we are entering right now.
» Bitcoin sideways. Altcoins bullish. Long-term growth.
The 2025 bull market is only starting now. Prepare for growth until late 2025 or beyond (early 2026).
Namaste.

XRP's Correction Might Not Be OverIt looks like XRPUSDT can recover any minute now but the correction might not be over.
Good morning my fellow Cryptocurrency trader, what an unpredictable market we have today.
The action has been bearish since 12-May and bearish momentum continues to grow. It seems the bearish action is stopping now but XRP has not reached support. While a recovery can happen any day, the signals are bearish and we have three consecutive days the action being red, plus more than two weeks seeing lower prices.
We are bullish long-term but short-term anything can happen.
Bearish volume is very, very low which means that the down-move has no strength. How much lower can it go? Always a higher low because XRP will continue to grow long-term.
The correction might not be over.
Namaste.

Bitcoin Strong-Bullish Above 102000, Remember The Bigger PictureWe've defined $102,000 as the strongest support level ever based on the long-term. This number was extracted using the 2021-2022 bear market. It is mapped which a red dotted line on the chart.
On this chart you can see how this level worked as resistance in December 2024 and January 2025, later to become the strongest support ever now, in May 2025. Bitcoin is 100% bullish as it trades above $102,000.
» I should say super-bullish, hyper-bullish, ultra-bullish, etc.
Right now Bitcoin is safe and sound when considering the bigger picture.
The Altcoins market is also safe and we can continue to accumulate; Buy and hold.
If you have any questions do not hesitate to leave a comment.
Please keep in mind that market conditions can always change. In a day without notice.
Thanks a lot for your continued support, it is truly appreciated.
Namaste.

SHORT Bitcoin 10X Lev. Full PREMIUM Trade-Numbers (PP: 175.6%)For experts only. This is not for beginners.
Leveraged trading is ultra-high risk and it is even harder when it comes to shorting.
This is not medical advice. This is not spiritual advice.
This is definitely not financial advice. This is just a chart and some numbers.
How you decide to use these numbers is completely up to you.
I am wishing you tons of luck and success; profits 100%.
This is a strong chart setup. It looks great.
_____
SHORT BTCUSDT
Leverage: 10X
Entry levels:
1) $111,111
2) $109,255
3) $108,000
4) $107,000
Targets:
1) $103,149
2) $101,012
3) $98,790
4) $94.239
5) $89,999
11) $88,888
Stop-loss:
Close weekly above $115,000
Potential profits: 175%
Capital allocation: 4%
_____
Thank you for reading.
If you enjoy the content make sure to follow.
(Leave a comment with your toughts.)
Namaste.
