OFFICIAL TRUMP 100X Chart Setup Now PossibleLook at this, the bottom is in.
I draw a black line on the chart that matches the wick low from the 3-April candle. Today, the action is back above this low.
All the action below this line is the bottom pattern. It takes time for a bottom to form and this bottom is now confirmed. Once the bottom is in, nothing else can happen other that sustained long-term growth. If the action wasn't sustained long-term, then this wouldn't be the bottom, just another low in place.
This is it, feel free to go All-In with 100X...
I am just kidding of course, leveraged trading is for experts and experts will never gamble their money away.
We trade with 2-3X maximum when we are doing our daily work and we go to higher leverage when the market is trading at its lowest prices possible and this happens only once every 6-8 months.
So, no 100X.
On top of the bottom pattern there is also a falling wedge. The falling wedge has been broken and this means a broken downtrend. What happened with the token unlock?
People were saying that prices were to drop because there was going to be a token unlock, but the market cycle does not care about these things. When prices are low we buy and hold, we sell when prices are high and green.
The targets on the chart are just easy targets, it can go much higher... Much, much higher than what is shown on this chart.
As prices grow, I will publish updates. If you are interested, make sure to boost and follow to show your support.
More comments and boosts, more updates.
Just let me know and I'll get it done.
Namaste.
Altcoins

ETHFI Breakout Loading? Targets Up to $1.67!$ETHFI/USDT Analysis
Price is currently trading around a key resistance zone after a strong recovery from recent lows. While momentum looks bullish, the resistance has not been broken yet — making this a crucial level to watch.
A clean breakout and candle close above this zone could confirm a potential rally toward the next targets.
🎯 Upside Targets (if breakout confirms):
TP1: $0.881
TP2: $1.291
TP3: $1.677
📌 For now, stay patient. Let the price action confirm before entering — this zone could act as a rejection point if bulls fail to push through.
DYOR, NFA

Altcoins, Crypto is different since institutions came inHow long have we been saying this? Yet the masses have not grasped this concept. Neother have influencers. But that makes sense because they need clicks to survive. People tend to "graze" where pasture seems greener, even if it isn't.
CRYPTOCAP:TOTAL 3 = NO CRYPTOCAP:BTC or CRYPTOCAP:ETH
Altcoins have been in a steady incline since Nov 23.
Daily
The last 2 consolidation phases lasted AROUND 6 months, depending on where you begin the consolidation phase.
Weekly
Not important going further as Crypto landscape has changed & the back data is irrelevant. However, let's be nosey & see how it looks in comparison.

Basic Attention Token, An Old FriendLet's take the market bottom as the low that was set in June 2023, what do you see?
One single signal can reveal the bottom is that true?
One single signal can tell you everything that is going on with a chart, or not.
It is more about your experience, what you know about the market and the market cycle.
The main bottom for the 2022 bear market for Basic Attention Token (BATUSDT) happened in December 2022, after it goes sideways but, let's take June 2023 as the market bottom for the purpose of this chart.
#1 on the chart is a stop-loss hunt event. It leads to a bullish wave.
#2 on the chart is the same; a reversal comes next.
The bullish signal is in because #2 is already gone. The action went below long-term support (June 2023 low) is now trading back above it. Three weeks green, bull confirmed; yes we win! Yes, I win!
So this is easy don't you agree?
What's the potential for growth?
An easy target will give us some 350%. A strong target will give us 795%. Strong is not the best. We can end up with better target specially if we consider how the market in the past behaved.
Are you with me?
What do you see?
Do you agree?
The comments are the feedback, interact with me; what do you see?
Do you agree that this chart is green and set to grow?
If you agree boost, if you disagree boost and follow.
Thanks a lot for your support.
A strong rise can take more than a year to develop. With a low in August 2024, a high can happen in August 2025. Sounds early, looks early, feels early but can happen.
Taking the lowest point since the March 2020 bottom, April 2025, an entire year of bullish action would put an All-Time High in April 2026. This sounds good but, can it be true?
Too good to be true or too hard to believe?
If the bull market can be late to start, it can also end late.
Let's hope the bullish action goes beyond 2025 into mid-2026, that would be the best. The longer it takes, more time to adapt, plan and to secure wins and profits.
Thanks you for reading.
Namaste.

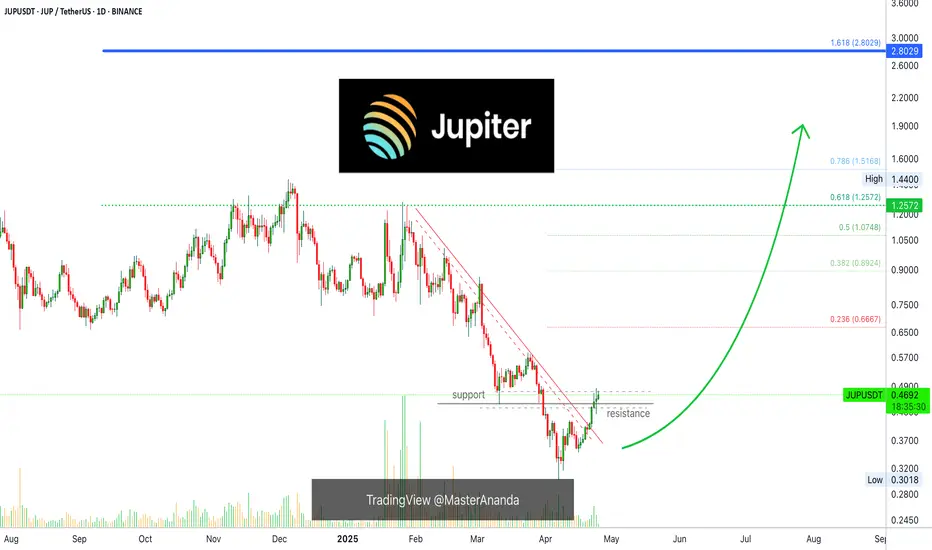
JUP Predicts The Future: Crypto Bull Market Certainty Level 100%Jupiter has been rising for 10 days straight. This hasn't happen since October 2024. The bullish bias has been revealed. This is a type of bullish consolidation. The action is back above the 11-March low. Yesterday's session wicked below, closed above. Bullish, bullish, bullish all across.
Jupiter is preparing for a nice jump.
Good evening my fellow Cryptocurrency special-genius trader, it gets better everyday.
What if... Right!
Do you agree? Ok!
The support/resistance dynamic is back in full view.
The continued growth is a very much strong revealing signal should be paid attention to. It works.
Signals like these are simple signals but can reveal everything, it works really good trust me.
Ten days straight moving up. There is a red candle in-between the rise but this does not nullify in any way the rise. It works. Trust me.
It is actually quite entertaining when you see the results.
Making the prediction is nothing, it is great when you see it work.
So these are the signals, simple signals and yet it works.
Watch! Jupiter (JUPUSDT) is set to grow. Deduction/conclusion arrived at based on the chart. 100% the chart even predicts political events. It has been proven many time now in the recent weeks. See this...
Major events will develop that will propel the market up. Political events, why? The charts are bullish and pointing up to massive growth. If any event is needed, the market creates it so soon these events will be public and the market grows.
The market grows because it is set to grow. It has already been decided it is already true. It only needs to show in the prices and charts.
It is like you apply for a job and you get it but you have to wait 3 months before your entry date. It is a done-deal, it is a secured deal it cannot be cancelled but you aren't still working but you know for certain. Something like this but with a higher level of certainty.
Say you have a family member 99 years old with terminal cancer and ready to go. The news are in, the data is in and everybody knows but the person is still alive. It is a done deal, it hasn't happened but will happen. Something like this. Things can be certain and yet not materialized. These things happen.
It can happen that it has been decided, it is known for a fact and sure the market will grow. Yet, it hasn't happened but this doesn't mean that it is questionable, some things can't be changed.
It can't be avoided and nobody wants to avoid it. It is the other way around, most of the majority want it to happen and it will happen. No other scenario is possible that's how the world works.
Tomorrow, it is day. Later, the night. Repeat over and over, nothing can avoid this reality from happening. Times change, it is the same.
One day it is the banks, the next day it is Crypto.
Namaste.
Stacks: Psychological Effects Of Trading & Technical AnalysisI was about to call it quits for now but I saw Stacks.
There was a guy here, a few years back. You know these people that are a true pain in the muladhara? That type of guy. He was always going about STXUSDT and as usual, I would give him the entry, the levels, the exit and he would always get it wrong.
Write, write, write, comment, comment; back and forth but never right, always wrong.
Jesus Christ!
Brahman please help!
I have positive impressions on my mind for this pair. That is because some time ago I shared a chart and it did great. This happens. When the prediction goes as planned, it records pleasant memories and each time I go through the pair the sanskaras are activated. It also works the other way. When a trade goes wrong, when I see the pair I tend to feel, "Yuck!"
Each time, good or bad, I have to overcome my mental attachments to be able to look a the pair fresh, with a new perspective, new!
If you get attached to the positive outcome, you are likely to jump in before the time is right.
If you get attached to the negative outcome, you are likely to miss it the next time prices are about to rise.
Both these need to be avoided if you are looking at charts or doing your own numbers. Detach completely and look at it fresh.
Today it is a new day. Whatever happened in the past, good or bad, has nothing to do with this present moment.
I am looking at Stacks, STXUSDT, what does the chart have to say?
A long-term support zone, mid-2023, has been activated.
All the action in 2024 has been removed. We are back to baseline, back to baseline is good for the bulls.
This pair allows buying at support in expectation of long-term growth.
Namaste.

Radiant Capital: The Most Amazing Market Analyst In The WorldRadiant Capital is now up more than 100% since its 7-April bottom. It is still trading at bottom prices. Huge growth, high volume still bottom.
You can appreciate what I mean right?
The chart is easy.
By mentioning that a pair is still trading at bottom prices I mean to say that there is still plenty of room left available for growth.
I don't know how to say this without sounding like a narcissistic egotistical maniac; You have to trust me and only me!
Not because I believe I am the most amazing human being this life has to offer, no!, but because I know that I am wrong and I've been wrong many times but I learned from my mistakes.
You see, when I was reading the charts, back in the days, I knew that I couldn't predict how the market was going to move and that's ok. I knew it and I admitted this to myself but I continued to study and work.
It is different now; I can see it, I can see the chart.
» It is going up.
But why only me?
Because those that are learning are in the same place that I was years ago. We develop a bias, we become absorbed by it and then we start projecting our thinking into the public and rather than right we get it wrong. It is so hard, that you see the signals and you know but still you can't change course.
Since I know how hard it is because of my experience, I cannot trust you to trust anybody else whom I don't know how they are going through all the challenges that it takes to be able to see without the dark glasses that become darker with each follow. I don't know if this message is getting across.
It takes so much soul searching to be able to read a chart, that I can tell you that it is as hard as finding the meaning of your life in this world. It can be done, but it takes a lifetime of effort.
Do what you will but make sure to buy and hold.
If you enjoy the content, good for you, I enjoy writing... Sharing is my call.
Namaste.

MultiversX, Crypto, Stock Market, The World & Soul PsychologyThis is MultiversX in the transition period, between bear and bull market.
I don't know if you already know what I've been saying and sharing about the transition years, 2023 and 2024. Here I have the linear chart which clearly shows the difference between a bull market vs a sideways market.
After the bottom in mid-2022 all the action has been mostly neutral, sideways. There has been some bullish waves but this is nothing compared to bull market type of action. The only reason why the waves from 2023 and 2024 looks big in my other charts is because of the log. scale. When you use linear, you can see the difference.
Late 2024 we saw some bullish action. Mid-2025 is nothing like 2022, 2023 or 2024, it will be like 2021. It will be crazy.
Now, as to the chart, the candles will extend and become really big like on the left side. So all projections will be invalidated and all the charts will become distorted.
All the action from 2023 and 2024 will become almost invisible and everything will trade at new All-Time Highs. This is what you need to prepare for.
Even with a 20%, 30% rise, this is nothing, we are still at the bottom. New All-Time Highs all across (allow for the usual variations of course).
Those pairs that didn't produce a very strong correction have limited potential for growth.
Those pairs that removed 100% of all gains from previous cycles can do huge growth.
All Cryptocurrency tradings pairs have huge potential in this year 2025 and possibly beyond.
Now, we are in the bull market year but this isn't all. There will be bullish waves and bearish waves all the years, endless opportunities. Another strong bull market in 2029, 2033 and so on. It goes on and on and on. For hundreds of years.
The stock market is already hundred of years old.
The English people and the Jews used to trade with papers more than a hundreds years ago. It evolved into what we have today.
The Cryptocurrency market is only starting now and is here to stay.
The markets will evolve but nothing will be lost, we will have the usual commodities, forex (currencies), metals, stocks and Crypto. And all the other stuff that I am not familiar with, the derivatives, bonds and other type of junk.
You are a human being. You have the living spirit within you and to read this you are using a technological device, your choice is Crypto. The rest is old.
Money evolves, the world evolves, we don't fight change, we adapt and grow.
The most important ability in this reality is adaption. The market has never stop changing, nothing is permanent other than your Soul.
Namaste.

DODO, Bitcoin, The Altcoins Market & Luxury BrandsI have a feeling that DODO will make a strong move soon. This is just a feeling, and somehow whenever I have this feeling the pair in question doesn't move but instead stalls... Well, it moves, they tend to move they just don't do so immediately. If one waits patiently results are awesome. Think long-term; focus on the long-term.
Forget the feeling, what is this chart saying?
True bottom.
This is good. You see those pairs we see moving, right?
As soon as they move we are tempted to buy but the movement stops, and we just want the action and we want to see our money grow but somehow chasing pairs doesn't work.
Now, look at this one!
I told you the market has so much to offer, endless opportunities.
» DODOUSDT is trading at the market bottom and yet to move. These are the ones that are good, before the breakout takes place. Buy and hold, the market takes care of the rest.
Very easy right? We buy and we wait.
If it doesn't move, that's ok.
We can diversify because some invariably will take weeks of consolidation before breaking out strong, others move after a few days while others will move after months.
A big market, lots of projects, huge variations.
You can pick the ones you like, the ones that are strong, the ones with huge growth potential, some of the less known and so on.
Diversify between category, between size, between risk, between exchanges, on and on and on.
Or you can put everything in one coin just make sure it is a project that is stable, it has been around long-term and has huge potential for growth and is still trading at the bottom. I know people don't recommend this but this also works.
Are you aware that most of the people that became rich with the stock market bought just one or two stocks? In the Internet boom and those days.
The same can be true for Crypto, if you are uncertain or don't have time, don't like to trade, you can buy just 3-5 of the top pairs and let it grow long-term. It works.
You can buy Bitcoin and hold, that is another way to make money if you have big money and don't like to enter risky trades.
Nobody is going to delist Bitcoin that's for sure. And Bitcoin has been very strong lately with the correction becoming smaller all the time. Growth potential will be huge but if your money is low, you need the smaller Altcoins.
» Bitcoin for the whales. The Altcoins for us.
The Altcoins we use to grow.
Bitcoin is for when you already have lots of money and want more.
Bitcoin is the hardest one because it is the biggest one. It has the most attention. The chart tends to be tricked so it is hard to read. Others, it is just too easy.
» DODOUSDT is trading at bottom prices and looks like will soon start to move up. This is easy. You can do this. You have my support.
Thanks a lot for your continued support.
If you enjoy the content, keep on enjoying because I will give you more.
I will give you so much that you will not be able to go through it all.
Namaste.

Ondo Finance & The Altcoins 2025-Bull MarketBullish momentum across the Altcoins market is starting to build up at a rapid pace.
To me, it seems like everything is growing but looking at the chart, it is actually true that we are still trading at bottom prices.
The main prediction for this bullish wave, cycle and phase was set for May. "Strong bullish action will start to develop in May, while the entire market will be super bullish in late May 2025." This is now becoming true.
This is true and happening but there is still plenty of time to join the ride.
It is still early. Not early in the sense that we are at a true bottom, but it is still early when considering the bullish cycle total growth potential.
Here we have ONDOUSDT (Ondo Finance) and the current rise will lead to a new All-Time High. Truly, just coming out of a major low, a higher low.
The action is moving weekly above EMA8 and EMA13 for ONDOUSDT. A descending trendline is being broken this week. The bullish action is basically starting now.
Two weeks ago, we were predicting the bottom. Now the bottom is confirmed. After the bottom, the next logical step is up. Ondo, Bitcoin, Cardano, XRP, Dogecoin, Solana, Filecoin, Notcoin. Toncoin and the rest of the Altcoins market will grow. It is already growing but from a major low point. And this is good, low means low risk if you decide to buy today. Low means high potential for rewards if you wait patiently for the full bullish wave.
» Think long-term. Focus on the long-term.
Set a waiting time of 3-6 months. First high in 2-3 months, the next one in 6 months, more or less. This will bless you with massive gains.
I am here to share what I learn. The market is good now, it is an opportunity that doesn't come often and cannot be missed.
Buy and hold. This is an easy win.
Namaste.

LINKUSDT - Time to consider Alts more seriously?Is it time to reconsider Alt coins with some more sincerity? Notoriously up and down in the past, are top Alt coins set to experience some sustained gains over the coming years? Time will tell.
For now, our team has identified an opportunity within LINKUSDT, where momentum may very well be turning to a 'bullish' rating should price be able to hold current levels - Caution as always is warranted.
We do however see elevated risk of 'bearish' momentum coming into play below the $14.00 mark.
We're inspired to bring you the latest developments across worldwide markets, helping you look in the right place, at the right time.
Thank you for reading! Stay tuned for further updates, and we look forward to being of service along your trading & investing journey...
Disclaimer: Please note all information contained within this post and all other Bullfinder-official Tradingview content is strictly for informational purposes only and is not intended to be investment advice. Please DYOR & Consult your licensed financial advisors before acting on any information contained within this post, or any other Bullfinder-official TV content.

Altcoin Market Update – April 24, 2025As of today, the TOTAL3 Index (excluding BTC & ETH) offers key insights into the altcoin market:
⸻
Technical Overview:
• 1D: -1.54% → Minor pullback
• 1W: +6.37% → Bullish momentum
• 1M: -4.14% → Mid-term correction
• 6M: +32.94% → Strong growth
#TOTAL3 remains above $790B, a critical support. Holding this level is vital for future altcoin rally targets like $1.16T and beyond.
Bullish divergence on the TOTAL3/BTC chart hints at altcoins gaining strength over BTC.
⸻
Fundamentals:
• The global crypto market cap is $3.03T
• BTC & ETH dominate, but TOTAL3 reflects altcoin potential
⸻
Summary:
Altcoin market remains optimistic, with solid long-term signals. Keep an eye on support zones and momentum indicators for your trading strategy.

Utrust Bottom Confirmed & Easy 663% Bullish TargetWhat's really great about the Altcoins right now is that the bottom is already confirmed. In this chart it comes as a rounded bottom.
UTKUSDT is trading above long-term support, the August 2024 low. The bottom formed below this level, orange line on the chart, and now that the pair recovered all that is left is for the bulls to step in, hit the gas.
Trading volume is null, almost zero until March 2025. When the lowest prices ever becoming available, there is a massive influx of capital and trading volume goes up. Everybody loves bottom prices when the market is set to grow.
So the signals are the rounded bottom, the broken downtrend and a rise in volume —drop and recovery above long-term support.
The next move is already here and is part of a broader bullish cycle, the 2025 bull market. First, there will be a rise leading to a higher high, the 663% mapped on the chart. After a strong resistance level is hit, there can be a correction. This correction will end in a higher low followed by additional growth.
This additional growth will be the final portion of the bullish impulse, the bull run.
Easy buy and hold.
Patience is key. The market will grow.
The bullish signals are fully confirmed here. This means that probabilities are high for a new bullish wave. Let's say 99% chance that prices will rise and 1% chance that there will be a bear market next.
Namaste.

FET Imminent Rise, Easy 333% To 666% Profits PotentialThis is a time sensitive publication. I will explain my thinking and support my conclusions based on TA.
How are you doing in this wonderful day?
Bitcoin is looking good and the Altcoins are looking better by the day. The Cryptocurrency market is heating up and set to grow long-term.
» Imminent, FETUSDT is preparing for a strong rise next.
Here is the thing, the downtrend has been broken. This of itself reveals and confirms a bullish bias.
Next, the 3-Feb. low resistance has been conquered and this is a major development. This is the short-term baseline. Above this level FETUSDT is ultra-bullish.
Finally, The bottom pattern is a classic, iH&S, and supported with really high volume. All these signals are strong, confirmed and good.
Artificial Superintelligence Alliance is set to grow. It is already growing, but this growth will soon speed up. Bullish momentum will manifest and a strong bullish wave will develop.
» First, a 333% target is easy followed by additional growth.
Namaste.

$HBAR Near Key Resistance: Will the Bull Flag Explode?CRYPTOCAP:HBAR is trading within a bull flag on the 2-day chart, holding just below a key resistance zone that was previously support. The 100 EMA is also acting as a dynamic barrier here.
A breakout above $0.188 with strong volume could trigger the next bullish leg.
But if resistance holds, a short-term pullback might follow.
DYOR, NFA

FETUSDI sold every single FET I had at around 2.50s in May 24 and I've not been really interested in it since then, apart from a few short term traders. It's always been a terrible asset to trade frequently, a pain to wait for it to do its thing and then everything happens in a matter of few weeks. As if it's not enough, the merger made it even less attactive.
Anyway, this chart is from December and finally it's in my buy zone. If the qFVG doesn't hold, then i think it'll go down to htf golden pocket for a 98% retrace from ATH. The team behind is relentlessly building and making partnerships, so i think its time can come again.

Symmetrical Triangle Breakout Attempt! 📈 OMXSTO:B3 - Symmetrical Triangle Breakout Attempt! 📐
✅ OMXSTO:B3 has broken out of a symmetrical triangle pattern.
🔴 Next hurdle: Needs to break and close above the red resistance zone for further upside.
🎯 Potential target: Green line level if the red resistance is broken! 🚀

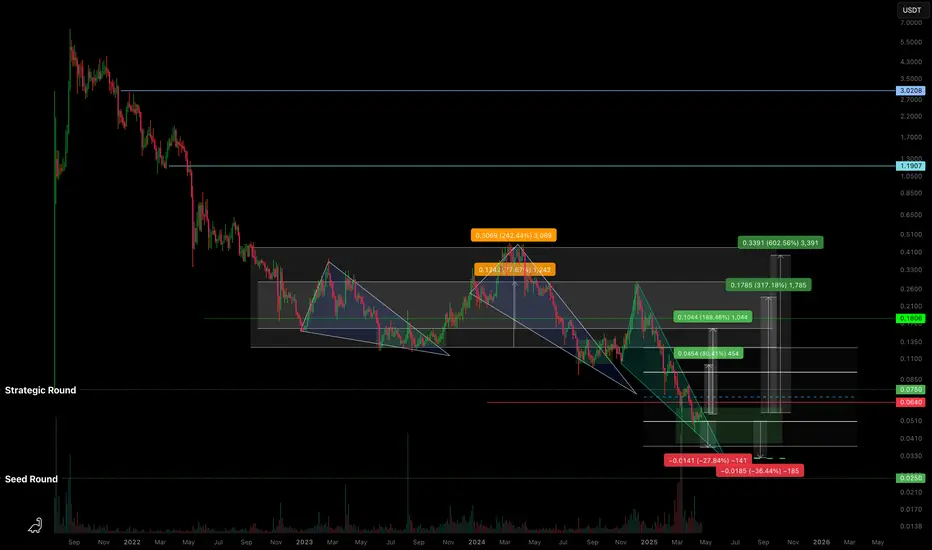
C98USDT — Descending Wedge & High R/R ZoneBased on the current structure, BINANCE:C98USDT is moving within a descending wedge , approaching zones that align with early investor positions.
🔍 What I’m seeing:
Potential drop into the range of a previous horizontal channel - marked on the chart.
We've already reached the Strategic Round level; below that is the Seed Round .
Assuming the project isn’t abandoned, it makes sense to expect investor defense in this zone.
From what I observe, there's likely accumulation happening from weak hands - at a discount .
🛡️ Approach:
As I’ve said before - you can’t treat coins like this in isolation .
They should be traded as part of a group of low-liquidity tokens , with proper risk management .
You can’t know in advance which one will “survive” without insider info from the team.
So the key is having a solid strategy and managing your portfolio and risk wisely .
📈 Targets:
Potential breakout targets from the wedge are marked on the chart.
If the market remains weak, I’ve noted a lower zone where consolidation might occur (sideways chop within a horizontal channel).
💭 Opinion:
The market is “paused” and waiting for a catalyst. You can’t rush it.
But zones like the current one on BINANCE:C98USDT seem attractive in terms of risk/reward .
The goal isn’t to guess - it’s to follow a pre-built strategy and stay focused .
📌 As always, this is not financial advice. Just my personal take and observations on the structure.
$SUI has nearly completed its correction — get ready!🚀 CRYPTOCAP:SUI has nearly completed its correction — get ready for a potential breakout in 4 weeks!
After an explosive push upward, a massive bearish divergence has formed — but the next leg could be just around the corner.
📊 Key signals:
MACD (1W) is about to flip bullish — a crossover expected in ~4 weeks.
RSI is near its previous bottom, signaling potential for a rebound.
Volume is matching levels seen during the last major rally.
📅 All signs point to May 19, 2025.
This could be the turning point.
CRYPTOCAP:SUI is in my buy zone at the moment (the green rectangle).
I project a new all time high.
📌 Stay sharp. Be prepared.
🧠 DYOR (Do Your Own Research)
#SUI #Altcoins #CryptoSignals #MACD #RSI #CryptoUpdate #May2025 #SUIUSDT #BullishSetup #DYOR

Altseason? Not yet — but the real move is coming... soon.As shown in the chart, the weekly MACD reset isn’t complete yet. A similar setup happened in September 2024 — we got a fake pump that fooled many, while the real breakout started in December 2024.
🔍 Why does this happen?
Impatient whales — often close to the “crypto president” — start buying early. Using influencers and media hype, they push the "New ATH" narrative and lure in retail. But this early FOMO creates a massive bearish divergence — the RSI hasn’t reset yet, and the market isn't ready.
📉 The result?
A painful 6-month correction that punishes impatience. The market always reverts to math — and math doesn’t lie.
You can’t fake momentum forever — no matter how much money you throw at it.
💡 My forecast remains unchanged:
Once the MACD weekly crossover happens, the real pump begins — no ETF, no Saylor needed. The market moves on its own, as it always has.
📊 Check the chart. Read the signals. Trust the data.
#Bitcoin #BTC #CryptoTrading #CryptoWhales #MACD #TechnicalAnalysis #BearishDivergence #Altseason #DYOR

Algorand NLP & Higher High & 619% Profits PotentialThis is a very nice chart. Algorand is solid strong on the weekly timeframe (long-term).
There are two main signals; Long-term growth in the form of a rising channel, higher highs and higher lows. Short-term bullish based on a recovery.
Notice the "magic blue line" I drew on the chart. This is a bottom signal. You can draw an inverted head and shoulder here or a v shaped bottom. This week strong move seals the deal. A massive higher low compared to early August 2024.
Ok. How are you doing today my friend in the law?
I hope you are having a wonderful day.
You see...
Hear me out; listen!
Can you feel me?
Do you understand?
Do you grasp what I am trying to share with you?
Can you see what I am doing?
These are all different representational systems, people use difference senses to understand reality. Some are primarily visual, others auditory, kinesthetic, digital, etc.
So, you are likely the feeling type, then, can you grasp what I am trying to say? Are we on the same wavelength? Does it resonate with you?
Yes? Then Algorand is bullish and going up. Why?
Because the chart says so. Because that is exactly what is doing and that is exactly what it will continue to do long-term.
The main low happened in August 2023 and we have the higher lows without question, a higher high comes next.
For your convenience, I mapped this chart with the main target for this bullish wave. It can go higher.
Namaste.

Filecoin Update: Yes, Bullish Confirmed!I thought I should look into Filecoin and guess what, I already did so 10 days ago. Here is an update.
Two weeks ago we got the bottom candle, 7-April, a hammer at the end of a down-move. A clear reversal signal.
This week is the third week green. Classic textbook confirmation of the hammer reversal. After the signal comes in, two weekly session moving positive will confirm this signal. And that's exactly what we have on the chart.
This week is green but notice the chart. Just look at it. Look at the current action and just how low prices are. The action is happening below the December 2022 low based on candle close. This means that we are still within bottom prices, the best possible entry prices ever; an incredibly opportunity; an amazing buy-zone.
Good news and bad news.
Good news is that prices are still low.
Bad news is that prices won't remain low for much longer, the market will grow soon and once it starts growing there is no second chance. The second chance is now, the first one was the 7-April low.
This is for you. What will you do?
Some pairs are already moving and I hate to buy when prices are higher, I love catching the bottom, it leaves no room for stress. When we buy when the action is happening, there tends to be a stop and as soon as prices drop, we become anxious because we don't know what will happen next.
When we get the bottom, it doesn't matter what happens we are always in the green, in this way, trading becomes fun, profitable and easy. This is an easy win.
» 2,400% potential is strong but still a conservative target. Cryptocurrency is set for something that cannot be described in simple words.
Total growth can amount to 1,000%, or even 500% and still, this would be amazing considering that other opportunities can result in devaluation rather than growth.
The entire market is set to grow on average between 10-30X. If the entire market grows on average between 5-10X, we will take it and be happy and grateful, as long as we win, we can continue to trade.
The market will not grow 5-10X, this is the growth that we experienced in the transition year, it will go much, much higher.
Thanks a lot for your continued support.
Namaste.

Kaspa Bullish Signal Revealed —Focus On The Long-TermKaspa just broke decisively above EMA55 on the daily timeframe, opening up two major targets for this current advance and confirming at least 3 months of growth for this bullish wave and period.
Now, every time a strong resistance level is hit, there is a retrace.
When a strong move happens, there is a pause.
The market never moves up, up, up unless it is in a bull run phase. The market also never moves straight down; the market moves in waves.
So it is natural to see a pause after a strong bullish breakout. After several days of pause, we get additional growth.
Look at the bigger picture, consider this; From the 7-April low to yesterday's high Kaspa is up by 89%. You see? Nice growth and this growth will continue long-term, but long-term.
You can be certain that the market will produce higher highs and higher lows, but this does not remove the possibility of flash crashes and shakeouts, in fact, these type of moves are part of normal market behavior, not the exception but the norm.
When people see strong bullish action they tend to rush, jump and buy-in. They don't buy when prices are low but when the breakout happens out of excitement, an impulse.
What happens is that the market stops and go bland for a few days. This impulse dies out and these people close the trade at lower prices, and then the market resumes growing.
You can do good; you simply wait/hold and it will grow.
You should buy when I publish my charts. If you bought out of excitement, focus on the long-term. FOCUS ON THE LONG-TERM.
Thanks a lot for your continued support.
Namaste.
