The end of bear market? SPX is pointing to a bull market trend.The analysis provided suggests that the SPY (SPDR S&P 500 ETF Trust) has broken out of a falling wedge pattern that began in January 2022 and is now on the verge of breaking out of an ascending triangle pattern. The falling wedge pattern is typically a bullish continuation pattern, while the ascending triangle is also a bullish pattern that signifies a potential continuation of an upward price trend.
Additionally, the analysis notes that triangle patterns are often observed following strong and extended price trends, as buyers and sellers test the new price of a stock and become more or less aggressive over time. Ascending triangles are considered to be bullish signals, indicating a potential continuation of the upward price trend, while descending triangles are considered to be bearish signals, indicating a potential reversal of the upward price trend.
Based on the analysis provided, the expectation is that the SPY will continue its bullish trend and break out of the ascending triangle pattern. However, the analysis also mentions the possibility of a seasonal push down in September/October, which may cause a temporary dip in the price of the SPY. Nonetheless, the analysis suggests that this dip will not push the SPY back into bear territory.
To further expand on this analysis, it's important to consider other technical indicators and market factors that could impact the SPY's price movement. For example, the Relative Strength Index (RSI) and Moving Average Convergence Divergence (MACD) are popular technical indicators that can help confirm bullish or bearish trends and potential price reversals. Additionally, market news and events, such as economic data releases, corporate earnings reports, and geopolitical tensions, can also impact the SPY's price movement.
Furthermore, it's important to note that technical analysis is not infallible, and there are always risks and uncertainties associated with investing in the stock market. It's essential to conduct thorough research and analysis, diversify your portfolio, and consult with a financial advisor before making any investment decisions.
Ascending Triangle

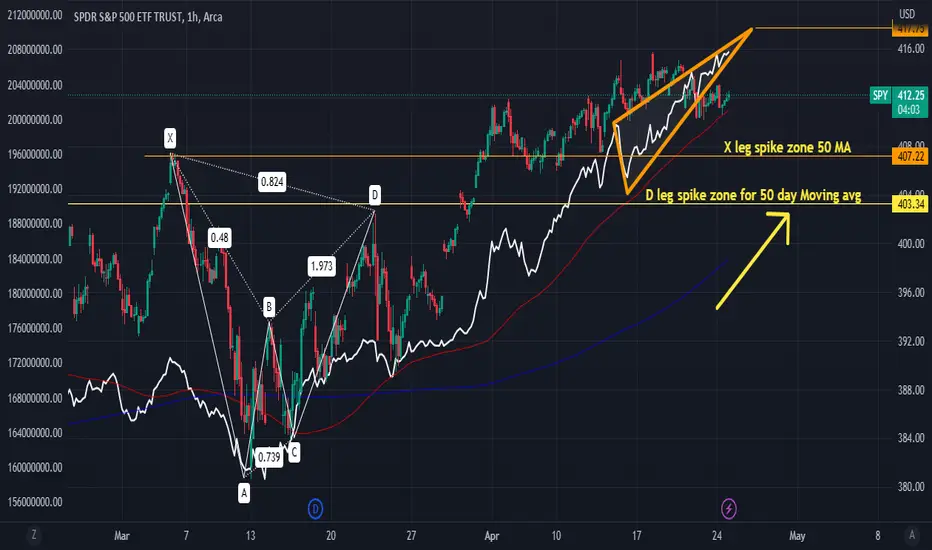
AD Ascending Triangle 1hr Chart target $417The 50 Day Moving avg is looking to cross both D leg, and X leg of the Bearish Cypher pattern. These are past resistances levels, once both these levels are crossed over. I fully anticipate price action to go higher. In Fact the AD has an ascending Triangle Pattern to 417 on the 1hr time frame. For short term traders and swing traders this is a bullish set up
TRX - Created New Ascending TriangleThis is my first idea on trading view. TRX is on an ascending path. Is this uptrend of the ascending triangle will be continued in the coming days?
What's your worthy opinion on it?

AUDCHF - NEW BREAKOUT !HELLO TRADERS !
On The Daily Time Frame The AUDCHF Price Reached a Support Level !
Currently, The Support Level is Broken and becomes a New Resistance Level 🔥
The Price Formed a Descending Triangle Pattern !
so, I Expect a Bearish Move 📉
i'm waiting for a retest...
-----------
TARGET: 0.58800🎯
___________
if you agreed with this IDEA, please leave a LIKE, SUBSCRIBE or COMMENT!

9.1-2 INJ BULLISH IDEA (ASCENDING TRIANGLE)Potential Bullish Entry
Dow Theory In Place - Higher High and Higher Low Expected in Place
Formation of ASCENDING TRIANGLE coupled with bullish divergence.
Entry, SL & TP Levels are defined.

GBPCAD..daily view..-GBPCAD is runing in daily ascending triangle with overall weekly down trend.
-Strong resistance level ahead .
-Waiting for the reaction with that level to decide which team with take the upper hand...be safe...

W9-28 ARBUSDT (BULLISH IDEA)Potential Bullish Entry
Dow Theory In Place - Higher High and Higher Low Expected in Place
Formation of ASCENDING TRIANGLE coupled with bullish divergence.
Entry, SL & TP Levels are defined.

Waiting for Ascending Triangle BreakoutIf price goes below the red trendline then close spot and future long position. If price stays above red trendline then wait for green trend line breakout, then first target will be 0.050

LINK/USDT BREAKOUT! LONG SCALP SETUP!!Hello everyone, if you like the idea, do not forget to support it with a like and follow.
Welcome to this LINK/USDT trade setup.
LINK looks good here. Breaks out from the ascending triangle in 4hr time frame. Expecting a 15-20% pump from here. Long some here and add more in dips.
Targets:- $8.26/$8.96
SL:- $7.40
Lev:- 5x-10x
If you like this idea then do support it with like and follow.
Thank You!

DYDX USDT Ascending Triangle Break out in 1 HR TF.BINANCE:DYDXUSDT DYDX USDT Ascending Triangle Break out in 1 HR TF According to my TA Analysis. DO your own Research taking any financial Decision.

Breakout towards the upsideAn ascending triangle breakout is excellent for breakout traders and trend traders looking for buying opportunity at 1.0959 for a buying opportunity.
Alternatively, the trendline work just fine.

ZENUSDT LONG IDEAZENUSDT has broken its ascending triangle and can move upwards.
tp1:12.37
tp2:12.83
tp3:14.05
tp4:14.86
sl:10.24


Ascending Triangle in ProcessBelow the Red trendline is Risk. If price came back above the Red trendline then high chance of this Ascending Triangle breakout and its Final target will be 0.60

joe Ascending triangle Final target 1++Ascending triangle will breakout again and first target is in range 0.77-0.83 . If this range breaks then target is 1++. If price breaks down the Red line then there are chances that price will not pump soon.

DOT's chance to reach 7.5$🌟DOT has created a bullish pattern which is an ascending triangle. The pattern will increase the price as much as the measured price movement (AB=CD). if this expected movement happens, the price shall end up near 7.5$!
_ _ _ _ _ _ _ _ _ _ _ _ _ _ _ _ _ _ _ _ _ _ _ _ _ _ _ _ _ _ _ _ _
🌍Thank you for seeing idea .
Have a nice day and Good luck.

Ascending Triangle On ETH (BULLISH!!)
Hello guys ,Today i saw a low risk opportunity on ETH/USDT.
the price is on the bottom of the ascending triangle and if it doesn't break it you can do this scenario.
open your position after the price turn back.(wait for green candle,don't open your position fast !)
first target is about 1995.(it's safe to close your position)
but if it's going to continue the scenario , you can close your order on 2030.
supertrend is giving a buy signal too.
it's just an idea , always do your research and analysis.
don't forget to follow and boost this idea :) thank you.

Moreno technical analysis. The huge ascending triangle.There is very slowly forming giant ascending triangle which could potentially peak during2025-2026.
Example of an ascending triangle. Notice the flat iupper line and the rising lower line. This is a generally bullish line. (Figure 6.1b "Technical Analysis of the Financial Markets" Page 131)
The measurement. The breakout (C) should see a sharp increase in volume, That upper resistance line should act as as support on subsequent dips after the breakout. The minimum price objective is obtained by measuring the height of the triangle (AB) and projecting that distance upward from the breakout point at C. (Figure 6.3a "Technical Analysis of the Financial Markets" Page 136)

Bitcoin - New CME GAP! + All unfilled GAPS (cheat)
Bitcoin has created a new CME GAP between 28215 - 28265. It's also the POC of the consolidation structure, so it could be a good short-term trade when the price makes a pullback.
First, let me explain some important facts about CME gaps. CME Futures on Bitcoin started in December 2017. We had dozens of unfilled gaps from 2017 - 2023, and all of them have been filled. So the statistical probability of filling these gaps on Bitcoin is 100%. When the CME futures started, the huge bear market of 2017–2018 started, and Bitcoin crashed by 84%.
Let me remind you (if you forget it), that the major CME GAP between 20330 - 21110 is completely uncovered, and the question is when we will cover it. It can take a few weeks or a few months, or maybe later. Time is not important.
In total, we have 3 unfilled GAPs on the daily chart. One is above the current price between 34450 - 35180. Two are below the current price, between 28215 - 28265 and 20330 - 21110.
On the left side of the chart, you can see fair value GAPS on the spot market. These gaps tend to be filled if they are massive, and these gaps are extremely huge. In my opinion, we are going to go down sooner or later, fill them, and take liquidity below 15.5k. It could happen in Q4-2023 or Q1-2024 due to my calculations.
If you find this analysis informative, hit like/boost right now! Appreciate it.
This analysis is not a trade setup; there is no stop-loss, entry point, profit target, expected duration of the trade, risk-to-reward ratio, or timing. I post trade setups privately.
Thank you for reading!

EUR-AUDThe EUR-AUD pair currently traded at 1.63700 and resistance is at 1.63900 to 1.6400. And support level mentioned in the chart. The ascending triangle has been made in this chart also.

"LABS" Every Timeframe is ridiculously a setup for a perfect sto"LABS" Every Timeframe is ridiculously a setup for a perfect storm.. Literally we have every pattern in this coin, contained in from all timeframes concluded.
Cup and handle.. A beauty,,, can be seen on 4hour to daily,,,,.. zooming out to weekly, a perfect inverse head and shouders,,,(ascending triangle) (bullflags on 1 minutes) and a perfect descending channel seen on weekly with ease.
KUCOIN:LABSUSDT

Ascending triangle XAUUSD According to the current market sitution 4h,daily and weekly charts show gold is bullish so more chances are that it breaks the triangle from the above side
Best buying position for gold is 1955 to 62
And Target is 1987 and 94
At current scenario Gold is forming asending triangle ,when market makes Bulish asending triangle it breaks upward and when market makes bearish descending Triangle it breaks downward.
