Ethereum in an Ascending Triangle. It's Time for a Pump?It seems that sellers are exhausted (for now), and cryptocurrencies are showing signs of recovery. The leading altcoin, Ethereum, is in an ascending triangle on lower time frames. It is a bullish pattern that tends to break above the horizontal boundary.
If that happens, we can buy ETHUSD.
The target should be equal to the triangle's height.
Stop-loss, below the triangle's horizontal line, with some space so the trade can breathe.
Follow me for more Crypto and FX trading ideas.
Ascending Triangle

EURAUD, The Triangle Pattern CompletedEURAUD has completed the ascending triangle this morning. We can long EUR against AUD, with a target of 1.62. The target is determined based on the triangle's height. We measure the height of a pattern and use that distance as our target.
Stop-loss should be placed below today's low. That gives us a great R:R.
Follow me for more trading ideas.

Nissan Long IdeaNissan has just broken out of this ascending triangle pattern. Good risk to reward set up with stop around 535 and target around 645.

SHORT ON EUR/USDBreak of uptrend line of a ascending triangle and supply zone.
Dollar is also strong right now.
ENTRY - 1.05210
SL -1.06248 103 PIPS
TP- 1.03633 157 PIPS+

TCDA - Ascending triangle breakout. Retest breakout levelHigh volume throwback to the breakout likely was a shakeout move.
Risk: 90 bps
You don't need to know what's going to happen next to make money ~Mark Douglas
Anything can happen ~Mark Douglas

13k Q4 2022; Sept 2024 160k. analysis since day 1 of BTCThis is a very detailed analysis by Dia, I won't post till Q4 2022.
- I see believe in 4 year cycles, average bull cycle is 800 days, and average bear market is 400 days, the other 200 I called ''neutral'' days where market switches between them.
- Macro economics are very bearish , including stocks, more downside is definitely expected to keep inflation under control, SP500 is big bull channel ready to break down
- TOTAL crypto cap is 914 b, next support is at 755 and 455 respectively, current crypto cap will not hold and 50% correction is definitely on the table (ascending wedge )
- The entire 30 to 60k symmetrical triangle structure has broken down, I notice every time a support line of previous bull run is broken, the last one will become support (the dotted lines). This is a very ugly break down and if people say bitcoin is DEAD and they show this chart, they can be right for the first time in history.
- the 30k and 60k triangle can be manipulated into a falling wedge , that coinicides with Q4 of every 4th year of bull run being the bottom and support line from previous bull run touching there exactly to the point
-looking at rsi we still actually just entered bear market territory (monthly stoch rsi under 10), bear market is around 40 to 50% finished. Still have a year or so to go roughly
CURRENT STRATEGY
DO NOT TRY TO TRADE IT (I shorted FLM and UNFI and lost 76% of my portfolio in 1 month)! Between now and end of 2022, DCA in coins, tokens that you believe in and look strong. THIS IS THE OPPORTUNITY OF YOUR LIFE!

4HR Ascending Triangle on CardanoWe have an Ascending Triangle visible on the 4 Hour Timeframe for ADA that could be enough to take us back up near 60 cents atleast.

Break?Ascending triangle formation and I expect a breakout this coming week. Targeting he upper zone!

#ETH meeting resistance- Scalp EntriesETH has to make a decision here. ( Purple box has been serving as resistance over the last 12 days )
Bullish Scenario :
A break out to the upside with a close above 1266- could signal we bottomed. Making 1400 area our next big obstacle.
Bearish Scenario:
1255 area is strong resistance for now. Could break out of ascending triangle and re test the 1067 area ( .5 Fib) - A close below 1067 could signal another trip to the 3 Digit ETH levels for a retest in the 916 area.
What ae you thoughts on ETH?
GL out there.

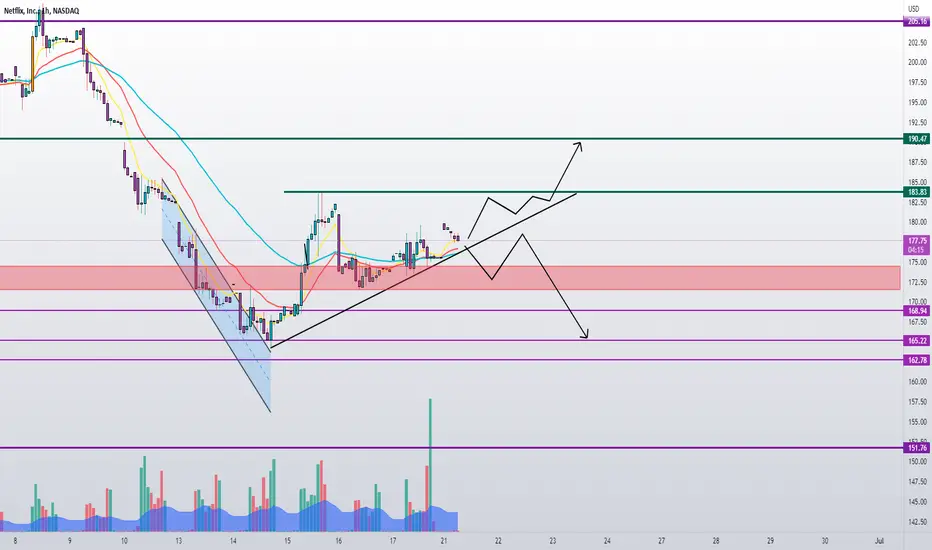
NFLX Ascending triangle1HR timeframe seems like price is forming an ascending triangle.
I will watch to see which direction it will break towards
Vodafone - Ascending triangle - what's next?The ascending triangle started to form at the start of the pandemic restrictions. Not fully formed yet, it is in a downtrend and therefore it's possible it will head lower. Wait and see. Fundamental factors are: cost of living, recession, a takeover/bid, inflation, interest rates (cost of capital) -
Lots to think about.

Kadena: Ascending Triangle Visible ont the 1 Hour We have an Ascending triangle Visible ont the 1 Hour and are currently holding above the Moving Averages so long as we can hold this level and shift out soon we could at a minimum see a rise to the 800 Hour EMA.

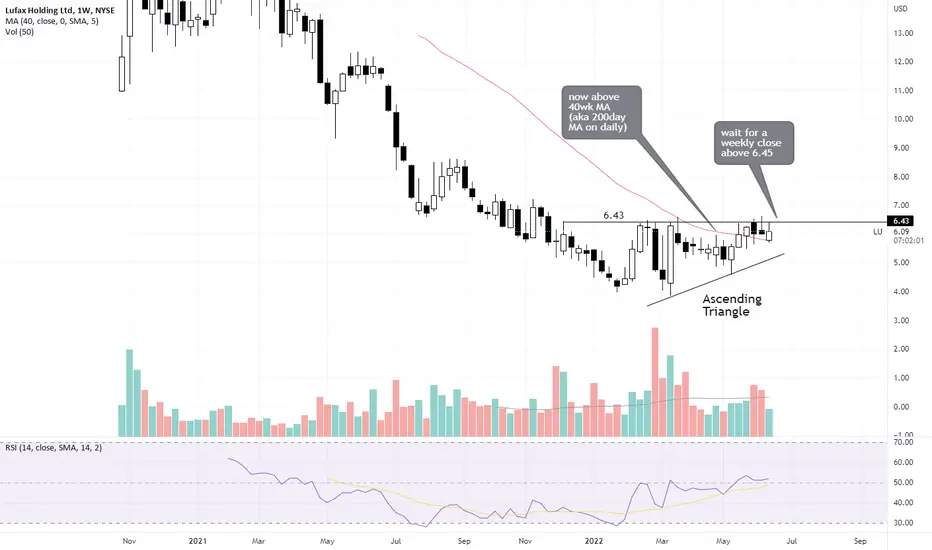
LU - Ascending Triangle Bullish argument for LU:
1. higher lows (over the past 3 mths) with every dip leading to the formation of an Ascending Triangle.
2. now above 200 days moving average
Waiting to see if a close above 6.43 neckline would materialise in the coming weeks, preferably on good volume.
p/s the odds of breaking towards the horizontal side is higher for right angle triangles.
ie upside for an ascending triangle and to the downside for a descending triangle.
Disclaimer: Just my 2 cents and not a trade advice. Kindly do your own due diligence and trade according to your own risk tolerance and don't forget that money management is important! Take care and Good Luck!
EURGBP Ascending Triangle This pair is forming a triangle patter with much possibility to breakout to higher resistance price level.

BTC is going to Reach 35k+ExplanationBTC has Created a New Ascending Triangle which is a Good bullish Sign and We can Determine That the Price will be Bullish Soon! No Strong Break out Has Happened yet So We can Not Say for That the Price is gonna Increase For Sure Right now But It will Happen Soon! If we Consider The AB=CD Which is the Expected Movement From the Ascending Triangle We can Come To The Conclusion That the Price will Reach 35k Soon!
-BTC is in an Ascending Triangle
-Break out Has NOT happened
-(AB=CD) is the Expected Movement
-35k is the Target!
_ _ _ _ _ _ _ _ _ _ _ _ _ _ _ _ _ _ _ _ _ _ _ _ _ _ _ _ _ _ _ _ _
Thank you for seeing idea .
Have a nice day and Good luck

Short on DVNLooking for energy to cool off for a minute here. Macro looking bearish (dependent on CPI print) and running a little hot right now. I would expect energy to continue running mid-term, but looking for a pullback on the 1.618 from the covid lows.

Oil and Gas at it again $FTXNThis ETF is the one a chose to play the new trend. I made a good profit from it and today is signaling another pivot buy. With today's breakout out of an ascending triangle the price may be posed to continue its trend up.
I'd be very cautios and start with small positions or go with a full position but taking profits quicker.
Remember to always use STOPS!

RBLX - Ascending Triangle in DowntrendWeak pattern here but just noting the development of an ascending triangle after a significant downtrend. Given the context this pattern could be considered a (bearish) continuation pattern. If it turns out to be bullish then there's some resistance not far above.

#XEC have potential profit up to 100%Here is the reasons to buy XEC:
1. 4 days later will be full moon phase which is human psychology going to more confident in trading.
2. There are ascending triangle bullish pattern in 4hours timeframe.
3. Has been confirmed in multiple strategy like RSI, TSI, EMA 5, EMA 9, etc. Look the green checklist at right bottom.
4. Candle postion in the middle area of swing trend line Higher High and Higher Low which mean XEC on the way to bullish.
5. If you set timeframe 4hour, the candle position is above of MA200.
The reasons to not buy XEC:
1. Candle still below of MA50 in daily timeframe.
2. BTC still sideways.
Signal :
Buy: 0.000053
SL: 0.000048
Conclusion:
If you have a plan for trading in short term, this is the good time for you to buy XEC.
The risk is around -9.45% but the reward is 90% up to 100%.
Note:
- This idea is for trading in Spot market.
- I'm not your financial advisor, so I don't have responsible about your money.

CADCHF LONG!I see a perfect ascending triangle and a huge support at 0.78
You might want to consider this one

Bitcoin Delivers Hopium as the Ascending Wedge ContinuesMy continued Bitcoin analysis gives me great indication that the Digital King has yet to reach its regional bottom.
$32.7-8 is expected to be a very key range as for resistance.
Based on Elliott Wave Theory and Fibonacci sequencing, $22K-$25K are also expected to be key levels of support.
All indications are based on the science of price action! No other indications are used primary however, RSI levels are often considered secondarily.

BA inside a rectangleA couple of things to track on BA
1- Ascending triangle on the hourly chart with resistance at 141.40. This level has rejected many times now. Above that we could start moving higher towards 143.40
2- There is a rectangle that has formed while consolidating sideways with the same resistance level 141.40
I will be watching this name to see in which direction it will resume.

US30 ANALYSIS ON DAILY TIME FRAMEThe combination of Double Top/ Ascending Triangle is one of the best to spot, especially on US30.
So if we see a candle closing above the resistance we can take a buy and go for an ascending triangle.
And if the price breaks the trendline and and the potential neckline we go for a sell.
Simple and effective 👍💪
Comment your thoughts and follow for more ⚡
