Triangle Pattern DefenseAscending Triangle Pattern Defense.
Helps you get out of up trend consolidation.
This demonstrates this defense LIVE!
Ascending Triangle

AUDCAD Ascending Triangle Possible FormationThis pair is very probable to go this pattern and explore again highs we can take opportunity from. Be aware!

XRP will breakout soonXRP made a big symmetrical triangle and now it is trying a breakout using ascending triangle.
If we see huge volume breakout with perfect retest.
XRP will give 80-130% in profits.

USDJPY: King Dollar back?!USDJPY
Intraday - We look to Buy at 127.62 (stop at 127.11)
Broken out of the triangle formation to the upside. A mild correction has been posted from yesterdays high, this is seen as a retest of the breakout level. Daily signals for sentiment are at overbought extremes. Neckline support is 127.60. Dip buying offers good risk/reward.
Our profit targets will be 128.85 and 129.00
Resistance: 128.85 / 131.30 / 135.00
Support: 127.60 / 126.60 / 124.10
Please be advised that the information presented on TradingView is provided to Vantage (‘Vantage Global Limited’, ‘we’) by a third-party provider (‘Signal Centre’) . Please be reminded that you are solely responsible for the trading decisions on your account. There is a very high degree of risk involved in trading. Any information and/or content is intended entirely for research, educational and informational purposes only and does not constitute investment or consultation advice or investment strategy. The information is not tailored to the investment needs of any specific person and therefore does not involve a consideration of any of the investment objectives, financial situation or needs of any viewer that may receive it. Kindly also note that past performance is not a reliable indicator of future results. Actual results may differ materially from those anticipated in forward-looking or past performance statements. We assume no liability as to the accuracy or completeness of any of the information and/or content provided herein and the Company cannot be held responsible for any omission, mistake nor for any loss or damage including without limitation to any loss of profit which may arise from reliance on any information supplied by Signal Centre.

VET can Increase Pretty Soon!VET is in an Ascending Triangle which is a Good Bullish Sign and Means The Price is gonna Increase Pretty Soon! No Break out Has Happened and We Shall Be Aware of the fact that When the Break out Happens the price will Increase as much as the Measured Price (AB=CD) . Well When The Expected Movement Happens, the Price will reach around 0.037$!
-VET is in an Ascending Triangle
-No Break out yet
-Price is gonna Increase as much as the Measured Price Movement (AB=CD)
-Target is around 0.037$
_ _ _ _ _ _ _ _ _ _ _ _ _ _ _ _ _ _ _ _ _ _ _ _ _ _ _ _ _ _ _ _ _
Thank you for seeing idea .
Have a nice day and Good luck

TRX on the way to 0.12$TRON is in an ascending Triangle which is a Pretty Good and Obvious Bullish Sign! The Price will Be Starting To Pump Heavily once The Break out Happens! The Expected Price for Break out is around 0.088$ and It would Reach 0.12$ (The Price will Increase as much as the Measured Price Movement AB=CD)
-TRX is in an Ascending Triangle
-No Break out yet
-Break out will Happen 0.088$
-Price will reach 0.12$
-(AB=CD)
_ _ _ _ _ _ _ _ _ _ _ _ _ _ _ _ _ _ _ _ _ _ _ _ _ _ _ _ _ _ _ _ _
Thank you for seeing idea .
Have a nice day and Good luck

EURJPY to 140!Hey Traders,
As you can see, an ascending triangle on EURJPY has formed. The Relative Strength Index also shows the market is maintaining its momentum. Easy pips to be made!
Safe Trading,
-Pulkanator

FTMUSDT is testing the supportThe price is creating an ascending channel on the 4h timeframe after a bounce on 0.22 Monthly support.
The price got a rejection from the daily trendline (dynamic resistance).
How to approach it?
IF the price is going to lose the support, According to Plancton's strategy , we can set a nice order
–––––
Keep in mind.
🟣 Purple structure -> Monthly structure.
🔴 Red structure -> Weekly structure.
🔵 Blue structure -> Daily structure.
🟡 Yellow structure -> 4h structure.
–––––
Follow the Shrimp 🦐

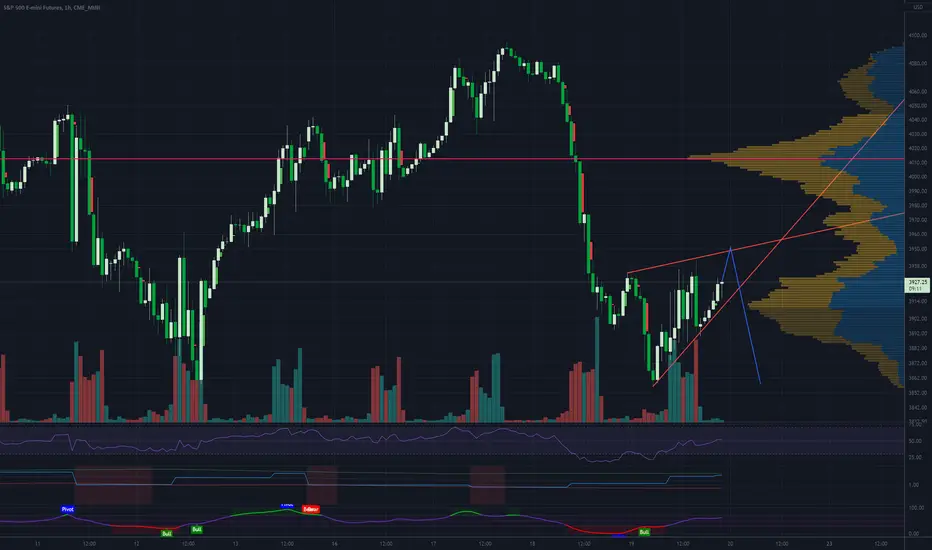
BTC LONG POSITION 15' CHARTIn this 15' chart we are looking at the possibility of a long position due to the ascending triangle pattern that has been created. Only thing to take in mind is the volume factor that might change the rule of the game but we are just making assumptions and creating possible chart strategy in case of breakout of the resistance line.

WOO/USDT LONG SCALP SETUP!Hello everyone, if you like the idea, do not forget to support with a like and follow.
Welcome to this WOO/USDT TRADE setup. WOO looks bullish here.
WOO is breaking out from the ascending triangle pattern. Expecting a 40-50% bullish move from here. Buy some now and add more in the dip.
Entry range:- $0.215-$0.22
Target1:- $0.242
Target2:- $0.264
Target3:- $0.288
Target4:- $0.314
SL:- $0.202
Use low leverage 4x-6x
If you like this idea then do support it with like and follow.
Also, share your views in the comment section.
Thank You!

MTL/USDT LONG SETUP!!Hello everyone, if you like the idea, do not forget to support with a like and follow.
Welcome to this MTL/USDT TRADE setup. MTL looks bullish here.
MTL is breaking out from the ascending triangle pattern. Expecting a 50-60% bullish move from here. Buy some now and add more in the dip.
Entry range:- $1.48-$1.52
Target1:- $1.72
Target2:- $1.94
Target3:- $2.16
Target4:- $2.38
SL:- $1.40
Use low leverage 4x-6x
If you like this idea then do support it with like and follow.
Also, share your views in the comment section.
Thank You!

Btc wants to revisit 26k levelBtc just printed an ascending triangle pattern in 4 time frame witch is a bullish pattern. The small problem is the point that i broke the lower trend line and is currently retesting it.
According to my strategy this is a strong bearish sign and it might be a good idea to enter a short trade now at the level 30k-30.5k but this is a little bit risky level to entry.
The safest entry is in the confirmation when if the possibility arrives the price crosses down the pullback level.
I will enter a trade now 30000-30500 with stop loss at 30960 and take profits 28600, 27000 and 26000. At 29200 i will set the stop to entry.
If you enter the trade and it goes well i recommend you to use the new Binance futures feature called trailing stop and set the activation price at 26000 with reduce only using a callback rate of 3% to catch all the possible downward move.
Only pure technical analysis and my opinion not a financial advice, do always your own research and never risk more than 1% of your account in a single trade.
Regards and happy trading.

ES 1 Hour Ascending Triangle - BearishES/SPX in an ascending triangle. Going down Friday. Other indexes are in a similar pattern.
Ethereum ETHUSDT - Elliott Wave on the weekly! + ABC completed- This is the weekly chart for ETH - analysis since the big covid crash in 2020.
- Wave 1 and wave 3 created ascending channels during their move, so we should count it as waves 1 and 3.
- It means that we should expect a last 5th big wave to the upside!
- 0.618 FIB extension (wave 3 -> wave 4) is around 21 000 USDT.
- ABC correction can be completed (wave 4) and we are ready for a next pump!
- If we take a look at the MACD indicator, we can spot a huge bullish divergence.
- Currently the market structure looks like a bullish rectangle (red one), which is a very bullish continuation pattern.

Trade Setup In Binance Coin / Usdt"Trade Setup in Binance Coin / Usdt"
Ascending Triangle type pattern in Binance Coin / Usdt on 1hr Timeframe.
1.Buy Setup:- Entry-Strong Candle Breakout Above 314 level.
Stoploss- Below 290.
Targets- 330, 360, 380.
(For Risk Averse)Sell Setup:- Entry- Strong Candle Breakout Below 290.
Stoploss- Above 310.
Targets- 270, 240, 210.
(For Risk Taker))Sell Setup:- Entry- Strong Candle Breakout Below 297.
Stoploss- Above 310.
Targets- 270, 240, 210.
(Pattern Formation Date- 12 May 2022 to 17 May 2022.)
*Do your own research and Consult your financial adviser before taking trades.

USDCAD SELL!USDCAD has been trading within the confines of a triangle pattern since Jun last year and it looks like the pair is not yet ready to break to either sides!
At this point , i expect the pair to test the Resistance zone of 1.29000 and then move down all the way to 1.26800. Hence , my final Target for the pair is 1.26800 !!

ALGOUSDT movement within the trianglewe expect further movement within the boundaries of the emerging triangle

EOS USDT 1HourEOS Looking Like ASSCENDING Triangle Pattern. If its breakout with good volume u can trade long or short.

A short return | BTC Bitcoin TriangleBitcoin is in the ascending triangle pattern and will see a price of 32,000 after breakout and stabilization.

Basic pattern charting shows clear path to $1M bitcoin
Time and time again I have been told to master the basics and when it comes to trading nothing is more basic than charting triangles. Likewise, few things are more basic than cloning a trendline used to measure the height or depth of a move and dragging it over to the breakout point of whatever structure you are looking at.
Just a tiny bit more advanced for targeting is using Fibonacci extensions to help with targeting with flagpoles. As the chart shows merely cloning the height of the flagpole from the C19 low to the flagpole high to an approximate break out point, which since we are looking at an ascending triangle remains the height of the flagpole itself, we get a target just over $1M. If the flagpole should be taken from the low of the ascending triangle that target would be the 1 line at about $485,000. I would not be surprised to see a major pull back at the 1 line and an even larger stall at the flagpole target.
A zoom in of the triangles shows plenty of internal structure for all trading types. Break out traders could look to long the breakout of the triangle, support and resistance traders can likewise long and short as they see fit.
Basic bullish trades could include
Longing the support of the symmetrical triangle and taking profit at either the symmetrical triangle resistance or ascending triangle resistance
Longing the breakout of either the symmetrical triangle or the ascending triangle
Waiting for price action to retest either previous triangle resistances as support
And of course there are bearish versions of these trade set ups if I am 180 degrees and 100% wrong. If I see either of my triangle supports get broken and then appear to be re-tested as resistance I will be eating a lot of humble pie as I flip my positions
Likewise I see a massive ascending triangle on Total2. This is also very easy to trade technically with stops and fibs. Below is a draw with target setting on the height of the ascending triangle alone.
Fundamentally over the next couple of years I seen a equity bear market with funds rotation into crypto. In other words I think the correlation between equities and crypto can finally break on account of the bullish structure in crypto and the bearish structures equities.
this idea doesn't take any effort to look at indicators and divergences and the like. When you add those to the mix the argument gets even stronger. Please see a linked idea below for an indicator post looking at much the same structures.

GREENPANEL - Ascending Triangle patternAll details are given on chart. If you like the analyses please do share it with your friends, like and follow me for more such interesting breakout charts.
Disc - Am not a SEBI registered. Please do your own analyses before taking position. This post is only for educational purposes and not a trading recommendation.

Non-BTC/ETH Alts approach "bounce or break" moment!!Over the past year, alt coins in the crypto space have been taking quite a hit from the back-and-forth motions of BTC and ETH. Alt-coins are once again at their own recent lows when BTC was between $32-33K back in January despite the price of bitcoin dancing around a significantly higher $37-38K price today.
I typically believe that ETH determines the general direction of the crypto space instead of BTC (albeit BTC can determine the trend for ETH). However, there are quite a few occasions whereby cryptocurrencies can deviate from both BTC and ETH as indicated in these charts.
The first chart is the percentages of all cryptos BUT bitcoin and ethereum . As you can very well see, the percentages have been forming an ascending triangle pattern (bullish pennant?) over the past year, and once again the percentages are nearing the bottom of this triangle.
The second chart is the total market cap of all crypto EXCEPT bitcoin and ethereum , and it appears that an ascending channel has been forming since early 2021 for which the market cap is once again near the bottom of this trend line (for details on how I calculated the total market cap of everything BUT bitcoin and ethereum, see my previous post on how you too can calculate this value and more ).
The key question is: will these resistances hold or will they break over the next few days? Either way, these look to be interesting charts to keep an eye on for the trend of crypto beyond just BTC and ETH over the next few days/weeks.
But as always, this is solely my opinion and should not be taken as financial advice. But please like or comment if you agree or see anything further!

APECOIN Ascending TriangleI just woke up to look at APECOIN, only to witness an ascending triangle forming with the pivot point. This is very important, since APECOIN might already be reversing. Let's watch what happens so that we can make something out of it. Also, the graph is hitting key spots on the triangle. KUCOIN:APEUSDT
