Bitcoin - 60% crash to 32K | ETH is dying | Trump scam?Technically, Bitcoin is entering a huge bear market! This is what my charts and fundamentals tell me at the moment.
Trump returned to the White House on January 20, 2025. This day, Bitcoin hit a new all-time high (109,588 USD), and since then, Bitcoin has been going only down! In 2019, Trump said he is not a fan of crypto. x.com
So isn't it weird that Bitcoin has been going down since the beginning of his presidential post? (On January 20). Random or planned? Answer by yourself, but something seems to be fishy here. What about the latest Trump post on TruthSocial about the strategic crypto reserve? The market reacted very positively, but after a few days, the whole market completely crashed and is now finding its new low. Was this another trap? Clearly, everyone who bought into this news is at a loss on his trading account; that's for sure.
What is happening to Ethereum? Ethereum is almost at the same price it was in 2018!! 7 years ago, the price of Ethereum was 1440 USD; the current price is around 1700 USD. I predict ETH to go to 750 USD in 2026. Why is this new technology struggling? Investors all over the world and early adopters are very disappointed by the performance of this coin. It also seems like the crypto market completely collapses, and only Bitcoin is surviving. Even though Bitcoin hit only 109k, which was most likely the ultimate top for the next few years, it was also less than everyone expected. I don't really want to talk about other altcoins because they are down 95% to 99%, and this bull market did nothing (sideways price action). In conclusion, this was the weakest bull market in history.
From a technical point of view, Bitcoin (and all altcoins) is breaking down on the weekly chart! The bullish market structure is broken, and we entered a new downtrend. Where to buy BTC, ETH, SOL, XRP, and other coins? You can write me a comment below, and I will tell you. I start with BTC—buy Bitcoin at the 0.618 FIB retracement. This FIBO is at 32 688 USDT, so we need to wait 1 year for the price to come to this level. Be patient.
So what to buy? Maybe focus on very low-cap coins; they do not follow the general trend (bull or bear). I have a tip for many coins, such as ATC (AutoTCrypto). Contract EQBMxFekc39SONbY8Mes8IwnZZlsPzeZhwz2c7sqMkkjI0uy. Where to buy? Use a decentralized exchange, such as dextools or ston.fi.
Write a comment with your altcoin + hit the like button, and I will make an analysis for you in response. Trading is not hard if you have a good coach! This is not a trade setup, as there is no stop-loss or profit target. I share my trades privately. Thank you, and I wish you successful trades!
Beyond Technical Analysis

Predicting sell off, 30"++ in advance of a head and shouldersLet's examine how a head and shoulders is usually formed by a wave 4 and 5 and an A & B wave, the C wave is the sell off after the head and shoulders.
I use this pattern to predict a head and shoulders AT THE RIGHT NECKLINE. In this case 90 minutes in advance.. So 6 X 15 minute candles in advance we can predicted a H & S and a selloff, sound valubale?
if you understand this concept please give a thumbs up.
To go over price action again, we are going up on 5 waves. Wave 4 creates the left shoulder. After wave 5 we come down on an A wave, that is the right neckline.
This is where You can predict an B wave UP, and if it doesn't go higher than the previous wave 5, we will get a typical head and shoulder sell off after the wave B up.

Trading Psychology or Technical Analysis—When Mind Meets MatterThere’s an age-old battle in trading that makes the bull vs. bear debate look like a game of pickleball (no offense, finance bros). It’s the clash between the traders who swear by their charts and the ones who insist it’s all about mindset.
The technicals versus the psychologicals. Fibonacci retracements versus fear and greed. RSI versus your racing heart.
TLDR? Both matter—a lot. But knowing when to trust your indicators, when to trust yourself, and when to blend both is the fine line that separates those who thrive from those who rage-quit.
⚔️ The Cold, Hard Numbers vs. the Soft, Messy Brain
Think of technical analysis as your sometimes inaccurate GPS in trading. It’s structured, predictable, and gives you clear entry and exit points—until it doesn’t. Because markets, much like a GPS in a tunnel, don’t always cooperate.
That’s where psychology creeps in. Your mind is the ultimate trading algorithm, but it’s often running outdated software. Fear of missing out? That’s just your brain throwing a tantrum. Revenge trading? A glitch in emotional processing. Overconfidence after three wins in a row? Well done, you genius.
Technical analysis gives you signals, but trading psychology determines how you act on them.
🤷♂️ When the Chart Says One Thing, and Your Brain Says Another
Picture this: You’ve mapped out the perfect setup. The moving averages align, volume confirms the breakout, and everything screams BUY .
But then your brain whispers, What if it reverses? What if this is a trap? What if I’m about to donate my account balance to the market gods?
You hesitate. The price moves without you. Now, frustration kicks in, and suddenly, you’re clicking BUY at the worst possible moment—just in time for a pullback.
Sometimes, the best trade is the one you don’t take. And sometimes, trusting the chart over your overthinking brain is the only way forward.
🔥 The Big Guys and Their Choices
Legendary investors have picked their sides in this debate. Howard Marks, the co-founder of Oaktree Capital, has long been a big believer in market psychology. He argues that understanding investor sentiment is more valuable than any chart pattern because markets are driven by cycles of greed and fear.
On the other hand, Paul Tudor Jones—one of the greatest traders of all time—leans on technicals, famously saying, “The whole trick in investing is: ‘How do I keep from losing everything?’ If you use the 200-day moving average rule, you get out. You play defense.”
Both approaches work. The question is: Are you the type who deciphers market mood swings, or do you trust that a well-placed moving average will tell you when to cut and run?
🌀 Overtrading: The Technical Trap and the Psychological Spiral
Overtrading usually starts with a good trade, a small win, and a rush of dopamine that convinces you you’ve cracked the code. So, you take another trade. Then another. And before you know it, you’re firing off entries like a caffeinated gamer, except your PnL is the one taking the damage.
Technical traders fall into this trap because they see too many setups. Every candlestick pattern, every little bounce, every “potential” breakout becomes a reason to trade.
Psychological traders, on the other hand, may overtrade out of boredom, frustration, or the need to “make back” losses.
The result? An emotional rollercoaster that ends with an account balance you don’t want to check the next morning.
The fix? Trade selectively. The best setups don’t come every five minutes, and forcing trades is like forcing a bad joke—it just doesn’t land.
💪 Fear, Greed, and the Art of Holding Your Ground
Every trader knows the feeling: You’re in profit, but instead of letting the trade play out, you close early because profit is profit, right?
Wrong.
Fear of losing profits is what keeps traders from maximizing their wins. And greed—the evil twin of fear—is what makes traders hold losing trades, hoping for a miracle. It’s the classic “let winners run, cut losers short” rule in reverse.
Technical traders know where their stops and targets are. The problem? They often ignore them when emotions take over. Psychological traders “feel” the market but get crushed when that gut feeling betrays them.
The best traders find the balance—using technicals to set logical targets and psychology to actually stick to the plan.
🤝 The Solution? A System That Checks Both Boxes
So, what’s the verdict? Do you put matter over mind or mind over matter?
The truth is, great traders do both. They develop strategies based on technicals but manage execution with discipline. They respect risk management rules not just because the chart says so, but because they know how destructive emotions can be.
Here’s what the best do differently:
✅ They journal trades —not just the setups but how they felt during the trade.
✅ They stick to a trading plan so they can trust their system over impulse.
✅ They set rules that help them to properly bounce back from losses .
✅ They know the value of knowledge and never stop learning. (We’ve got you covered here, too. Go check the Top Trading Books if you’re a trader and stop by the Top Books on Investing if you’re an investor).
💚 Final Thoughts: Mind and Market in Harmony
In the end, trading is never just one or the other. It’s not pure math, and it’s not pure mindset. It’s a dance between structure and instinct, strategy and psychology. The ones who get it right aren’t just great at reading charts—they’re great at reading themselves.

EU | Hourly Timeframe Analysis We are still bullish until we break the hourly swing low. Until that happens, I am still looking for buys. I would like to see price come down further into this hourly order block which also holds a 30M imbalance inside of it, fill that imbalance, get a shift in price on lower time frame, and then ride price back to the swing high. There is some daily resistance not too much higher above the swing high that I marked out so we could see some sell off from that point but we will see.
Trade Safe -Remzy

Tesla - There Is Hope For Bulls!Tesla ( NASDAQ:TSLA ) is just crashing recently:
Click chart above to see the detailed analysis👆🏻
After Tesla perfectly retested the previous all time high just a couple of weeks ago, we now witnessed a quite expected rejection of about -50%. However market structure remains still bullish and if we see some bullish confirmation, a substantial move higher will follow soon.
Levels to watch: $260, $400
Keep your long term vision!
Philip (BasicTrading)

Usdjpy analysis This chart represents a technical analysis of USD/JPY on the 1-hour timeframe from TradingView, outlining potential price movements based on key support and resistance levels.
Support Level: Marked around 147.175, this level is expected to act as a strong demand zone where buyers might step in if the price retraces.
Current Price: USD/JPY is trading around 148.262, showing signs of bullish momentum.
Potential Price Movement: The chart suggests a possible pullback toward the support level before resuming an uptrend.
First Target: Positioned at approximately 149.678, this is the next key resistance level where price action might encounter selling pressure.
Second Target: Identified near 151.002, indicating further bullish continuation if the first target is broken.
Outlook:
The analysis suggests a bullish bias, but a retracement to support may occur before a potential breakout. Traders may look for confirmation signals before entering positions. The volume profile on the right shows strong activity around these levels, reinforcing the importance of these key zones.

FILUSDT - Buy now or regret later!FIL is literally one of the hidden gems in the market.
The probability of a strong rebound is increasing significantly in the coming days. The coin has reached its strongest support level, a key historical reversal point.
Investing in it now is a golden opportunity, with a target of $27.
The bottoms have already formed across many altcoins—now is the best time to buy
Best regards Ceciliones🎯

Naturalgas Buying Opportunity - Ultrashort termDate- 12-march-2025
Naturalgas Looking Good For buy for 2-3 day for 15-20 point with stop-360 CMP- 363 . It will move upward from CMP if Buyer Sustain Price Above CMP.

BNB: Poised to Resume Bullish TrendBNB Poised to Resume Bullish Trend
Since February 13, BNB has experienced a month-long decline, entering a clear 4-hour bearish trend. However, the price appears to have completed a "Descending Channel" pattern, signaling a potential shift.
Currently, BNB is demonstrating renewed strength. A decisive move above the descending channel could propel BNB upwards, with an initial target of 625 and a secondary target of 670.
You may watch the analysis for further details!
Thank you:)

Gold (XAU/USD) Breakdown Potentialhello guys.
The previous trendline was broken, leading to a bearish move.
Price formed a range, consolidating between key levels.
A breakout occurred below the range, signaling weakness.
The current retest suggests a potential rejection and continuation to the downside.
If price fails to reclaim the range, we could see a drop towards the $2,875 - $2,860 support zone.
Traders should watch for confirmation of rejection before entering short positions.

Litecoin Approaching Resistance: 20% Drop to $70 Support ExpecteHello and greetings to all the crypto enthusiasts, ✌
Let’s dive into a full analysis of the upcoming price potential for Litecoin 🔍📈.
Litecoin is situated within a parallel channel and is nearing an important trendline and resistance zone. Given the current market conditions, I foresee a potential correction of approximately 20%, with a key support level at $70. This price point not only holds psychological significance but also acts as a crucial technical support area.📚🙌
🧨 Our team's main opinion is: 🧨
Litecoin is near a key trendline and resistance, and I expect a 20% drop to $70, a strong support level with psychological significance.📚🎇
Give me some energy !!
✨We invest hours crafting valuable ideas, and your support means everything—feel free to ask questions in the comments! 😊💬
Cheers, Mad Whale. 🐋

GOLD Scenario 13/03/2025English : According to our analysis, we anticipate a BULLISH scenario.
Morocan Darija : kanchofo d'apres l'analyse dyalna antsanaw TLOO3
ATENTION : I only share my ideas, not signals.

SPY S&P 500 etf Oversold on the RSI ! 2025 Price Target ! The SPDR S&P 500 ETF Trust (SPY) is flashing a major buy signal, with its Relative Strength Index (RSI) currently sitting at 28.33 — firmly in oversold territory. Historically, every time SPY has entered oversold levels on the RSI, institutional buyers have stepped in aggressively, driving sharp rebounds in the following weeks and months.
The last time SPY dipped below the 30 RSI threshold was during market pullbacks in 2022 and 2023 — both of which were followed by significant rallies as institutions capitalized on discounted valuations. The current setup is no different. With earnings growth stabilizing, inflation cooling, and the Federal Reserve signaling a potential shift toward rate cuts in the second half of the year, the backdrop for a recovery is aligning perfectly.
Technically, SPY is also approaching key support levels that have held strong in past market corrections. The combination of an oversold RSI and strong institutional appetite at these levels creates a compelling case for a bounce.
My price target for SPY by year-end is $640, representing over 15% upside from current levels. With sentiment stretched to the downside and technical indicators flashing green, SPY looks primed for a sharp and sustained rebound. Now could be the perfect time to position for the next leg higher.

EUR/AUD Long Setup – 15M ChartPrice is reacting off a key demand zone after a bearish move, showing potential signs of reversal. Entry is based on bullish rejection at support, aligning with the 9 EMA as dynamic resistance turned potential support. Targeting 1.74203 with a stop below the zone around 1.72305, offering a favorable risk-to-reward ratio. Waiting for bullish confirmation to follow through.

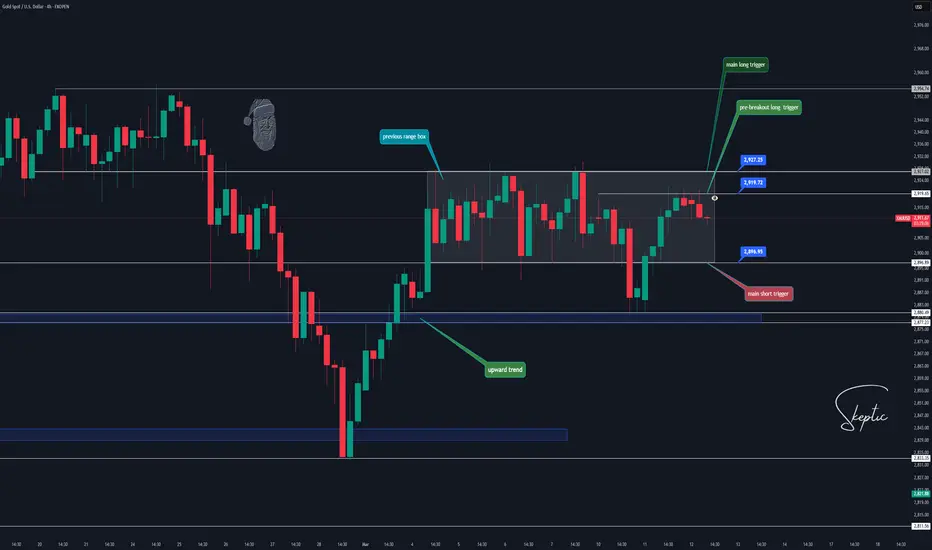
Gold Analysis: Is the Uptrend Still Alive?Welcome back, guys! 👋I’m Skeptic , and today we’re diving into a quick analysis of Gold (XAU/USD) . Let’s break it down.
📈 4-Hour Time Frame Analysis
In the 4-hour time frame, we recently observed a range box breakout, but the price quickly pulled back into the box, indicating that sellers failed to maintain the bearish momentum. This suggests that the daily major uptrend is still holding strong.
🔮 Our next move? If we see a break above the 4-hour resistance at 2927.25 , it could be a solid signal to position ourselves for a potential continuation of the uptrend. The ultimate bullish trigger will be the breakout above 2954.74 , confirming strength and momentum to the upside.
💡 Market Sentiment and Risk Management
However, with the current geopolitical and economic uncertainties, it’s crucial to be extra cautious. Considering recent global developments, it’s wise to reduce risk exposure. Staying agile and managing stops effectively will help navigate any unexpected volatility.
📉 Short Setup
For short positions, our key trigger is a break below the support at 2878.84 . Once broken, there’s no significant support until 2841.74, which means the move could be sharp and rapid. However, since this support is critical, be prepared for potential volatility and adjust your stop losses accordingly.
I’m Skeptic, and I’m always glad to share insights with you guys. Let me know your thoughts in the comments, and feel free to ask any questions. See you in the next analysis! <3
Will XAU/USD Hit a New ATH - Heading for 3,000?🔔🔔🔔 Gold news:
👉The US dollar is facing increasing pressure due to changes in US trade policy and increasing global economic uncertainty. If the US government continues on its current path, these pressures could increase, pushing investors towards safe-haven assets such as gold.
👉 In addition, slowing economic growth and expectations of a Federal Reserve rate cut are adding pressure on the greenback. Conversely, gold's appeal as a hedge against geopolitical uncertainty and currency weakness has increased. Rising global tensions and concerns about persistent inflation make the precious metal increasingly attractive for portfolio diversification.
Personal opinion:
👉 RSI (1H) is showing signs of divergence and gold has failed to break above 2950 during the European session. Signs for gold to ease for a momentum break
👉In addition, the DXY and the US 10-year bond yield rising again could slow down the gold rally
Analysis:
👉Based on important resistance - support levels and Fibonacci combined with EMA to come up with a suitable strategy
🔆 Resistance level: 2.956 2.970
🔆 Support level: 2.940 2.932 2.920
Plan:
🔆 Price Zone Setup:
👉Buy Gold 2.940 – 2.938
❌SL: 2.934 | ✅TP: 2,944 – 2,948 – 2,954
👉Sell Gold 2,955 – 2,957 (Scalping)
❌SL: 2,961 | ✅TP: 2,952 – 2,948 – 2,943
👉Sell Gold 2,969 – 2,971
❌SL: 2,976 | ✅TP: 2,965 – 2,961 – 2,956
FM wishes you a successful trading day 💰💰💰

The 5 Wave move that was coined a Stock Market Crash(Elliott)This is a zoomed in chart of a previous post where we see two Stock Market Crashes in a single chart. The Financial Crisis of 2008 was simply the last wave of a 5 Wave move. There are two retests on different 423% Fibs. emphasizing the end of the larger correction which by the way began with the Dot-Com Bubble(another ''Stock Market Crash''). Follow @victorkmacharia on X for prediction of the next Stock Market Crash, insight that is actionable and a very different way to look at the market.

Possible BUYI will be looking for the market to take the equal lows and head down into that 15min FVG. tp would be previous high

Higher High & Key Resistance Test📊 BME:RED Market Update – Higher High & Key Resistance Test
📈 BME:RED has made a new Higher High (HH) and is now pulling back.
🔄 Current Scenario:
If price breaks the black resistance line, the next targets are at the blue line levels.
Price could return to the HH level, but the gap is located even higher, indicating potential further upside if momentum continues.
The gap area represents a previous strong selling zone, so traders should remain cautious when price approaches this level.
📌 Watch for breakout confirmation before targeting higher levels, and manage risk near resistance zones.

US Market Reversal Emerged? This Week's Closing is CrucialThe final trading day of February. I always take the opportunity to analyze the monthly chart closely.
We saw an inverted hammer. From the cash chart, clearly, we can see the inverted hammer. Beyond that, it also appears to be a potential double top for the Nasdaq.
E-mini Nasdaq Futures & Options
Ticker: NQ
Minimum fluctuation:
0.25 index points = $5.00
Micro E-mini Nasdaq Futures & Options
Ticker: MNQ
Minimum fluctuation:
0.25 index points = $0.50
Disclaimer:
• What presented here is not a recommendation, please consult your licensed broker.
• Our mission is to create lateral thinking skills for every investor and trader, knowing when to take a calculated risk with market uncertainty and a bolder risk when opportunity arises.
CME Real-time Market Data help identify trading set-ups in real-time and express my market views. If you have futures in your trading portfolio, you can check out on CME Group data plans available that suit your trading needs tradingview.com/cme/
Trading the Micro: cmegroup.com/markets/microsuite.html

EUROPE VS US Stock Dramatic Moves CAUTION!Zelenskyy Oval office ambush did much more than ambush and betray an ally in support of a dictator like Putin.
Betraying an ally destroyed the trust in the U.S. government. Without trust in the government, democracy cannot be, leaving only a dictatorship capable of surviving.
Markets have spoken very loudly with trillions of dollars, not words out of people's mouths.
Superpowers are only as strong as their allies. Isolationism doesn't work. Ask N. Korea, The Soviets etc.. why that is.
Trust can not be granted nor taken, it may only be lost.
CAUTION IS IN ORDER!

Inflation Leading Indicator Data with Agricultural Commodities Inflation leading indicator data is not derived solely from CPI numbers; more importantly, we must consider what drives these CPI numbers. By understanding this, we can stay ahead of the mass market.
Looking at past trends, we can observe that CPI numbers and agricultural commodities tend to move in tandem.
In this discussion, we will explore why agricultural commodities are an effective tool for projecting inflation direction and examine where these commodities may be heading.
Micro Agriculture Futures:
. Corn: MZC
. Wheat: MZW
. Soybean: MZS
. Soybean Oil: MZL
. Soybean Meal: MZM
Disclaimer:
• What presented here is not a recommendation, please consult your licensed broker.
• Our mission is to create lateral thinking skills for every investor and trader, knowing when to take a calculated risk with market uncertainty and a bolder risk when opportunity arises.
CME Real-time Market Data help identify trading set-ups in real-time and express my market views. If you have futures in your trading portfolio, you can check out on CME Group data plans available that suit your trading needs www.tradingview.com
Trading the Micro: www.cmegroup.com
