btcIt is oscillating from above and below, and to reach that upper range, this red box must be broken and stabilized.
At the moment, we have a small support in the green box, and I am waiting to see if it is supported to defeat the red box or if it wants to collect cash again.
Bitcointrading


BtcThe first support area is the green box, which is touched once, the first resistance area is the red box, which is touched three times, the failure enters the next points from each side.

BTCUSD: Caution Despite Bullish TrendThe chart currently displays a rising wedge pattern on BITSTAMP:BTCUSD , a configuration often preceding a bearish reversal. Despite the recent price decline, the market trend is still upward, and prices are consolidating within the expected range.
Currently, the price is positioned in the middle of the wedge's range, indicating a neutral stance. Traders should monitor the price movement closely in the coming days for signs of either continuation or reversal.
After the high on November 9, the price action retraced to the 23.60% Fibonacci retracement level, a pattern that is seemingly repeating itself as we observe the current retracement.
The RSI indicator suggests that the market is potentially overbought, indicating exhaustion, which could lead to bearish divergence. However, there is still a possibility for the price to push upwards, challenging the resistance zone between $46,000 to $48,000 before any reversal could be confirmed.
From a trading perspective, the Bonsai indicator has not signaled a short position yet, hence our current long position. However, given the rising wedge formation, we are taking partial profits and closely monitoring for any indication of a trend reversal.
In terms of recent fundamental news, Bitcoin has seen a mix of potential bullish drivers, such as increased adoption by mainstream finance platforms and positive developments in blockchain scalability solutions. Yet, these factors don't guarantee continued price increases; past market cycles have shown that Bitcoin can experience significant corrections despite positive news.

BTCUSD: Amazing similarity with 2020. Will the 1D MA50 hold?Bitcoin has so far remarkably followed the fractal that followed the March 2020 COVID crash. Of course that was a pattern on the second phase of that Bull Cycle, whilst now (chart on the left) was the first rebound of the Bull Cycle. Nevertheless, the similarities are striking. Especially on the RSI's part. The 1D technical outlook is bullish (RSI = 60.001, MACD = 1547.200, ADX 26.937) and as long as the 1D MA50 holds, there is reason not to expect a bullish extension. Fractal-wise we are in a situation similar to the November 26th 2020 pullback, which gave way to a short term consolidation.
Do you think the 1D MA50 and initiate a new bullish wave?
## If you like our free content follow our profile to get more daily ideas. ##
## Comments and likes are greatly appreciated. ##

btcAs we said in the previous reviews, we had a green box that we said if it is broken, the bit correction process will start. When the box is broken, it created a resistance for us and we said that lower numbers can be touched so that the resistance is not broken. The first resistance range of Bitcoin is the red box and then the purple lines, which will be a corrective trend until it is broken.

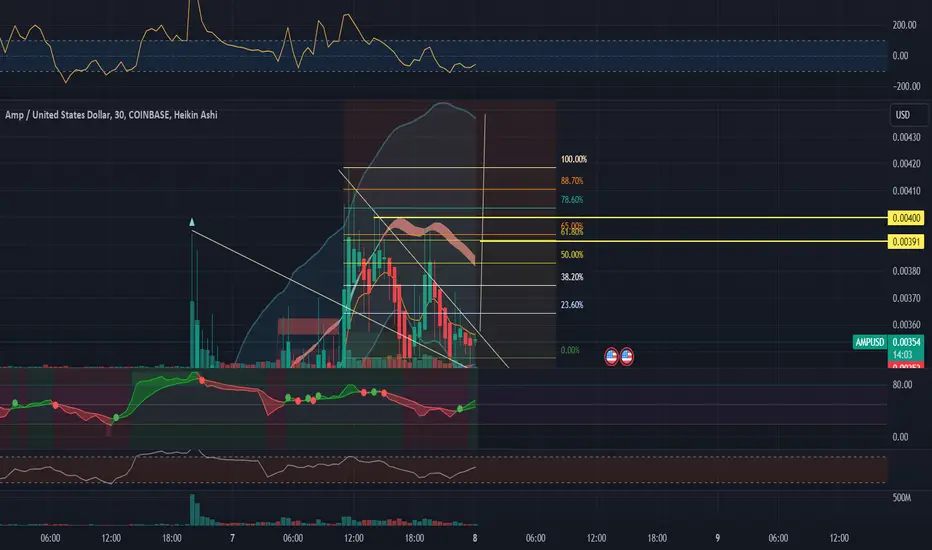
AMP is about to pumped?Are we about to see some energy?
I thing so!
Targets are marked above and higher levels could be hit!!
NOT FINANCIAL ADVICE IT COULD GO TO ZERO
Bitcoin Possible Pullback to 43.7Bitcoin near the top of our rising broadening wedge but could pullback before it goes higher.4 Hour shows possible pullback
Thanks for watching

DOGE is a safe place???Currently you can see Doge go up.
BIGTIME & BTC go down.
IS THIS TIME FOR THE DOGE MOON??? I THINK SO!!!
NOT FINANCIAL ADVICE IT CAN GO TO ZERO or mars!!

Can Bitcoin Hedge Against a Falling Dollar?Global inflation often signifies a weakening of global currencies. The question of whether Bitcoin can serve as a hedge against a depreciating dollar has gained significant interest among investors.
Or should it still be the Gold?
In this study, we will analyse the top 8 cryptocurrencies to determine which one is a more reliable currency hedge.
Bitcoin & Its Minimum Fluctuation
$5.00 per bitcoin = $25.00
BTIC: $1.00 per bitcoin = $5.00
Code: BTC
Micro Bitcoin & Its Minimum Fluctuation
$5.00 per bitcoin = $0.50
BTIC: $1.00 per bitcoin = $0.10
Code: MBT
Disclaimer:
• What presented here is not a recommendation, please consult your licensed broker.
• Our mission is to create lateral thinking skills for every investor and trader, knowing when to take a calculated risk with market uncertainty and a bolder risk when opportunity arises.
CME Real-time Market Data help identify trading set-ups in real-time and express my market views. If you have futures in your trading portfolio, you can check out on CME Group data plans available that suit your trading needs www.tradingview.com

Feeling Brave?! Sell Bitcoin Now at 50% FibJust under 42K in BTCUSD is the 50% Fib of the entire drop from record highs to the 2022 low. It is also the objective from the recent triangle breakout.
Note: this is very counter momentum - which are usually works out pretty quickly - either in profit or loss! Also - the triangle is probably part of a bull pennant in which case the upside objective is more like 49K.

BTC BEARISHNESSBitcoin price is likely to deep ,forming an ending diagonal btc is likely to deep and by wycoff distribution every thing is also bearish

Possible Bitcoin BTC price move for next 3 monthThere are two elements in the market : "retail money" and "big money".
The former buys longs based on rumors and news around ETFs.
The latter, based on the same news, receive increased trading volumes at the expense of retailers and dump their positions to them, rather unnoticed.
For ourselves, we assume that in the next 3 months, the price of BTC may move in a similar "white fractal" pattern:
- a sharp downward impulse and the overlap of the $34100-34400 GAP formed on CME BTC.
- further prolonged sluggish growth, ultimately without updating the highs - "dead cat bounce"
- January 2024 - the beginning of ETF decisions announcements - the beginning of a relatively deep correction in the crypto market.
What do you think about this scenario? Write in the comments

BTC is near to a FALLBITSTAMP:BTCUSD
Bitcoin is continuously making higher high but with bearish div. It will fall from here. Take trade accordingly. DO not get in FOMO.

BTCUSD: Right where it's supposed to be.Bitcoin is on the very healthy bullish technicals on the 1D timeframe (RSI = 60.823, MACD = 1089.300, ADX = 23.103) extending a controlled uptrend. The 1W timeframe remains overbought though (RSI = 74.426) as there has been no hard correction since mid August. Perhaps the relief in late weeks is an attempt of 1D to neutralize the overbought state on 1W without a strong correction.
Regardless of this, Bitcoin is right where it's supposed to be when compared to the previous Cycles. On this chart you see the harmonic structure of every bottom that leads to cyclinder pattern that ultimate paves the wave for the end of Cycle rally.
There has always been one extreme event' crash on every Cycle, after which the market bottomed and never looked back. It was COVID and Bitfinex before, this time we had FTX and now the market shouldn't break the 1W MA50 again before the next Bear Cycle starts. All that's left now to do is see how close the price will be to the 1W MA50 in the next Halving (April 2024) as from that point onwards the parabolic rally can start any moment.
See how our prior idea has worked:
## If you like our free content follow our profile to get more daily ideas. ##
## Comments and likes are greatly appreciated. ##

Bitcoin Rising Wedge = 33000$?Hello everyone! Bitcoin is forming a rising wedge on all time frames, with a potential target around $33,000.
If the price breaks and holds above the upper resistance line, then the idea becomes invalid.

Bitcoin Could Still hit 38K OR dumps to 35.9Bitcoin Hit Our target from yesterday to the teeth.it could come back up to grap the late shorters and higher liquidity or it could go low.untill losing 36K there will be possibility of an short squeez again.
Thanks for watching and take care

BTC on his way to a new rangeBTC probably will range till end of December before any significant correction. I would say the range could be from 38K to 44K $.
At the moment is has all SMAs and EMAs in order to keep moving very bullish.

Exciting News: BTC Soars Around $36,000! SMA 50 > SMA 100 200The latest news is that BTC is currently hovering around an impressive $36,000 mark! This is a momentous milestone that demands our attention and calls for action.
Why am I so thrilled about this? Well, let me break it down for you. As seasoned traders, we understand the importance of technical indicators and trends. And right now, BTC is showing us some auspicious signs. The Simple Moving Average (SMA) 50 has surged higher than the SMA 100 and 200. This is a clear indication of a bullish trend, suggesting that BTC has the potential to continue its upward trajectory.
Now, I don't know about you, but this information has got my adrenaline pumping! It's the perfect opportunity to capitalize on the market movement and maximize our profits. So, without further ado, I urge you to consider joining the long BTC movement today!
By going long on BTC, we position ourselves to benefit from the potential price appreciation and take advantage of this bullish trend. As we've seen in the past, BTC has a history of remarkable surges, and this could be just the beginning of another significant upward movement.
So, here's the call to action: Take action now and seize this golden opportunity! Open your positions and go long on BTC. Don't let this thrilling moment pass you by. As traders, we live for these exhilarating market conditions; this is our chance to ride the wave of success.
Remember, trading always involves risks, and it's essential to conduct your own analysis and make informed decisions. However, with the current market indicators favoring a bullish trend, going long on BTC seems like a promising strategy.
As always, stay updated with the latest market news, monitor your positions closely, and adapt your trading strategies accordingly. The crypto market is dynamic and ever-changing, but we can navigate it successfully with a calculated approach and a touch of excitement.

BTC Risky Long There are some small chance that MM has finished to squeeze longs. I am taking a risk here but ideas look decent

BTCUSD correctionBTCUSD reach double top resistance at $38,046.
If this resistance cannot break up, we have classic support at $35,972 to hold correction .
this classic support also same level as fibonacci 0.618 support around channel up support.

38,000 top for a long period or not ?Will it be a 3-wave move downwards or will we impulsively go down?
Time will tell!
The 3-wave move (ABC) => The 38,000 top will likely be broken in a relatively short period of time.
The impulsive move (12345) => The 38,000 top will continue to act as a top for a longer duration.

Bitcoin's Bull Run to $39,968: Unleashing Strong MomentumOverview:
Bitcoin has recently displayed a compelling technical pattern, forming a triangle with a notable high at $37,978 and a corresponding low at $35,784. The chart indicates a period of consolidation, setting the stage for a potential breakout on November 12. This impending move is further accentuated by a strong resistance level at $39,968, making it a key target for the anticipated upward movement. The bullish outlook is substantiated by fundamental factors, notably BlackRock's proposal to introduce a Bitcoin Exchange Traded Fund (ETF), currently awaiting SEC approval by October 2023. Additionally, the projected decrease in November USD inflation to 3.3% and Federal Reserve Chairman Powell's expressed inclination to lower interest rates create a favorable environment for BTCUSD.
Technical Analysis:
1. Triangle Breakout: The technical analysis reveals a well-defined triangle pattern, signifying a consolidation phase. A breakout is expected on November 12, providing a clear signal for potential bullish momentum.
2. Target at $39,968: Historical data and meticulous technical scrutiny indicate a significant resistance level at $39,968, establishing it as a plausible target for the upward movement.
Fundamental Analysis:
1. BlackRock's Bitcoin ETF Proposal: The potential approval of BlackRock's Bitcoin ETF presents a substantial catalyst. Approval could attract institutional investors, fostering positive market sentiment and potentially elevating Bitcoin's market position.
2. USD Inflation Decrease: The projected reduction in November USD inflation from 3.7% to 3.3% is a favorable macroeconomic factor. Lower inflation mitigates pressure on the Federal Reserve to raise interest rates, benefiting risk assets like Bitcoin.
3. Powell's Interest Rate Stance: Chairman Powell's vocalized desire to lower interest rates to 2% reflects a dovish stance. This dovish sentiment is typically conducive to the performance of Bitcoin, as it diminishes the relative attractiveness of traditional fiat currencies.
Risk Factors:
Market Sentiment: Rapid shifts in market sentiment or unforeseen events can exert influence on cryptocurrency prices. Traders should remain vigilant for sudden changes in the market landscape.
In summary, a comprehensive analysis incorporating both technical and fundamental factors supports a bullish breakout scenario for Bitcoin around November 12. The potential target of $39,968 aligns with historical resistance levels and is strengthened by positive developments such as BlackRock's ETF proposal, decreased USD inflation, Potential Powell's dovish interest rate stance. Traders are advised to closely monitor SEC decisions and stay attuned to broader market dynamics for informed decision-making.
