Bitcoin Possible bullish ScenarioBitcoin Possible bullish Scenario, Price may go up and touch 100 weekly Moving Avg(MA). also it can go little higher then we can expect some consolidation and pull back to 0.6 fib level.Thanks
Bitcointrading

The price of Bitcoin has soared driven by market optimismLast Friday, Bitcoin fell to US 19,569. How desperate the market was at that time, and how enthusiastic it is now. In just one week, the Bitcoin market has undergone a shocking reversal, breaking through the previous high in one fell swoop and reaching above US 27,000.
In terms of daily structure, Bitcoin has broken the previous horizontal pressure level. At this stage, it is in a vacuum zone. Bitcoin price analysis has been slowly rising since the beginning of this week, and more buying pressure has been observed in the market. Pressure.As tokens are supported by strong buying pressure and good technical prospects, market sentiment remains optimistic, and the bullish momentum is expected to continue, with the next level of pressure around 30,000.
From the four-hour level, it can be seen that the last downward pullback was at the position of 0.382. Next, I think the possibility of constructing an equidistant ABCD is very large. As shown in the figure, Point D is far from being reached. The rise in the past two days has formed a complete breakthrough in the previous chip-intensive area. If there is a pullback in a short period of time, I think the pullback may as well be an opportunity to participate in long-term.
In order to facilitate everyone to continue to follow up on my analysis and sharing, you can like and follow me; in addition, I will share the daily real-time strategy in the channel. If you can't follow up in real time, you may make operational errors.You can use the following methods to enter my channel for free to follow the latest news and follow up on market trends in real time.


BTC RALLY DUMPBitcoin has formed RALLY DUMP scenario, expecting to see reversal soon which is already happening, I believe that the entries for shorts hasn't been picked fully yet, we need to go up in-order to grab more liquidity for shorts in-order to be able to have a chance to destroy the people who are trying to catch up in the market, for that we need to fill the entries of RALLY DUMP scenario around the price of 25384 - 26K, where we also have got a 0.618 Fibonacci. I believe that the first target would be around 24455, the second Target would be around 22500 - 22189 where we will be placing longs from there.


#Bitcoin Reversal SignBitcoin has given a reversal sign. We see an inverse head and shoulders. $35 000 is the potential target.

Hasbullas Fomoing on Bitcoin!Pump it then dump itBitcoin on 15minutes doing a symmetrical triangle which indicates a continuation to downside
Liquidation to the upside is more than 24 Million so its possible we test 27.4 (Close to bottom of the 27 to 28 gap )
SPX consolidated and the banking failure is yet to unfold

RNDRUSDT AT A GOOD REGION TO BUY FOR LONG POSITIONRENDER (RNDR) is a distributed GPU rendering network built on top of the Ethereum blockchain, aiming to connect artists and studios in need of GPU compute power with mining partners willing to rent their GPU capabilities out.

About Bitcoin - Did we just get exactly what we needed?We’ll look at the weekly timeframe checkout where BTC closed last week and what it means. We’ll also look at the daily timeframe and check out the healthy and unhealthy levels. In short, during a pullback, there are places BTC can go down to and can still be considered part of a healthy recovery and places where if it goes there it is lights out and we're back to sliding further down. Don't forget to Boost this idea.
Looking at the daily timeframe above, Bitcoin needs to pull back a bit but there are levels we can go and levels we can't. It will be ok for BTC to pull back to $21,800, $19,700, or $18,800 but we have to go back to 23k and above before the weekly candle closes on Sunday. Falling below the range (The black box) is not a good move, it will mean lights out and a bad tumble down could be imminent.
Looking at the weekly timeframe below BTC created the best-case scenario last week, it generated a much-needed red candle without going under the new support line (thick white descending line). We now have the possibility of seeing a green candle this week that can take us from 23k to 26 or 27k. If this happens and we manage to stay at those levels then recovery has truly started. We can also range sideways which will be perfectly fine, last week's red candle has bought us time and flexibility. Now, what happens if this new weekly candle closes below the white descending line? We can still move up but the odds of going down grow and the odds of moving up diminish exponentially, If this month long move upward fails we could see quite a tumble back down.
On the lines-only chart, we can see that the golden cross of the 200MA (white line) and 50MA (yellow line) it's a done deal. It should be completed by Tuesday, the 7th. Once we are done here we're waiting for the golden cross of the 100MA and 200MA which should be done by May. Why are we waiting for these events and what does it mean? Historically when all color lines (moving averages) are lined up above the white line a long period of significant gains follows. The way I see this playing out in 2023 is that we'll see a few good times and a lot of sideways movement, mostly this will be a year of recovery and stabilization. Now, the end of 2023 and the first quarter of 2024 should lead to irrational exuberance, which is when you want to sell and go on vacation for the next 2 years.
I’ll update this post as the week's events unfold.
VERY IMPORTANT: Hitting the "Boost" button is like a tip, please don't forget to do so after reading, this is your way of thanking me for my time and so I thank you for yours.

BTCUSDTBITCOIN UPDATE ACCORDING TO OUR ANALYSE BITCOIN IS GOING WHERE WE ANALYSE
Friends, the advantage of waves is that you can use them on any time frame 🙆
⠀
Patterns form in any market and any TF. You just need to decide where you feel most comfortable working. My thoughts below 👇
⠀
🔴 15min - 1H takes a lot of time and engagement, it's tiring and leads to mistakes. Traders use high margin and often lose money + leverage.
⠀
🟡 1W - 1M is a very long time, it is more suitable for investors, and it requires a lot of capital. The patterns are clear and strong.
⠀
🟢 From experience I realized that my choice is 4H - 1D. No need to spend all day on charts, good work/life balance, good market movements, patterns are well distinguishable. It requires patience, which most traders do not have. It takes you to the next level if you have the discipline.
⠀
🚥 If 4H - 1D is for you, let's trade together!

Cyclical Nature of BitcoinToday, we'll take an in-depth look at Bitcoin and examine where we could be headed over the next few months. The chart before you is crystal clear: we are in the midst of a repeating cycle. Regardless of how bad the news may be, or how much global conflict or financial turmoil escalates, all that matters is the chart.
The chart speaks volumes: Bitcoin came back to the green zone in this model in precisely the same time as the last cycle: 364 days. Refer to this TA for more information on that:
So we hit the green zone, we've bounced out of it, hovering just above it, as we did in 2019. With last week's weekly close, we've broken the 0.25 Fibonacci fan, just as we did in 2019. So, unless we do something that changes the mirror fractal, we will continue to stick to the view that this relief rally is just getting started.
In 2019, it took us 56 days from the time we broke the 0.25 Fibonacci Fan to reach the relief rally top. If the same pattern holds, the week of April 10th, 2023, would signal the top, and we could go as high as $48k. Anywhere between $35-48k would be the topping zone. Somewhere within this yellow circle, around this time, would be the perfect topping signal for Bitcoin. However, things never go as planned, so we could top out as early as $35k.
Why $35k? Well, the highest CME gap currently sits at $35k, with the 0.382 Fibonacci Fib. This is an area that I'll be paying close attention to because it's very possible that Bitcoin will close the gap and top out for the year at this level.
If we zoom into the daily in 2019, we can see that we created an ascending channel coming out of capitulation. We have done precisely the same thing this cycle so far, but we will go one step further here.
This chart shows the Pearson correlation coefficient, demonstrating decoupling from the SPX500 vs. Bitcoin. When we dig in, we see that, in fact, Bitcoin decouples from the stock around precisely the same time during this ascending channel in 2019. The negative correlation lasts for a significant chunk of the relief rally, as you can see. Very interesting. Here we can see that during that period, the Dow Jones dropped 7.59%, while Bitcoin rallied 78%. It's essential to note that even though Bitcoin has become increasingly more correlated over the years as it matures, there are still pockets of the cycle where there is negative correlation.
Bitcoin has been performing consistently within the same bands as it did in 2019, a fact that remains true since the publication of the TA above from eight months ago. This post, published during the bear market, was met with skepticism and laughter from traders who claimed that the "MACRO ENVIRONMENT" would prevent the predicted outcome. However, the theory, vision, and analysis presented in the post remains valid and unchanged to this day. By removing the noise and emotions surrounding human behavior, we can stick to the chart and better predict market trends.
Mayer Multiple Bands
Bitcoin still playing within the same bands as 2019 perfectly .
Of course, there's always a possibility that I am wrong. What if we're not going to have a relief rally, and this is the top? The invalidation level is always present, and nothing is ever 100% guaranteed.
Looking at the fractal pattern that emerged during the 2015 bear market, we can see that history could repeat itself. While anything is possible, including a black swan event that could bring the market down in a week, I think the odds of this fractal pattern playing out are low, at around 10%.
In every cycle, Bitcoin puts in a "marco double bottom." Even in 2011, Bitcoin put in a double bottom. Having cash on hand for when those two bottoms hit is essential. I believe we have only had one bottom, and while some analyses bet on the FTX black swan being the second bottom, I disagree.
After the COVID crash in March 2020, I spent countless hours trying to predict when the next Bitcoin crash would occur. I was off by two weeks when I published my analysis in January 2022, but we did get the first cycle bottom around the end of May 2022.
The only constant pattern we have is that Bitcoin puts in the second double bottom before the next halving, which is scheduled for April 2024. The average length from the second double bottom to halving is 256 days, and according to my analysis, sometime between July 24th, 2022, and April 2024, we're likely to get Bitcoin's double bottom, which would bring the price down to at least test the first bottom lows at $15k.
My Bitcoin model predicted the pico bottom of the COVID crash in 2020, and if it follows the same pattern, the latest low band of the model will be retesting $15k is April 2024, which is the same month as the halving. Keep in mind that these are projected lines for this model, and if anyone is a coder who can add projected dash lines to the model, please DM me on TradingView.
Another possible outcome for the double bottom of Bitcoin could be a crash as early as July 2023.
As long as Bitcoin stays within this ascending channel, we have the potential to push much higher. However, if we break out of the channel and close below it on a daily timeframe, the chances of the 2015 fractal playing out become much higher.

BITCOIN IS BEARISH, BEWARE OF THAT!BTCUSDT 1D,
Bitcoin is currently forming a rounding bottom pattern on the 12HR Timeframe, I still believe that we might be heading to retest the 0.618 Fibonacci retracement that we have formed since the January Febuary pump.

Bitcoin - The Crash Will ContinueTake a look at the bitcoin chart and be objective... we are going lower

Bitcoin still in bear controlBitcoin drop from 25000 and reach to 19500 it will drop more to approach support which is around 18200 area in this area the price will have pullback to the nearest resistance

BULLISH PARABOLIC FISHMAGIC is going for reversal soon. We believe that bitcoin will do so aswell, check the profile for more info

BTC Inverse head and shouldersBitcoin is currently following our inverse head and shoulders scenario, except that I think the right shoulder will be a little bit lower which is here 19159 - 18818

Bitcoin headed much lower...Bitcoin has just completed a false breakout. One of the most bearish signals in technical analysis.
I would expect much more pain in the crypto markets going forward as a result.

BTC/USD#bitcoin
impulse correction bitcoin is correcting to continue its rise to its highest levels since 2021
there will be several long-term buying opportunities
$21553
$20407
$19262
$17632
#bitcoin #btc #Cryptocurency #crypto #trading
it's important to note that the cryptocurrency market is highly volatile and subject to sudden price swings that can be difficult to predict. Therefore, it's important to approach any analysis of Bitcoin with caution and to keep in mind the risks involved in trading cryptocurrencies.

BTCUSDT Bullish Scenario Update!We have reached the level that we told you about yesterday. 21770 - 21555


BTC Wyckoff AccumulationLooks as thought BTC is heading for a spring as part of a Wyckoff Accumulation schematic.

Is the bottom actually in? #BITCOIN 🧐I believe we will get our answer very soon on #BTC 25k area is make it or break it. Few Thoughts
- There's Bearish FVG that will need to be filled eventually which is above 25k.
- Reject off of 25. 19-20k is guaranteed, because of 2 bullish FVG that need to be filled .....
- #Bitcoin tends to repeat itself when it comes to price action. The last time we rejected of off that strong high we got knocked down all the way back to 15k.
- If we reject again off of the strong high, we could see price action test that low at 15k.
200 MA is key which aligns with the 25k area ‼ If we convingly lose it the bottom is in.
- With that being said..we lost it before & it was a fakeout & continued to go lower. Which could happen again.
This area 25 is gonna tell us everything.
There has been a couple of times throughout #Bitcoin history where PA was trading above the 200MA for some time.
Ended up being a fakeout & the bottom wasn't in.
So Food for thought, this could very well be one of those times, again.

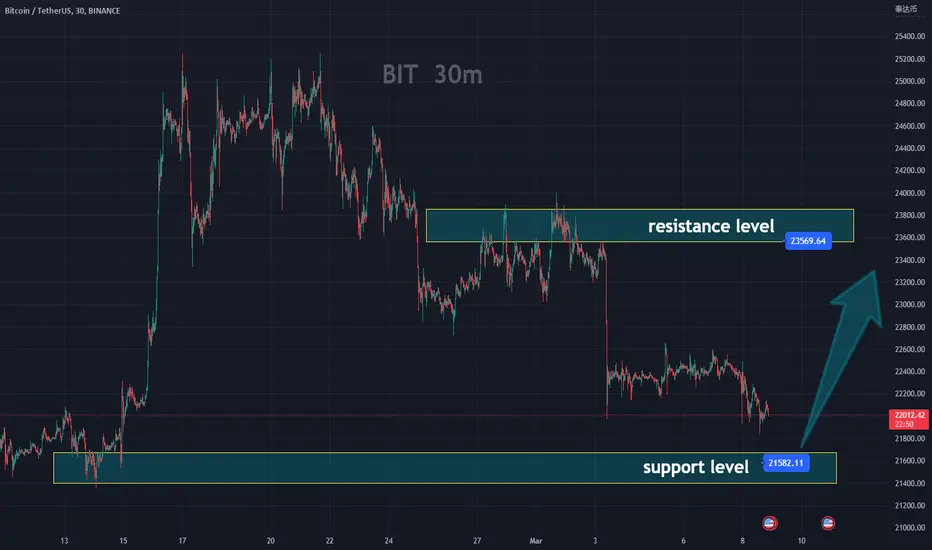
BTC: Short at high levels and long at low levels
Yesterday, Bitcoin fell below the previous low during trading, hitting a new low. This indicates that the first phase of the decline is complete. However, there is a flaw in that it is still 500 points away from the critical support level of 21500. The probability of a rebound at this point is gradually increasing, but since the trend is still bearish, shorting at high levels is still the main strategy.
The trading strategy is to short at 23600, with a stop loss at 24200, and a target of 21500 to 21400. Alternatively, if it falls to 21400, go long with a stop loss at 20900 and a target of 23600.
Don't let past regrets interrupt your current plans, and don't let anxiety and worries disrupt your steps forward.
As winter fades into spring and the sun rises and sets, every moment is precious. By appreciating the present and living each moment to the fullest, we can reap the rewards of a rich and fulfilling life.