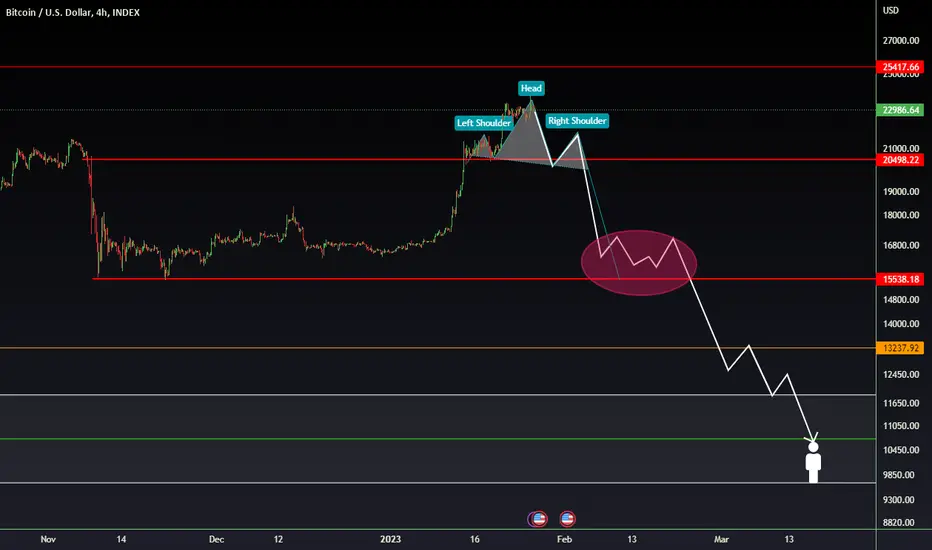
THE BULL RUN, MILLIONS WILL MISS.The chart prints are never a mistake, it is for our learning and direction. BTC to 10k is not happening, don't miss this opportunity to buy when millions will be thinking a little retrace is taking BTC to 10k...Be wise the chart is the only chat you need to interact with, not some gurus.
Bitcointrading

#Bitcoin - thoughts out loud #2 Good afternoon, dear colleagues!
Dear colleagues, I sincerely thank you all for your attention and wish success to everyone!
And remember one thing:
"sometimes you win/sometimes you learn"

Bitcoin Idea |BTCUSDBitcoin - BTCUSD and BTCUSDT
✅ ✅ Risk warning, disclaimer: the above is a personal market judgment and analysis based on published information and historical chart data on The trading view,
And only some of these analyzes are my actual real trades.
I hope Traders consider I am Not responsible for your trades and investment decision.

btcIf we put Bitcoin in a channel in one hour, the number 23128 is an important support, and if this area breaks, lower targets can be seen for the coming days.
But in my opinion, this is a modification for higher purposes

BTCUSD (02/02/2022)Bitcoin Intraday Analysis (Bitsmap):
As we have been able to see in the macro scale of the charts published in previous weeks, the key indicators in the Bitcoin cycles have been warning us of the theoretical price bottom of around 15K.
Today we are going to try to introduce this theoretical bottom with the end of the bear market and the possible introduction in a few weeks of a new period of pre-halving accumulation.
Some of my Intraday indicators to show this proximity to new movements are the ones shown in the chart:
- Exit of the high selling pressure funds in the PA, introducing new touches in the high area (buying pressure)
- Exit from the consecutive lows of RSI introducing new rebounds in the band of maximums or overvaluation.
- First cross of MAs moving averages and closeness to the second bullish cross.
- Temporary end on a logarithmic scale of the bearish stage
----------
Análisis de Bitcoin Intradia (Bitsmap):
Como hemos podido ver en la macro escala de los gráficos publicados las semanas anteriores, los indicadores clave en los ciclos de Bitcoin nos han ido avisando del fondo teórico del precio entorno a los 15K.
Hoy vamos a intentar introducir este fondo teórico con el final del mercado bajista y la posible introducción en pocas semanas a un nuevo periodo de acumulación pre-halving.
Algunos de mis indicadores Intradía para mostrar esta cercanía a nuevos movimientos son los mostrados en el gráfico:
- Salida de los fondos de altísima presión de venta en el PA, introduciendo nuevos toques en la zona alta (presión de compra)
- Salida de los mínimos consecutivos de RSI introduciendo nuevos rebotes en la banda de máximos o sobrevaloración.
- Primer cruce de MAs medias móviles y cercanía al segundo cruce alcista.
- Fin temporal en escala logarítmica de la etápa bajista

Too early to say that Bitcoin has entered a bullish trend?Is it too early to say that Bitcoin has entered a bullish trend? The weekly timeframe suggests that the overall trend might no longer be bearish considering the current price of Bitcoin has broken the upper line of the downward trend line.
A factor that could prevent Bitcoin from moving higher is that it is approaching the 200 EMA period, which could be a strong resistance. Furthermore, there is a supply zone at around $24,300 that could pose a problem for the cryptocurrency's short-term upward trend.
The narrative on the daily chart is almost the same, with the only significant change for a bullish signal being the closure above the 200 EMA period. On the other hand, the RSI indicator is giving an overbought signal. Currently, Bitcoin is in a consolidation phase in the daily timeframe within the range of the Darvas box.

BITCOIN LONGI’m expecting Bitcoin to have a small correction to 21000-21500 for a push up to 25k after the drop.

BTC: This can be it! Since the low on November 22, 2022, bitcoin has already gained over 50% in value. Nothing unusual for the crypto world, but this time it seems to be an impulsive 5-pointer. This means that the bear market may be over.
According to my Elliott wave analysis, we have now seen the low in bitcoin at $15482.03. Should we build a clean 5 divider - meaning bitcoin reaches at least the 261% extension at $23.985 before the next correction, we should see sustained further gains.
Under no circumstances should bitcoin fall below 18377$ before reaching this extension. If that happens, then we are still in a bear market.
What do you think about the bitcoin? Do you think we have already seen the low?

Best Indicator for Crypto TradingBest Indicator for crypto trading is RSI ( Relative Strength Index ) is very necessary for technical analysis . Mostly traders observe the previous market volatility and predict future trends . All cryptocurrencies are run by blockchain technology so traders use this tools to analyses the markets fluctuation. There are many indicator for crypto trading but the relative strength index (RSI) is very popular. It's was launched in 1970s. A tool for traders that can use to observe how market perform and trend . It’s measure the volume and velocity of price momentum and velocity of candles movement. The RSI is very helpful tool and very popular among the professional traders. This is new concept of technical analysis and price predication of future market
Work of RSI Indicator
RSI is best indicator tool for crypto trading. This type of technical analysis trading tool which observe the quantitative of volume and price fluctuation in crypto trading. When momentum increases and price also increases and it gives signal that trade is being ready for buy in market. If trend signs bearish or market fluctuate downside that indicates that market is ready for sell because selling pressure is very high. Visit for more information.

💥 BTCUSD 4H-TIMEFRAME ANALYSIS💥 BTCUSD 4H-TIMEFRAME ANALYSIS
💗Hello ladies and gentlemen
This is my new idea for 💥BTCUSDT BTCBUSD
I hope my idea is clear
Support me by like and share thank you
Stay Safe💯💲💲💲
Good luck💰😍
BTCUSD WEEKLY HOLALYSISAs of the moment WHALES does its job to induce and liquidate most of retail trader. Everything is engineered. I don't think Bitcoin will break 25k-26k zone at the moment so my over all bias still BEARISH, if so happen to break that zone it a clear change of character from downtrend to an uptrend, definitely change my bias too into BULLISH.

BTC Bull FLag >? ? 30 MIN CHART POSSIBLITY Could BTC be in a BULL Flag Pattern? Could we see BTC jump up to the 23985$ LVL ??
I think it's definitely a possibility here!
CHECCK IT OUT ?

BTC LONG MomentumPrepare for smooth rise to 25,200 mark as we observe from historical pattern same similarities.

BTC Bitcoin: Important Support and Resistance LinesHello friends, today I am posting the important Support and Resistance trend lines for Bitcoin (BTC). These are the lines that I keep a close eye on and though there may be more, these are the important ones I focus on. One thing to keep an eye on with Support and Resistance lines is how many times in the past has the price came into that area.
The chart has no other indicators or oscillators shown to keep it simple. I hope you can use this for your charting!
If you enjoy my ideas, feel free to like it and drop in a comment. I love reading your comments below.
Disclosure: This is just my opinion and not any type of financial advice. I enjoy charting and discussing technical analysis. Don't trade based on my advice. Do your own research! #cryptopickk

Bitcoin Eye Cand-yPulling out some tool not used so often in the toolbox. The Red Line or the .236 @ 22.9k is the Resistance and the area to short from.
Using a pitchfork we can see the downward slope we are in with the Orange dotted line denoting the current Lowest Low.
If you use a Composite Index Indicator, you're aware of a drop thats going to occur in the coming day(s). How far it goes is yet to know, though i have my readings.
Honestly, I had previously thought that ~15.5k was were the bottom was going to be and i am keeping an eye on that level.
As it's technically still in play as many other have had that assumption too, though I have my suspicions.
Keep your wits about you, and check the weather, CryptoWhether.

Elliot showing good signsAnother update on $BTC/$USDT coming into this you can expect either a rise to mid $23k or jiggle and go upward of $24.5k and or in those times drop down and potentially hit lows of $19k~ in most likely March April. Not advice finacial or otherwise! Feel free to discuss!

Bitcoin Analysis21.01.2023Hello Traders,
welcome to this free and educational analysis.
I am going to explain where I think this asset is going to go over the next few days and weeks and where I would look for trading opportunities.
If you have any questions or suggestions which asset I should analyse tomorrow, please leave a comment below.
I will personally reply to every single comment!
If you enjoyed this analysis, I would definitely appreciate it, if you smash that like button and maybe consider following my channel.
Thank you for watching and I will see you tomorrow!
You can also check out my previous analysis of this asset:

BTC Price Analysis LONNNGGGG!!Hello and good day to you! Hope all of your trading days are going great!
So here's BTC In a LONG situation.
BTC Needs to hold the 19600-20120 LVL no as support in order to continue on to the upside.
Our next target lvls to watch out for are going to be the 21159-21582 LVLs If broken we could see a test at the 23113 LVL
Then our next MAJOR LVL to look out for will be around the 24300 -25050 LVLs Which have a HUGE line of support..
Happy trading to all :) leave a comment or like, please! I'd love to hear what you think of my ideas! :)
Have an amazing day all!

BTC Bitcoin BTCUSD Breakout Today 18-01-2023 18-jan BTC will breakout soon and may start running.
By : Forex Pharmacy

BTC ANALYZEUntil now, there are no signs of a rise in Bitcoin or the beginning of a strong rise, perhaps we are only in a corrective state
The price is now testing the block order located in the golden zone 0.5-0.61, as we notice that the wike is in today's candle, all of this enhances the possibility of the price rebounding from this area.
We can talk about bullish signs in case the selling top is breached, which broke the last bottom shown in pink.

BTC HOUR ANALYSEBTC HOUR ANALYSE
Until now, there are no signs of a rise in Bitcoin or the beginning of a strong rise, perhaps we are only in a corrective state

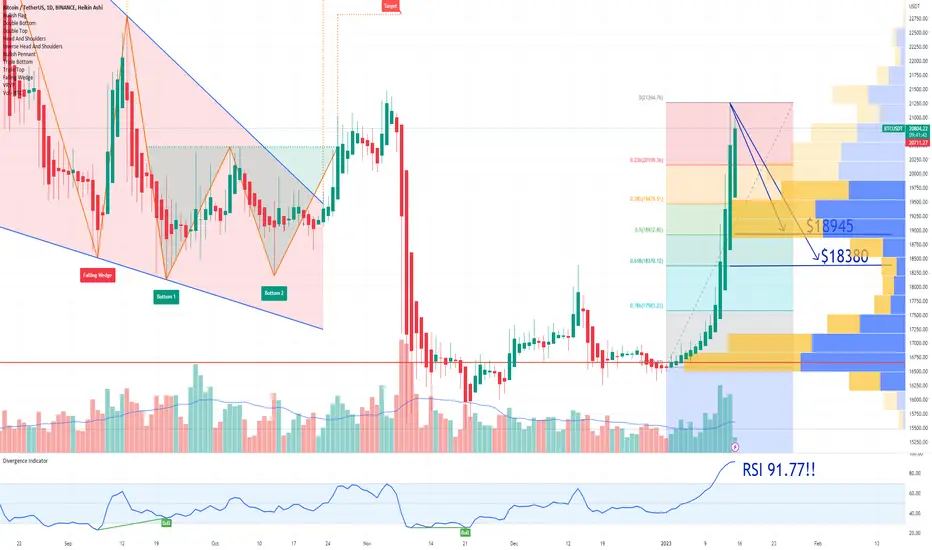
BTC Bitcoin Fibonacci Retracement Price TargetAfter the Santa Claus rally was better then expected:
Now we need to notice that the RSI is extremely extended at 91.77.
Fibonacci Retracement gives us two possible Price Targets for the retracement:
$18945 and $18380.
Looking forward to read your opinion about it.
Bitcoin 2018 Bear Market v 2022 Bear MarketThere is a striking similarity between the 2018 and 2022 bear markets in Bitcoin as illustrated on this chart. This is the same thing I have been discussing for months now on Twitter and YouTube while so many other large influencer accounts were screaming that it HAD to go below $12K. While there is no guarantee that the low is in yet (there are no guarantees in trading except that you WILL lose money at times), there are a number of signals that it very well may be. This is just one of them.
Break out impulsively above the weekly pivot and there should be no looking back.
