BTCUSD (HIGH PROBABILITY SELL SETUP SOON)Hello traders, hope you all are having a good weekend,
Here's a quick brief news update regarding Bitcoin, cryptocurrencies undisputed KING. Bitcoin tumbles to new 18-month low as crypto sell-off accelerates. The world's largest cryptocurrency fell as much as 7.8% to $20.289, its lowest since December 2020. It has lost around 28% since Friday & more than half of its value this year. Since its record high of $69,000 in November, it has slumped about 70%.
Here we can see the clear Divergence on the RSI Indicator from the actual price action on the chart, baring in mind we're using H1 time frame for a clearer view of our analysis, hence we can't predict the duration of the market moves,
Keep a close eye on BITCOIN world's no1 cryptocurrency,
Happy PIP hunting traders.
Bitcointrading

What is the Best Price for Buying BTC? Does it Worth Buying?Since BTC is not an asset or any reliable currency there is nothing I can be sure of. But, with simple Elliott waves and Fibonacci numbers, we can see that 13K and 17K are the best prices for buying BTC. (BTCUSDT chart is saturated in the daily time frame as you see in the published chart)
The problem is how long you should hold your new BTC. Now, let's think with our simple logic.
As you know, interest rates are rising along with inflation in the world. So, high-risk markets including cryptocurrencies are definitely affected by these conditions. I personally think you should buy BTC in 17k with 15% of your investment money (cryptocurrency investment) and then buy 30% in 13k. If I were you I would hold my second buy until BTC reaches about 60k and sold the first buy on the highest point. (However, before selling, it is important to analyze the economy of that date whenever it wants to be)
With all of these things said, it is worth the risk but not more than 20% of your entire investment money on stocks, forex, and crypto.
If there is anything that you think you can add to my published post, please leave a comment.

Bitcoin Next Target $26KWhat a Day on Markets, $BTC breaks With momentum. Next Target is $26K.
All In ;)

BTCUSD intraday trading & flying to the moon🚀 28 JUL 2022Bitcoin intraday trading alert
3 steps must fulfill before entry
1. 1st breakout done
2. Retracement done
3. 2nd breakout and see you in the sky🚀
Hope you like my Trading Alerts~
Cheers~

Bitcoin monthly Timeframe in right place to longBINANCE:BTCUSDT
and now bitcoin in a right place to start buy and hold til around 80000$ .
mention : buy in 5 parts.

IntraDay Trading Strategy Compilation 5 (BTC)Today we are going to propose different movements at the same time, for anyone who can follow them closely and wishes to operate any of this range of possibilities.
First of all I want everyone to understand the larger range pattern that is being formulated, a reverse shoulder head shoulder,
secondly, it seems convenient to me to apply the Elliot wave rule and its tendency to alternation, 3 movements per wave, 5 consequent movements and 3 final movements 3-5-3 = abc-abcde-abc,
Finally, I would like to point out that this structure signals an upward momentum, but within the market with a downward trend, it does not have to happen that way.
I have left multiple ideas for people who want to try operations as is my case, usually I do not operate in such low timeframes,
I prefer to study the behavior and understand the market manipulation by smart money that is much more visible in these intervals.
I hope this idea is of some use to you, if someone operates one of the options and it is good for them to leave it in the comments of the post, I answer everything, whether they are doubts or constructive criticism,
a huge greeting and have a good day.
-------------------------------------------
Hoy vamos a plantear distintos movimientos al mismo tiempo, para todo aquel que pueda seguirlos de cerca y desee operar alguna de esta gama de posibilidades.
En primer lugar quiero que todos entendamos el patrón a mayor alcance que se está formulando, un hombro cabeza hombro reverso, en segundo lugar me parece conveniente aplicar la regla de las ondas de Elliot y su tendencia a la alternancia, 3 movimientos por onda, 5 moviminentos la consecuente y 3 movimientos la final
3-5-3 = abc-abcde-abc, finalmente me gustaría señalar que esta estructura señala un impulso alcista pero que dentro del mercado con tendencia a la baja no tiene porque suceder así.
He dejado múltiples ideas para gente que quiera probar operaciones así como es mi caso, por lo general no opero en temporalidades tan bajas, prefiero estudiar el comportamiento y entender la manipulación de mercado por parte del dinero inteligente que en estos intervalos es mucho más visible.
Espero que os sirva algo de esta idea, si alguien opera una de las opciones y le va bien dejarlo por los comentarios del post, contesto todo ya sean dudas o críticas constructivas, un enrome saludo y que tengáis un buen día.

Bitcoin Analyze (Double Zigzag Correction)!!!(Update)Bitcoin is making Double Zigzag Correction in Main wave Y.
Also, Bitcoin has a chance for making a Head and Shoulder pattern.
Bitcoin Analyze ( BTCUSDT ) Timeframe 12H⏰(Log Scale)
🔅 When Bitcoin breaks the Support Zone(Necking line of Head and Shoulder Pattern), then we can verify the end of microwave 2.
Where is the end of Bitcoin Correction (Main wave A)❗️❓
🎯Target 🎯: 16200$ until 14980$
Do not forget to put Stop loss for your positions (For every position that you want to open).
Please follow your strategy, this is just my idea, and I will be glad to see your ideas in this post.
Please do not forget the ✅' like '✅ button 🙏😊 & Share it with your friends; thanks, and Trade safe

Bitcoin Analyze (Head and Shoulder Pattern/Timeframe 15min)!!!Bitcoin made a Head and Shoulder Pattern on the Heavy Resistance zone, which can signify the end of the bullish rally we saw these days.
In addition, still, we don't hear the good news in cryptocurrency markets ( DXY is bullish, the Stock market is on the correction, the Cryptocurrency market is still in the shock of LUNA, and War is still running (unfortunately), Covid is growing up again, etc.).
Also, Bitcoin can make The Fan Principle Patten.
🔆Fan Principle Patten: This is a very interesting use of the Trend Line-The Fan Principle. This happens when the market is very volatile. In this principle, a trend line is broken and takes resistance at retracement in the uptrend. And the trend line is broken and takes support at retracement in the downtrend. Now a new trend line is formed and these things to continue and another new trend line is formed and repeats this process three times and now the trend is changed. This is an overview of the fan principle Pattern.
Fundamental News: Tesla has just sold $936 Million worth of their crypto assets, most of which were made up of Bitcoin.
🔴Heavy Resistance Zone🔴: 24100$ to 2302$
Head and Shoulder Pattern's Target🎯: Around 21580$
❗️Note❗️: If Bitcoin can break the Heavy Resistance zone, the Scenario will change (Low possible).
Do not forget to put Stop loss for your positions (For every position you want to open).
Please follow your strategy , this is just my idea, and I will be glad to see your ideas in this post.
Please do not forget the ✅' like '✅ button 🙏😊 & Share it with your friends; thanks, and Trade safe.

Bitcoin shortBitcoin broke trough the ascending trendline. Asset broke trough the support level. Bearish movement to support level at 18970 is possible.

Bitcoin BTC short Entry Range, Take Profit and Stop LossBTC /USDT short
Entry Range: $2200 - 23500
Price Target 1: $20900
Price Target 2: $19800
Price Target 3: $18950
Stop Loss: $24400
the big short at $42500

BTC/USD Prediction AnalysisDear all respected Traders and Investors
I made a simple analysis for BTC/USD
I reckon you guys to entry at my sign "entry" and take profit at my sign "Potential Target"
It's almost weekend mate!
Make your own analysis is sounds far better!
Happy trading y'all and good luck!
Enjoy your profit!
PS: Please DYOR before entry the market.
Cheers!

Bitcoin shortBitcoin broke trough off the lower boundary of ascending channel. Asset broke trough off the support level. Bearish movement to support level at 21450 is expected to happen.

BTC Bitcoin last rally before the sell-offI think we are witnessing the last BTC Bitcoin rally before entering the crypto winter by the end of this week.
Next week AAPL will report earnings and if we will see some weaknesses in sales or revisions, that will give a bearish signal to the whole big tech industry.
My Buy Area for Bitcoin is $13160 - $16240.
Looking forward to read your opinion about it.

BTCUSD (19/07/2022)Bull trap complete, we expect a brief pullback to the low liquidity zone of this compressive triangle and even an attempt to break down if everything continues as in this published analysis, we must remember that fear spikes are coming in traditional markets next month with the FED interest rate announcements.
Greetings and I hope this brief analysis will help you.

BTC: Bear Flag Formation In ProcessHello friends, today you can review the technical analysis idea on a 1D linear scale chart for Bitcoin (BTCUSD).
Bitcoin price is currently inside a channel with a bear flag pattern. The measured move of this pattern touches a long-term support area. The Fibonacci Retracement shows the Golden Ratio (1.618) around $3.3K. Price has a strong possibility to come down to the $3K-7K range based on this scenario. Volume will be key for any major move. If the BTC price breaks above the channel moving higher, the bear flag pattern may be invalidated. Be careful of traps along the way. Please be aware that this may take days or months to reach the target so have patience!
Also shown in the chart is Ichimoku Cloud, Volume, RSI, Stoch RSI, MACD, MFI.
If you enjoy my ideas, feel free to like it and drop in a comment. I love reading your comments below.
Disclosure: This is just my opinion and not any type of financial advice. I enjoy charting and discussing technical analysis. Don't trade based on my advice. Do your own research! #cryptopickk

bitcoin buy position 4h timeframein this position we can buy bitcoin
risk is low
r/r is so good
my insta: fp_forex

SELLING BITCOINYeah due to a long consolidation that can clearly be seen in H4 and H1 timeframe its clearly that bitcoin has failed to break out the consolidation area and it has formed a reversal candlestick at the resistance zone so we are now looking to short it.

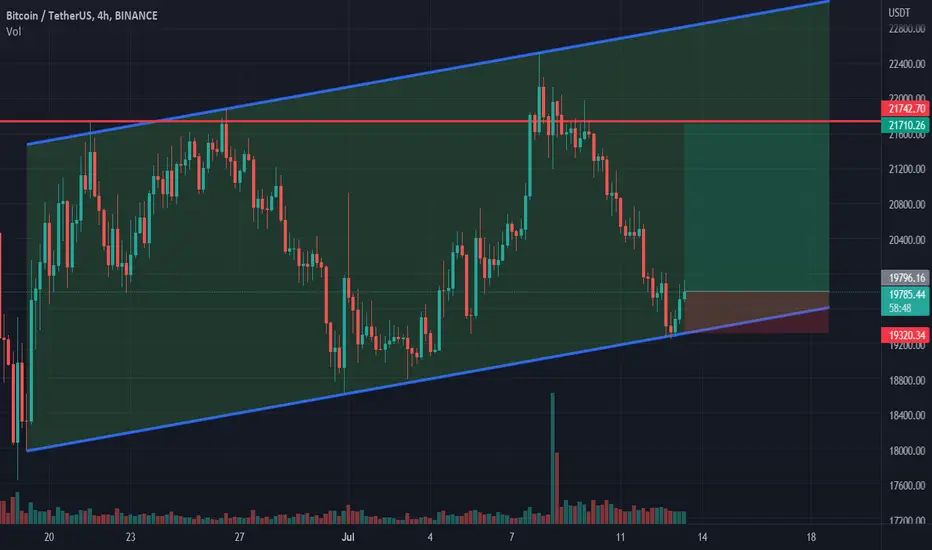
BTC Support Looking Good at $20kContinuing on the idea I initially published on 6/22, $20K is increasingly looking like support for BTC. Look at the series of higher highs and lower lows that have been recently occurring on the 4H chart.
In my previous entry I scaled in at $20k and sold at $21.5k. I'm looking to make a similar move now that BTC has reverted back to this support level again.
As mentioned before, the macro environment is still rough and it is wholly possible that we break below $20k. My next level of entry to scale in further will be $18k. However at this point I have no stop losses set below $20k.

Bitcoin Analyze (Counting Waves /Timeframe 15min)!!! (Update)All my previous Ideas run well ✅
It seems that Bitcoin passed main wave 1 and is now on the way to completing main wave 2.
Do not forget to put Stop loss for your positions (For every position that you want to open).
Please follow your strategy, this is just my idea, and I will be glad to see your ideas in this post.
Please do not forget the ✅' like '✅ button 🙏😊 & Share it with your friends; thanks, and Trade safe

Bitcoin longBitcoin bounced off the lower boundary of ascending channel. Bullish movement to resistance area at 21700 is possible.
Symmetrical Triangle breakdown can take Bitcoin price to $17,000Bitcoin price was unable to hold the support line & printed a low $19,221 yesterday. A clear breakdown & retest of symmetrical triangle can be seen on the chart. Previously, on June 4th a breakout & retest was witnessed & then price rallied all the way up & met the target of 17%.
This time the distance of symmetrical triangle is 11.54%. If it follows the same pattern then price call fall till $17,094. This structure will be invalidated if 4H candle of BTC closes above $20,080.
Today, CPI reprot will be released. Market ca be highly volatile. Overall, chart looks bearish.

BTC Bear Flag Pennant In ProcessHello friends, today you can review the technical analysis idea on a 1D linear scale chart for Bitcoin (BTCUSD).
Bitcoin price is currently inside a pennant pattern with a bear flag formation so ultimately a Bear Flag Pennant. The measured move of this pattern touches a long-term support line around $7K. The Fibonacci Retracement shows the Golden Ratio (1.618) around $3.3K. Price has a strong possibility to come down to the $3K-7K range based on this scenario. Please be aware that this may take days or months to reach the target so have patience!
Also shown in the chart is Ichimoku Cloud, Volume, RSI, Stoch RSI, MACD, MFI.
If you enjoy my ideas, feel free to like it and drop in a comment. I love reading your comments below.
Disclosure: This is just my opinion and not any type of financial advice. I enjoy charting and discussing technical analysis. Don't trade based on my advice. Do your own research! #cryptopickk

Bitcoin`s worst case scenario playing outI`ve noticed the huge head and shoulders chart pattern here:
now i believe that BTC was rejected by the resistance and is heading beck to $17900.
The chart is self-explanatory.
Looking forward to read your opinion about it.
