BTC Bitcoin: 1D Chart ReviewHello friends, today you can review the technical analysis idea on a 1D linear scale chart for Bitcoin ( BTCUSD ).
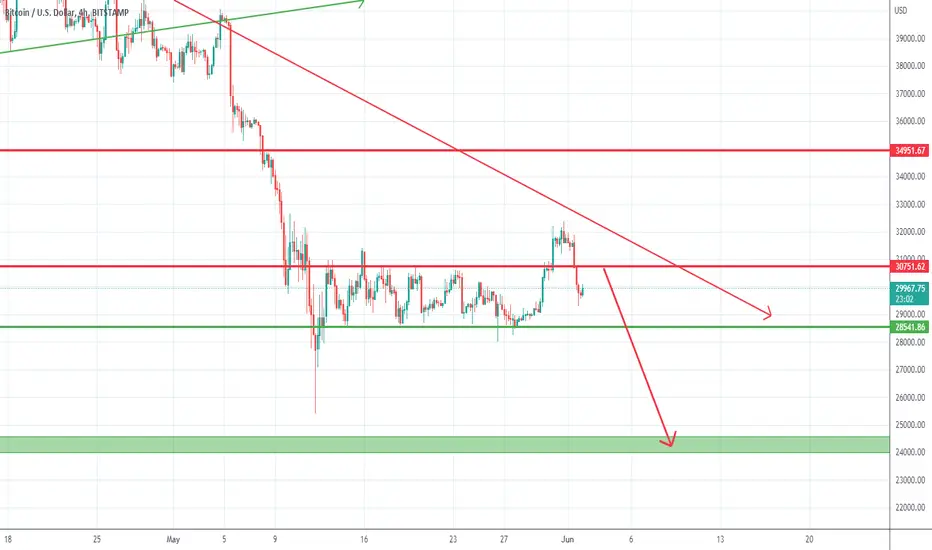
BTC Price looks like it is headed back up to the S/R line. If it can break above the line, it has a chance to go up to the $36K-$38K region, but if it fails the S/R line, it is coming down to $28K region first then even as low as $20K-$22K.
The Support and Resistance Line is very important to pay attention to before considering a move. I've added in the RSI and EMA in the chart.
If you enjoy my ideas, feel free to like it and drop in a comment. I love reading your comments below.
Disclosure: This is just my opinion and not any type of financial advice. I enjoy charting and discussing technical analysis . Don't trade based on my advice. Do your own research! #cryptopickk
Bitcointrading

Bitcoin BTC short Entry Range, Take Profits and Stop LossBTC/USDT short
Entry Range: $29375 - 30712
Take Profit 1: $28625
Take Profit 2: $27955
Take Profit 3: $36500
Stop Loss: $31714

Bitcoin - range trading Bitcoin continues the price action with low volume, low retail interest and small movements. The best you can do in this situation to preserve your wealth is to just trade the ranges. There are 3 clearly visible and very strong channels, which you can trade now:
1. LOW RANGE - currently we are sitting in this range. 28000 - 32000$, long the support and short the resistance - simple as that. Beware of spikes in both directions and use a proper stop-loss. If the support is broken (with a daily close below 28000$) I expect a retest of previous all time high around 20000$.
2. MIDDLE RANGE (32000 - 37500$) - a range that can be very interesting, because we have many major resistances in between. MA100 and MA50 on the daily are located around 34000$ and could change the game in the range.
3. UPPER RANGE (37500 - 48000$) - this is the range before new bullish momentum and a new all time high respectively. This is the place you would like to be, but I don't see it in the near 2-3 months.
TRADE SAFE!

btcusdt - Bullish trend - day 18 In this video, I was talking about the beginning of a trend
What do you think of this idea? What is your opinion? Share it in the comments📄🖌
If you like the idea, please give it a like. This is the best "Thank you!" for the author 😊
P.S. Always do your own analysis before a trade. Put a stop loss. Fix profit in parts. Withdraw profits in fiat and reward yourself and your loved ones

BTC Consolidation AreaThe past price action of Bitcoin told us that buying in the MicroStrategy average price area was a good idea.
Let`s see how it plays out this time.
Looking forward to read your opinion about it!

Bitcoin- Down again after the false break?Bitcoin is trading in a range for 3 weeks now and although it had a break of resistance on Monday, this proved to be a false one and the main cryptocurrency fell under this again.
Usually, after a false break in one direction, the asset will have a real break in the other direction, and if this holds true also in this case, Bitcoin could fall again under 27500 and test 25k.
My outlook on the short term is bearish Bitcoin at this moment and only the price above 32.500 would make me change my mind
Bitcoin BEARISH?! Here is the ANSWER. Disclaimer: This is a Newbie analyses with no past Experience!
Few Points Supporting a BEARISH scenario for Bitcoin and the rest of coins:
-The Chart above shows the total Cryptocurrency market cap, which hints to a similar crash of 2018 being repeated (Green Rectangle/Red Rectangle).
-Recession, which it has started already (low GDP growth, High interest rates, Spike in the price of goods and services in general, lower properties being sold)
-War (Ukraine x Russia)
With all this considered, we might see Bitcoin plummeting to 21k (USD) Level, and even 11k level later on.
However, this is the first time in history that Cryptocurrencies are faced with a recession, hence the effect is unknown. They might follow the stocks behaviour during a recession (Falling, Most Likely). OR, we might see that more people are investing in crypto and choosing it as a safer asset during recession (less likely).
This is not a financial advise!
Please comment your ideas about the analyses as I am new and want to learn from your experience and knowledge.
Appreciate your constructive comment and feedback in advance.

Bitcoin - The party is over!Looking at 1A. on the 4-hour timeframe we can see that Bitcoin has run into the 200 MA (Moving Average) putting an end to the party for now. If BTC has enough buyers at this price point it will continue to move up, but it will encounter heavy resistance 1B. This is where sellers may show up and could put us back into the range. This is the main battle zone for now (the 4H timeframe.) If BTC gets over the 200MA it will go for an actual test of strength.
What we've seen over the last few days does in fact resemble a bottom, but there are a few unresolved issues that need to play out for this to be a legit bottom. I would be cautious at this point and wait for strength going up to confirm that in fact we did hit bottom.
The main issue: I would like to see Bitcoin get a bit closer to the white line (the 200MA on the 1 week timeframe).
Something to think about: This is the stage of the game where you can really make a lot of money, this is where the discipline and experience come in. If you have any capital left to invest you have to time it just right, pick one of the top market cap coins and wait to see if we go lower. If we do not and in fact we have hit a bottom then the first pull-back should be a safe place to jump in.
VERY IMPORTANT: Hitting the "Like" button is like a tip, please don't forget to do so after reading, this is your way of thanking me for my time and so I thank you for yours.

Bitcoin: Just a Little Bit MoreIn accordance with our primary scenario, Bitcoin has climbed higher into the orange zone between $30460 and $34790. Now, we expect it to rise a bit more still to finish wave iv in orange. Afterwards, Bitcoin should turn around and move downwards, falling below the support at $26591 and into the magenta zone between $24055 and $18897 to complete wave v in orange and in magenta. There is a 35% chance, though, that Bitcoin could gain momentum and soar above the orange zone, crossing the resistance at $40809 in the process.

You Cannot Ignore This Signal For Market BottomHi friends hope you are well and welcome to the new update on Bitcoin.
Bitcoin's history shows that, whenever it breaks down the weekly Ichimoku cloud then from between the cloud and the weekly 200 simple moving average, it starts the next mega bull run.
But this time there are two major supports that are not letting Bitcoin to test the weekly 200 SMA after breaking down the Ichimoku cloud. Now another indicator is signaling a major Bitcoin bottom, while it BTC at the support of wedge.

"Great opportunity" Best Entry Zone for Bitcoin To 100K !!!The Price will spend his downside move into Big channel
The level 36000-37000 is the best Entry Zone to go long With bitcoin
For long terme (12-24 months) to reach a 100K level !!!
this analyse will be canceled if any Closing Day below 33000 USD Level

BITCOIN - ABILITY To Finalize HUGE DOUBLE-BOTTOM, $35K!Hello,
Welcome to this new analysis about Bitcoin and the 4-hour timeframe perspectives. In recent times, Bitcoin has disrupted the whole market development and has shown up with heavy volatilities while now it seems these initial volatilities are stabilizing and Bitcoin is attempting crucial levels from where a shift in the market has potential to show up. The Luna-Crash-Developments and the Altcoin-Market Movements have shown how volatile the Cryptocurrency Market can be and now it is time for the remaining Cryptocurrencies within the market to show how they approach further. From a fundamental perspective, the sentiment looks quite positive as during these crash developments major economic entities continued to adopt Bitcoin such as the Central African Republic making it a legal tender, luxury brands like TAG Heuer or Balenciaga accepting Bitcoin or JP Morgan Chase making Bitcoin the "Preferred Alternative Asset".
As these developments have a positive impact on Bitcoin on a broader timeframe perspective it is also crucial to look at the technical side of things and in this case, I detected that there is potentially given for Bitcoin to show up with an initial relief-rally with which Bitcoin has the possibility to test remaining resistance which is still given. Although this does not mean Bitcoin will directly turn bullish on all aspects thinkable it should be considered as a silver lining to which Bitcoin can add when the developments are moving positively. When looking at my chart Bitcoin is forming this potential double-bottom which it already completed similarly once between the 22Nd of June and the 20St of July. All the elements are given within this second fractal together with the Descending-Wedge-Formation, the Double-Bottom-Structure, and the 65-EMA as the final Validation-Turning-Point:
First Double-Bottom-Fractal-Structure Completed Between 22Nd Of June And 20St Of July:
Now when looking at these amazing similarities in the Double-Bottom-Fractal-Structures there is a high likelihood potential given that Bitcoin has the ability to complete this second Fractal again similarly as it has done already once. Nevertheless, this does not mean Bitcoin will turn 100% bullish because although once the formation has been completed the $35,000 USDT target-zone will be in play there is still a massive resistance within this zone and as the legit Double-Bottom-Targets will be reached it can turn out for Bitcoin to just move into this massive resistance and from there on the pullback and continue its alignments onto the bearish side. Therefore, it will be highly determined on how Bitcoin moves into these zones and how it develops from there on, especially in a Middle-To-Long-Term-Approach the bearish technical scenario is still present and should be contemplated before the reverse has been validated.
In this manner, thank you for watching the analysis, all the best!
"If fortune is regarded as the reward of virtue, it will be regarded as the attribute of virtue."
Information provided is only educational and should not be used to take action in the markets.

Bitcoin cycle bottom (October - December) - Target 10000 - 14000This idea works for both shorting to the bottom, and longing from the bottom into a 3 year bull cycle - as seen in previous BTC 4 year cycles.
PREVIOUS TARGET : My 2020 BTC top time frame prediction was 2 weeks from the absolute top, and my target missed by 8000 in terms of price (78k lower end target vs 70k realized). That said I did take a lot of profits between 40k - 60k, to not miss the absolute top.
FUTURE TARGET: Bitcoin cycle bottom estimation (October - December) - absolute bottom Target 10000 - 14000 at the lower band of Yope BTC virus channel. Combined with previous cycle 593 days estimate from BTC 2024 halvening to the bottom to find a possible bottom for this ongoing Bitcoin cycle.
Personally I will look into DCAing at ~21k, 18k, 16k, 14k, 12k - just to not miss the absolute predicted bottom. I will also buy into ETH at the same time frames because they are following each other closely. I give ETH a weight of 70% and BTC 30% in terms of how heavy I plan to buy in. Will also look at coins like SAND as a buy in the same time frames.
From there, BTC goes into a ~1 year sideways range, and 2 year of upside trend again, which I will be attempting to long from the bottom.
NFA

Bitcoin still not decided which way to goBitcoin is going sideways for a while and may continue this path for longer time. Right now it doesn't look good to enter a trade, I would rather stay away until we get better signals. It may go down to 28K before the weekend, and if it does, it may continue the downtrend as the weekend is no good for trading.
Just stay aside and wait for trend confirmation.


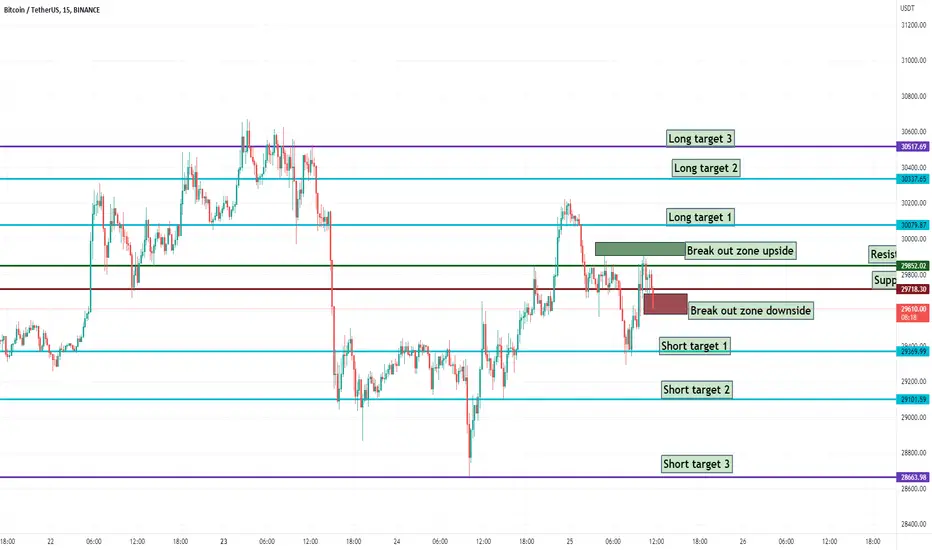
Daily range, supports and resistances !
I hope you are all well !
The range is between 30 517$ and 28 663$
we got a support at 29 743$ and a resistance at 29 852$.
Be ready for the long breakout zone colored in green and the short breakout zone colored in red.
Long targets are : 30 079$, 30 337$ and 30517$.
Short targets are : 29 369$, 29 101$ 28 663$.
Be careful in your trading and don<t forget to subscribe, I will do range, supports and resistances analysis everyday.
Thanks
-Frank
Bitcoin BTC Entry Range, Take Profits and Stop LossBTC/USDT
Entry Range: $28880 - 30300
Take Profit 1: $32000
Take Profit 2: $33845
Take Profit 3: $36500
Stop Loss: $26550

A clean break above 29650 will send BTC to test 30700 againBTC found support at the bottom of the channel and has enterend back into the flag. Now it just needs to clear the midline


Bitcoin is bouncing off support and moving towards resistance.Hi Guys
The chart shows BTC vs USDT on the 8 hourly on Coinbase.
Bitcoin is bouncing off the June 2021 ATL (Green Horizontal Line), which is seemingly providing a level of support so far.
Bitcoin is about to re-enter a downward parallel channel (Red Lines) in which you can see has formed strong price points (support/resistance) with the white highlights.
Breaking this channel with strong volume would be a bullish move.
Right now we are getting a lot of side action but it will have to end at some point.
What are your thoughts guys, bullish or bearish?
Like if you agree.
Many thanks,
Casey
Disclaimer: Not professional Advice

BTC Update - Next Target @ $25,000The 4 Hour chart is over bought.
Momentum is dying and it looks like BTC will be on its way down soon.
Opening longs here might not be the best idea while inside this bear flag / pennant however you want to look at it.
Small bounce expected once it hits #5.
Entry Between:
$30,791.00 - $29,414.00
Take Profit:
TP 1 - $26,736.10
TP 2 - $25124.80
Stop Loss:
$31,262.00
If you'd like me to analyse any other crypto send me a message or leave a comment 👍🏽
Happy trading!
Not Financial Advise. Do Your Own Research.

Btc Bitcoin technical analysisBTC remains determined to complete its pattern.
Accordingly, I think of the possibility of throwing a needle in the fib 1.27 region, which I show on the chart.
Most likely the price will find support at fib 1.13. But I expect a spike to fib 1.27.
In this case, our price expectation may be in the range of 23K and 18K. In the previous analysis, I gave a detailed explanation on this subject.
Although this decline may seem sad, it may actually herald the end of the bear season. Because all things exist as inseparable and contradictory opposites
I think the next pattern will appear again as a harmonic pattern.
