Bitcoin Teeters on $80K Edge: Will It Hold or Fold?Bitcoin is currently priced at $81,145, reflecting a volatile recovery after dipping to $78,000 recently. This movement comes amid a broader cryptocurrency market downturn, with the total market cap dropping 4.4% in the last 24 hours, dragging down major altcoins and fueling a cautious mood among traders. The lack of strong bullish momentum suggests Bitcoin may struggle to push higher unless market sentiment shifts significantly.
Technical Indicators and Key Levels
Technically, Bitcoin is hovering near a pivotal support at $80,000, a level with both psychological and historical significance. The price is trading below the 20-period moving average of around $81,500, signaling a short-term bearish tilt. The Relative Strength Index (RSI) at 45 shows neutral momentum, with no immediate signs of exhaustion in either direction. Resistance looms at $82,000, a barrier that previously halted upward moves. A decisive move above this level could spark optimism, but failure to defend $80,000 risks further declines.
Potential Scenarios and Trading Considerations
Two scenarios dominate the 1-hour chart. A hold above $80,000, followed by a break past the 20-period moving average, could pave the way for a push to $82,000, especially if volume picks up to validate the move. On the flip side, a drop below $80,000 might accelerate selling, targeting $78,000 or even $75,000, particularly if volume surges on the downside. Given the current volatility, traders should prioritize tight stop-losses and avoid excessive leverage to manage risks effectively.
Broader Context and Final Tips
Despite short-term uncertainty, Bitcoin’s long-term uptrend remains intact, as historical patterns suggest resilience over time. However, external triggers, like regulatory updates or economic data such as upcoming US inflation figures, could sway the market in either direction. Traders should monitor volume closely for confirmation of any breakout or breakdown and focus on how Bitcoin reacts at $80,000 support and $82,000 resistance. Staying disciplined, keeping risk in check, and adapting to real-time developments will be critical in this setup.
Note: Volume spikes are your cue, watch them to confirm any significant price action.
BTC

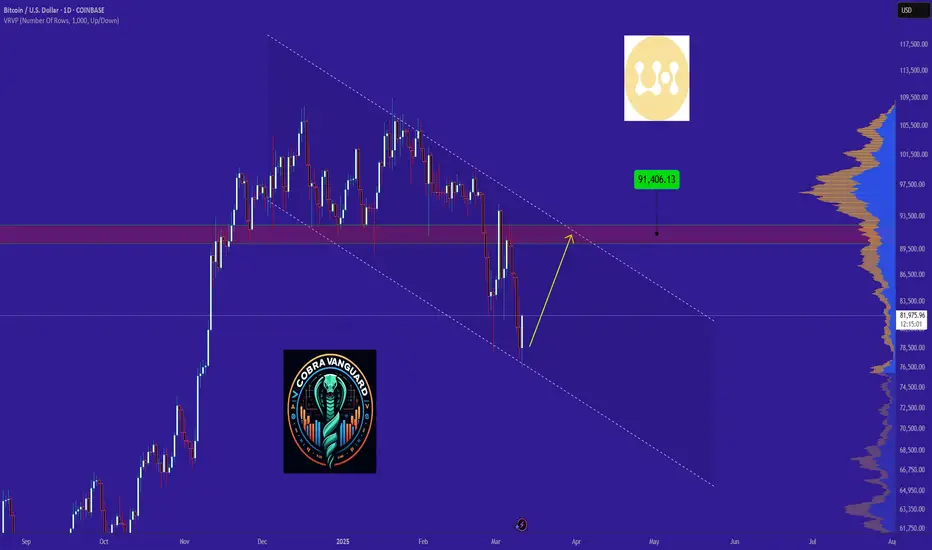
Bitcoin can fall to buyer zone and then start to growHello traders, I want share with you my opinion about Bitcoin. A while ago, the price entered a downward channel, where it immediately rebounded from the resistance line and dropped to the resistance level, which aligned with the seller zone. After that, BTC bounced back up, rising to the resistance line of the channel before falling to the support line. However, it quickly climbed back to the seller zone before continuing its decline within the downward channel. Later, the price reached the 99000 resistance level, reversed, and dropped to the support level, which coincided with the buyer zone. Eventually, it broke through this level, exiting the downward channel. After that, Bitcoin started trading within a triangle pattern, where it made a sharp upward impulse from the support line to the resistance line, followed by a correction to the 84400 support level. Recently, BTC rebounded from this level and attempted to grow but failed, and now it is trading near the support line of the triangle. In my view, Bitcoin could decline to the buyer zone, breaking out of the triangle pattern before beginning a new upward movement. Based on this, my target is set at 93000. Please share this idea with your friends and click Boost 🚀

Bitcoin will reach at $221,0001. Overview of the Chart
Asset: Bitcoin (BTC) / USD
Timeframe: Daily (D)
Platform: TradingView
Date Range: Approximately mid-2023 to March 11, 2025
Current Price (as of Mar 11, 2025): $76,697.39 (shown in the top right corner)
2. Price Movement
Historical Trend: From mid-2023 to late 2024, Bitcoin shows a steady uptrend with some corrections. The price rises from around $25,000–$30,000 to a peak near $100,000 by late 2024.
Recent Action: After hitting a high around $100,000 in late 2024, the price corrects downward, dropping to around $75,000–$80,000 by early 2025. The current price as of March 11, 2025, is $76,697.39, indicating a slight recovery or stabilization after the correction.
3. Technical Patterns
Ascending Triangle
Formation: The chart shows an ascending triangle pattern from mid-2024 to late 2024. This pattern is characterized by:
A flat resistance line around $95,000–$100,000 (the horizontal line where the price struggles to break through multiple times).
An ascending support line (sloping upward), indicating higher lows as buyers step in at progressively higher prices.
Breakout: In late 2024, the price breaks above the resistance of the ascending triangle, reaching a high near $100,000. This breakout is typically a bullish signal, often leading to a continuation of the uptrend.
Target Calculation: The target for an ascending triangle breakout is often calculated by measuring the height of the triangle (from the base to the resistance) and projecting it upward from the breakout point. The height of the triangle appears to be roughly $30,000 (from the base around $65,000 to the resistance at $95,000). Adding this to the breakout point of $95,000 gives a target of approximately $125,000. However, the price only reached around $100,000 before correcting, suggesting the breakout may not have fully played out or was interrupted by market conditions.
Trendline
Upward Trendline: A long-term upward trendline (drawn in orange) connects the higher lows from mid-2023 onward. This trendline has acted as support during the uptrend.
Current Position: As of March 11, 2025, the price is testing this trendline around the $75,000–$80,000 level. This is a critical area to watch, as a bounce from this trendline would confirm continued bullish momentum, while a break below could signal a deeper correction.
4. Support and Resistance Levels
Support:
The long-term trendline around $75,000–$80,000 is a key support level.
If this trendline fails, the next significant support could be around the base of the ascending triangle, near $65,000.
Resistance:
The previous all-time high around $95,000–$100,000 is now a resistance zone. The price struggled to break above this level multiple times before the breakout and may face selling pressure if it approaches this zone again.
5. Price Action Analysis
Post-Breakout Correction: After breaking out of the ascending triangle, Bitcoin hit a high near $100,000 but failed to sustain the momentum, leading to a correction. This is not uncommon after a breakout, as markets often pull back to retest previous resistance (now support) or other key levels like the trendline.
Current Position: The price is at a critical juncture as of March 11, 2025. It’s testing the long-term trendline support around $76,000. The fact that it’s holding above this level (at $76,697.39) is a positive sign for bulls, but confirmation of a bounce with strong volume would be needed to signal a resumption of the uptrend.

Bitcoin Tests Resistance: Will the CME Gap Get Filled?Bitcoin ( BINANCE:BTCUSDT ) continued its downward trend as I expected in the previous post , but over the past 12 hours , Bitcoin has started to increase from Potential Reversal Zone(PRZ) . The question is whether this upward trend will continue in the past few hours or not !?
-------------------------------------------------------------------------
JOLTS Job Openings & Its Potential Impact on Bitcoin
The JOLTS Job Openings report will be released today, March 11 . It provides key insights into the U.S. labor market . This data can influence the Federal Reserve’s monetary policy stance , impacting risk assets like Bitcoin.
Potential Impact on Bitcoin :
Higher-than-expected job openings : Signals labor market strength, increasing the likelihood of Fed tightening → Bearish for Bitcoin
Lower-than-expected job openings : Suggests labor market weakness, increasing the odds of rate cuts → Bullish for Bitcoin
Historical Influence :
In previous months, JOLTS data has triggered volatility across financial markets, including crypto. For instance, a sharp decline in job openings last year led to a weaker dollar and Bitcoin rally. Conversely, stronger-than-expected job numbers have reinforced hawkish Fed expectations, pressuring Bitcoin.
I believe there's a higher probability that the JOLTS report will come in weaker than expected, which could lead to a short-term rally in Bitcoin and gold. However, if the report is stronger than anticipated, we might see temporary selling pressure in the market. What is your idea!?
Today's positive news was " Trump Plans Order to End Crypto Banking Restrictions ". In general, Trump's statements no longer affect the crypto market as much as before. Do you agree with me?
-------------------------------------------------------------------------
Now let's take a look at the Bitcoin chart on the 1-hour timeframe and use technical analysis tools .
Bitcoin is moving in the Resistance zone($84,130_$81,500) and near the 200_SMA(Daily) .
According to Elliott Wave theory , Bitcoin has completed five down waves , and we should wait for the next up waves . One of the signs of the end of wave 5 is the presence of a Regular Divergence (RD+) between two consecutive valleys .
According to the above explanation , I expect Bitcoin to re-attack the Resistance zone($84,130_$81,500) after a downward correction and attempt to fill the CME Gap($86,400_$84,200) .
Note: If Bitcoin can move above $87,200, we can expect the start of an uptrend.
Note: We should expect a bigger drop if Bitcoin falls below $72,000.
Please respect each other's ideas and express them politely if you agree or disagree.
Bitcoin Analyze (BTCUSDT), 1-hour time frame.
Be sure to follow the updated ideas.
Do not forget to put a Stop loss for your positions (For every position you want to open).
Please follow your strategy and updates; this is just my Idea, and I will gladly see your ideas in this post.
Please do not forget the ✅' like '✅ button 🙏😊 & Share it with your friends; thanks, and Trade safe.

Nothing !!!Maybe this pattern(V) will happen again...
Give me some energy !!
✨We spend hours finding potential opportunities and writing useful ideas, we would be happy if you support us.
Best regards CobraVanguard.💚
_ _ _ _ __ _ _ _ _ _ _ _ _ _ _ _ _ _ _ _ _ _ _ _ _ _ _ _ _ _ _ _
✅Thank you, and for more ideas, hit ❤️Like❤️ and 🌟Follow🌟!
❗Disclaimer
⚠️Things can change...
The markets are always changing and even with all these signals, the market changes tend to be strong and fast!!
BITCOIN Is this the last defense before the narrative changes?Bitcoin (BTCUSD) got yet again increasingly volatile during the weekend and is approaching the 1W MA50 (blue trend-line). As mentioned on the title, this is "the last defense" for BTC as so far this price action hasn't diverged a bit from the Channel Up of the 2015 - 2017 Bull Cycle but a break and 1W candle close below it, would jeopardize that.
** The key 1W MA50 **
In fact the only times that Bitcoin closed below its 1W MA50 during a Bull Cycle and the Cycle continued was of course during the March 2020 COVID global market flash crash and November 18 2019. But the current Bull Cycle is nothing like in 2019 - 2021, it doesn't have the initial overextension of the Libra hype (May - June 2019) or Elon's early 2020 hype nor of course the pandemic shutdown. On the contrary it is incredibly similar with 2015 - 2017 with the only difference being that, thanks to the ETF launch in January 2024, the market marginally breached the previous All Time High (ATH) earlier.
** Symmetry playing out **
So back to the similarities between those two Cycles. The Cycle count indicates that we are at the end of the (blue) Bull Rectangle in March 2017 (847 days) when the price almost tested the 1W MA50 and then started the (green) Parabolic Phase to new ATHs (217 days). Even in terms of 1W RSI and MACD, the two fractals are similar, with the RSI being on its 2nd 'Buy the dip Volatility Phase' bottom and the MACD on its 2nd Bullish Cross.
** How high can it get? **
Now as to how high the new Cycle Top can be, can be anybody's guess, but if it repeats the less aggressive 2021 Top, it could be on the 1.618 Fibonacci extension, i.e. around $170k, while if it repeats the (much more unrealistic for such short period of time in terms of market cap) 2017 Top, it could be on the 2.382 Fib ext, i.e. around $520k. The worst case scenario is to have Fib extension Tops on a decreasing rate, in which case the 1.5 - 1.382 levels are next, giving us a potential target range of 120k - 145k, which would be almost a Double Top similar to November 2021.
So what do you think? Will the 1W MA50 come to Bitcoin's rescue yet again or the narrative will change this time? Feel free to let us know in the comments section below!
-------------------------------------------------------------------------------
** Please LIKE 👍, FOLLOW ✅, SHARE 🙌 and COMMENT ✍ if you enjoy this idea! Also share your ideas and charts in the comments section below! This is best way to keep it relevant, support us, keep the content here free and allow the idea to reach as many people as possible. **
-------------------------------------------------------------------------------
💸💸💸💸💸💸
👇 👇 👇 👇 👇 👇

HelenP. I Bitcoin can small correct and then continue to growHi folks today I'm prepared for you Bitcoin analytics. Looking at this chart, we can see that the price rebounded from the resistance zone and dropped to the support level, eventually reaching the trend line. After that, it reversed and started moving upward within a triangle pattern, where it soon broke through the 80400 support level before climbing to the resistance level. Shortly after, BTC broke this resistance as well and surged to 94700, before pulling back to the trend line, breaking through the 88500 level. However, the price then bounced off the trend line and quickly climbed back to the resistance line of the wedge, breaking the resistance once again. It traded near this level for some time before starting to decline, eventually dropping to the support level, breaking the resistance level, and exiting the triangle pattern. Recently, BTC has shown signs of recovery, and in my view, it may make a slight correction before continuing its upward movement toward the trend line. Based on this scenario, my goal is set at 86700, which aligns with this trend line. If you like my analytics you may support me with your like/comment ❤️

Powell’s Speech & Bitcoin’s Decline: Is More Downside Ahead? Today, Fed Chair Jerome Powell is set to speak, and traders should brace for potential market volatility! Given the recent economic data , his tone is likely to be balanced but leaning hawkish .
Why a More Hawkish Powell?
1- Strong Job Market :
Unemployment Rate : 4.1% (Still low)
Non-Farm Payrolls (NFP) : 151K (Decent, but lower than before)
Average Hourly Earnings : 0.3% (Steady wage growth)
This suggests that the labor market remains resilient, which might discourage the Fed from cutting rates too soon.
2- Inflation Still a Concern :
Wage growth and inflationary pressures persist, which means Powell may emphasize keeping rates steady longer to combat inflation.
3- Markets Are Too Optimistic on Rate Cuts :
Investors are heavily betting on rate cuts in 2024, but Powell may push back against these expectations to prevent excessive risk-taking.
Powell will likely maintain a cautious yet hawkish stance to manage expectations. Big price swings are expected across forex, crypto, and commodities—so stay alert! (Of course, this is just a personal analysis).
In addition to Donald Trump , Signs Executive Order to Create Bitcoin Strategic Reserve
Of course, today, we didn't see any strange movement in Bitcoin, and probably, the proverb " buy the rumor, sell the news " was fulfilled.
----------------------------------------------------------
Now let's take a look at the Bitcoin chart on the 1-hour time frame and also take help from technical analysis tools .
Bitcoin ( BINANCE:BTCUSDT ) is in a Heavy Resistance zone($93,300_$89,250) and has started to decline from Potential Reversal Zone(PRZ) .
From a Classic Technical Analysis , Bitcoin appears to move in a Symmetrical Triangle .
According to Elliott Wave theory , Bitcoin has completed the Double Three Correction(WXY) , and we should wait for the next bearish wave .
I expect Bitcoin to attack 200_SMA(Daily) again after breaking the lower line of the Symmetrical Triangle .
Note: Bitcoin is likely to pump more if the symmetrical triangle's upper line breaks.
Please respect each other's ideas and express them politely if you agree or disagree.
Bitcoin Analyze (BTCUSDT), 1-hour time frame.
Be sure to follow the updated ideas.
Do not forget to put a Stop loss for your positions (For every position you want to open).
Please follow your strategy and updates; this is just my Idea, and I will gladly see your ideas in this post.
Please do not forget the ✅' like '✅ button 🙏😊 & Share it with your friends; thanks, and Trade safe.

BITCOIN Great Investment Opportunity! Buy!
Hello,Traders!
BITCOIN keeps falling down
In a strong correction move
But the coin will soon hit a
Massive key horizontal
Demand level of 72,500$
From where a bullish
Rebound and a move up
Is likely to happen
Buy!
Comment and subscribe to help us grow!
Check out other forecasts below too!
Disclosure: I am part of Trade Nation's Influencer program and receive a monthly fee for using their TradingView charts in my analysis.

Bitcoin - Short after pullbackBitcoin - Short after pullback
price took swing low
at this moment better to creat a pullback and after look for a new short


Bitcoin (BTC): Double Top Pattern / Wait For Neckline BreakWe are still looking for that neckline breakdown to happen from our "double top" pattern.
As soon as we get the break of the neckline, this would send the price back to lower zones (where the first target would be the 200 EMA zone at $86K, then the lower support zone).
Swallow Team

btc 2017-2025Ignore the noise and donte be shaken, the CRYPTOCAP:BTC run will continue to be as epic and violent as the 2017 run!

BTC/USDT Technical Analysis – Bearish Outlookhello guys.
Market Structure & Pattern
Bitcoin is forming a descending wedge, with lower highs indicating weakening bullish momentum.
The price is testing the ascending trendline support, which, if broken, could lead to further downside.
Anticipated Move
A short-term bounce may occur, but a rejection from resistance is expected.
BTC is likely to break below support, leading to a move toward the $80,000 - $81,000 demand zone.
Key Levels to Watch
Resistance: $89,200 – $90,000 (Potential rejection area)
Support: $85,000 (trendline), then $80,000 - $81,000 (target zone
)
Confirmation & Invalidations
A confirmed break below the trendline supports the bearish outlook.
Bullish invalidation: A strong breakout above $89,200 - $90,000 could shift momentum back to the upside.
---------------------------------
Conclusion
The current structure suggests a bearish breakdown, with a target of $80,000 - $81,000 unless resistance is broken. Monitoring price action at key levels is crucial for confirmation. 🚨

BTC, seed at 78k.. we are goin for new ATH again this year! BTC, corrected heavily after tapping a parabolic ATH high at 108K levels which warranted a mid term trim down -- which is healthy and sustainable.
Price overextended to unforeseen numbers to 70k range to tap 77k levels. An exact precision tap of 61.8 FIB extension zone -- which replicated the same scenario during the 50k era pre-surge season before the massive rally to 100k. Both are bouncing off in this 61.8 fib area with laser accuracy precision which just manifested last night.
We are now at the rare accumulation zone signal -- a pre surge basing area where long term buyers converge after that 61.8 fib perfect tap.
The diagram above is already showing hint of initial shift of the current metrics. The visual clarity of the signal is day and night. You can decipher it easily. This signal never missed since 15k era. Batting average is 4 out of 4.
Ideal seeding was the lowest at 77k.
Target: ATH retap at 108k
Mid target 120-140k levels.
TAYOR.
Trade safely.

BTC | 4H - 1W | MACRO UpdateBTC has seen a clear bearish trend in the 4h timeframe, after the cup and handle pattern failed to play out. We also notice consecutive lower lows and lower highs, a key sign of a bearish trend.
The technical indicators have turned bearish, and from a macro timeframe is shows a stairstep down may be on the cards.
The moving averages in the daily has turned bearish as we lose the 200d MA.
I hate to say it - but BTC is in full fledge bear mode 🐻
________________
BINANCE:BTCUSDT

Bitcoin drops. What's next?Hello, Traders!
Bitcoin price continues to fall towards the next big support area at 74k-70k.
Currently, there is no sign of BTC reversal, and it seems that this correction phase will last long.
Ideally, the faster BTC finds its local bottom, the faster it starts to rise again.
However, the current market conditions suggest that a period of consolidation might be necessary before a meaningful recovery.
I doubt that the BTC price will fall below 70k despite all the negative sentiment surrounding it at the moment.
More likely, we will see strong buying pressure at those levels, as institutional investors and long-term holders step in to accumulate at what they perceive as a discount.
Also, the stochastic RSI on a weekly scale has dropped to 0, which historically indicates that momentum is oversold and a potential reversal could be near.
If we see a bullish cross on the SRSI on a weekly timeframe, this might act as a catalyst for a price rebound, possibly pushing BTC toward new highs.
Another indication of a possible bottom is the Fear & Greed Index, which currently sits at around 20.
This level reflects extreme fear in the market, a condition that has often preceded local bottoms in previous cycles.
Historically, such extreme fear tends to trigger a shift in sentiment, leading to increased demand and a subsequent price recovery.
Furthermore, on-chain metrics suggest that long-term holders remain unfazed by the recent downturn, with exchange reserves continuing to decline. This indicates that a significant portion of BTC supply is being moved to cold storage, reducing selling pressure.
Additionally, open interest in the futures market has seen a decline, which could mean that excessive leverage is being flushed out—a necessary step for a healthier market structure.
If BTC manages to hold the 70k support level and confirms a reversal with increasing volume, we could see a strong recovery phase unfold.
However, if the price breaks below this key support, the next significant area to watch would be around 65k, where additional buying interest might emerge.
Please don’t forget to boost this idea and leave your comments below.

$BTC is literally running the 2016-2017 dynamics!Bitcoin is literally following the 2016-2017 period, which momentum confirms

Next Volatility Period: Starting around March 15
Hello, traders.
If you "Follow", you can always get new information quickly.
Please click "Boost" as well.
Have a nice day today.
-------------------------------------
(BTCUSDT 1W chart)
The key is whether it can receive support and rise near the 2nd section.
If not, it is expected to eventually meet the M-Signal indicator on the 1M chart and determine the trend again.
As a result, I think it is highly likely that it will meet the M-Signal indicator on the 1M chart near 73499.86.
-
(BTCUSD 1W chart)
This is the second time that the StochRSI indicator has been maintained at the lowest point (0).
This means that the decline is strong.
In the case of 2014, it formed a bottom section about 15 weeks after that.
We will also have to watch to see if the HA-Low indicator on the 1W chart is generated due to this decline.
-
(BTCUSDT 1D chart)
The key is whether it can be supported near the Fibonacci ratio range of 1.414 (79902.66) ~ 2 (80999.68) and rise above 84349.94.
If not, I think it is highly likely that the trend will be determined again when it meets the M-Signal indicator on the 1M chart near 73499.86.
The next volatility period is expected to start around March 15 (March 14-16) and continue around March 25 (March 24-26).
The point of interest is whether it can break out of the downward channel after this volatility period.
-
Following USDT, USDC is also renewing its ATH.
I think this is a sign that a lot of money is flowing into the coin market.
Therefore, even if the current coin market falls, if USDT and USDC maintain their gap upward trend, the coin market is expected to recover quickly.
Accordingly, we need to think about ways to increase the number of coins (tokens) currently held.
-
Thank you for reading to the end.
I hope you have a successful transaction.
--------------------------------------------------
- Big picture
I used TradingView's INDEX chart to check the entire range of BTC.
(BTCUSD 12M chart)
Looking at the big picture, it seems to have been maintaining an upward trend following a pattern since 2015.
In other words, it is a pattern that maintains a 3-year upward trend and faces a 1-year downward trend.
Accordingly, the upward trend is expected to continue until 2025.
-
(LOG chart)
Looking at the LOG chart, we can see that the upward trend is decreasing.
Accordingly, the 46K-48K range is expected to be a very important support and resistance range from a long-term perspective.
Therefore, it is expected that prices below 44K-48K will not be seen in the future.
-
The Fibonacci ratio on the left is the Fibonacci ratio of the uptrend that started in 2015.
In other words, it is the Fibonacci ratio of the first wave of the uptrend.
The Fibonacci ratio on the right is the Fibonacci ratio of the uptrend that started in 2019.
Therefore, it is expected that this Fibonacci ratio will be used until 2026.
-
No matter what anyone says, the chart has already been created and is already moving.
It is up to you how to view and respond to this.
If the ATH is renewed, there are no support and resistance points, so the Fibonacci ratio can be appropriately utilized.
However, although the Fibonacci ratio is useful for chart analysis, it is ambiguous to use it as support and resistance.
The reason is that the user must directly select the important selection points required to generate Fibonacci.
Therefore, since it is expressed differently depending on how the user specifies the selection points, it can be useful for chart analysis, but it can be seen as ambiguous to use it for trading strategies.
1st: 44234.54
2nd: 61383.23
3rd: 89126.41
101875.70-106275.10 (when overshooting)
4th: 134018.28
151166.97-157451.83 (when overshooting)
5th: 178910.15
-----------------

Bitcoin will be super bullish soon (1D)The market maker has created a scenario that makes everyone believe the bear market started a while ago. However, there are signs on the chart showing that Bitcoin may register a new ATH.
The best zone for rebuying Bitcoin is the green area.
From the green zone, we expect Bitcoin to move toward the specified targets.
The closure of a daily candle below the invalidation level will invalidate this analysis.
Do not enter the position without capital management and stop setting
Comment if you have any questions
thank you

ETH ? Free money at this point... good luckEthereum... absolutely oversold ! undervalued !
What to do ? BUY THE DIP. Don't think too much.
Just buy the DIIIIIIIIIIPPPPPP !!!

BITCOIN — THE SUPPORT LINEBitcoin’s ultimate support for bulls lies between the two black lines shown above.

Can Bitcoin reverse its trend?BTC is at horizontal support that can pivot the short-term trend. However, without market structure pivoting and breaking the short-term trend the trend is likely our friend. A confirmed higher low and higher high would build a strong bullish thesis.
Full TA: Link in the BIO
