Diamond Bottom on Bitcoin 4HOn the chart above we can see a clear diamond bottom forming on Bitcoin's 4 hourly chart. This formation could cause BTC to rise to the level of $17,500 where it is also proven to be a diligent support. Lets see if the next few candles can manage to break the resistance of the pattern, which I believe is likely as we have a bull flag forming on lower timeframes.
Btcusdlong

BTC ANALYSIS#BTC UPDATE.
#BTC is still facing the red area as the resistance and not been able to close above on 4H TF.If btc close above the red box area there must be some recovery in the btc price but still need a close above the resistance for that.

$BTC #BTC #Bitcoin #Elliottwave Buy Setup Wave 5.This count is based on my assumptions so anything can happen not a trading or financial advice just for educational purposes only kindly do your own ta thanks trade with care good luck.

$BTC #BTC #Bitcoin #Elliottwave Buy Setup.This count is based on my assumptions so anything can happen not a trading or financial advice just for educational purposes only kindly do your own ta thanks trade with care good luck.

$BTC #BTC #Bitcoin #Elliottwave Buy Setup.Alternate.
This count is based on my assumptions so anything can happen not a trading or financial advice just for educational purposes only kindly do your own ta thanks trade with care good luck.

BTC/USD 1DAY UPDATE BY CRYPTO SANDERSHello, welcome to this BTC /USD 1DAY chart update by CRYPTOSANDERS.
I have tried to bring the best possible outcome to this chart.
CHART ANALYSIS:-Bitcoin ( BTC )continued to consolidate ahead of this afternoon’s third quarter GDP data from the United States.
This afternoon’s figures are expected to show growth of 2.9% in the quarter, as inflation in the U.S. began to slow down.
BTC/USD hit a high of $16,895.71 ahead of the data release, which is marginally higher than Wednesday’s bottom at $16,755.91.
Looking at the chart, today’s consolidation comes as the 14-day relative strength index (RSI) continued to hover near a support point at 46.00.
As of writing, the index is tracking at the 46.49 level and could be set to break out of this point at any moment.
Should this occur, bearish sentiment will likely return to the market, with prices heading toward $16,500.
This is not a piece of financial advice.
Hit the like button if you like it and share your charts in the comments section.
Thank you

CRYPTO | BITCOIN | BTCUSDT -DECRYPTERSHi People Welcome To our Page
We currently expecting prices to go upside for short term based on6 confirmations and liquidation hunt

BNB ANALYSIS#BNB UPDATE.
#BNB is currently trading in ascending triangle where blue box and pink line qare the resistance bnb is currently facing.For now bnb needs to close above the blue box area for upside move however if bnb loses the black line support then it might again test the net support level.

ADA ANALYSIS#ADA UPDATE.
#ADA is currently trading in falling wedge supported by the Bullish RSI on 3H TF suggesting some upside move if ada breaks above the falling wedge.

DOT ANALYSIS#DOT UPDATE.
#since dot got break below to the descending triangle and the move was about 20% .it is most likely that we might see dot testing the green line support before making any further move.

BTC ANALYSIS#BTC UPATE.
#BTC is now trading in accumulation range where red box then the black line is the resistance.Since we got rejection from the red box area on daily is is most likely that we might see pullback again in btc ,however if btc closes above the red box resistance we are likely to see some upside move from here.

Bitcoin Market UpdateBitcoin Market Update
Entry $16600
Entry $16400
SL $16240
TP $17200
As new traders here, we're waiting for your feedback. Please like and comment on our ideas, and feel free to ask any questions in the comments. We'll do our best to respond to them all.
We wish you all a nice day and success in your trading today!

$BTC #BTC #Bitcoin #Elliottwave Buy Setup.This count is based on my assumptions so anything can happen not a trading or financial advice just for educational purposes only kindly do your own ta thanks trade with care good luck.

BTC ANALYSIS#BTC UPDATE.
#BTC is facing resistance at the 20 SMA on BB band ,if btc closes above the 20SMA the black line is the next major resistance for with blue box as the support on daily.We still do not have a clear btc move ahead as btc seems to be trading in accumulation range but the chances of the flash move are still high.

BTC DOMINANCE UPDATE (Wyckoff Accumulation )Wyckoff accumulation looks like it is confirming (Up 5.7% since last post). Easier to see on weekly for the critics lol.

$BTC #BTC #Bitcoin #Elliottwave Buy Setup Wave 5.This count is based on my assumptions so anything can happen not a trading or financial advice just for educational purposes only kindly do your own ta thanks trade with care good luck.


btc usdt we will see 128k 2024/2025 if you have
in 2005
if you have 10k$ now ypo can buy 2 big mac with it
if you have 10k gbp now you have 7.8k
if you have 10k eur now you have 7.2k
if you bought 10k gold you have 60k
if you bought 1$ btc now you have 16k lolllll

Trading opportunity for BTCUSDTBased on technical factors there is a Buy position in :
📊 BTCUSDT
🔵 Buy Now 16931.16
🧯 Stop loss 16510.90
🏹 Target 1 17168.10
🏹 Target 2 17517.00
🏹 Target 3 18078.45
💸RISK : 1%
We hope it is profitable for you ❤️
Please support our activity with your likes👍 and comments📝

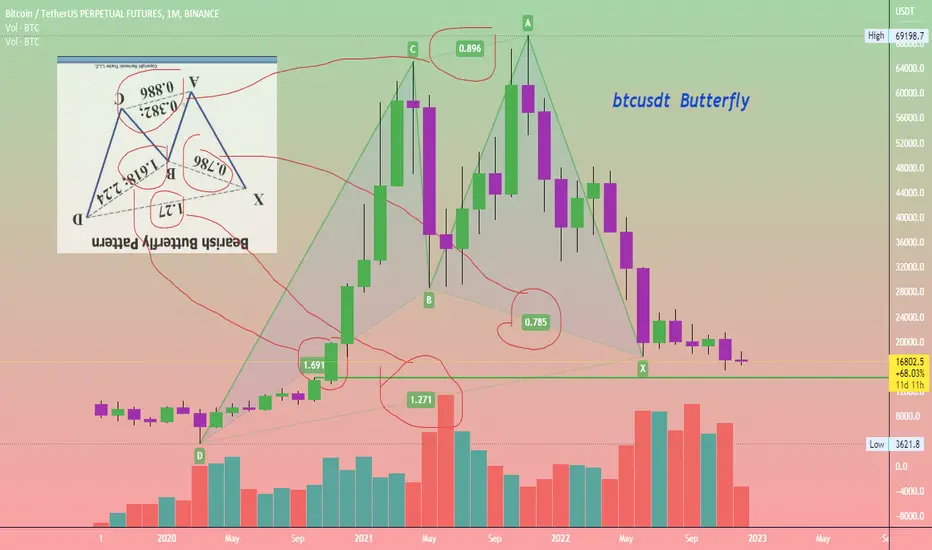
Btcusdt also Completed Harmonic on 1 Month time frameBtcusdt also Completed Harmonic (Butterfly) Pattern in Different way on 1 Month time frame
we can Expect we are near to to the Bottom .
DYOR
NFA
BTC ANALYSIS#BTC UPDATE.
#BTC is currently trading just outside the BB and the BB window is about 2%,therefore I do expect a sharp move soon.The next move could be either direction and likely to be huge about 5-10%.Will update son on any new btc info.

Monthly Chart of Bitcoin!
BTC needs to be closed above 19.7k region to be bullish on this Monday, that'll be the end of the month. Keep an eye!!

